| Param | Original file | Final file |
|---|---|---|
| Filename | modeM0/AS1A12_077T06_9000005430_39050cztM0_level2.fits | modeM0/AS1A12_077T06_9000005430_39050cztM0_level2_quad_clean.evt |
| Size (bytes) | 575,481,600 | 81,204,480 |
| Size | 548.8 MB | 77.4 MB |
| Events in quadrant A | 11,248,452 | 276,932 |
| Events in quadrant B | 2,595,828 | 641,983 |
| Events in quadrant C | 2,664,039 | 609,397 |
| Events in quadrant D | 4,356,034 | 535,911 |
| Mode M9 | |||
|---|---|---|---|
| Quadrant | BADHDUFLAG | Total packets | Discarded packets |
| A | 0 | 21 | 0 |
| B | 0 | 21 | 0 |
| C | 0 | 21 | 0 |
| D | 0 | 22 | 0 |
| Mode M0 | |||
|---|---|---|---|
| Quadrant | BADHDUFLAG | Total packets | Discarded packets |
| A | 0 | 37321 | 3 |
| B | 0 | 11550 | 2 |
| C | 0 | 11414 | 2 |
| D | 0 | 16833 | 2 |
| Mode SS | |||
|---|---|---|---|
| Quadrant | BADHDUFLAG | Total packets | Discarded packets |
| A | 0 | 116 | 0 |
| B | 0 | 116 | 0 |
| C | 0 | 116 | 0 |
| D | 0 | 116 | 0 |
| Quadrant | Total seconds | Saturated seconds | Saturation percentage |
|---|---|---|---|
| A | 5633 | 3536 | 62.772945% |
| B | 5633 | 14 | 0.248535% |
| C | 5633 | 4 | 0.071010% |
| D | 5633 | 387 | 6.870229% |
Noise dominated data is calculated using 1-second bins in cleaned event files. If a bin has >2000 counts, and if more than 50% of those come from <1% of pixels, then it is considered to be noise-dominated and hence unusable.
| Quadrant | # 1 sec bins | Bins with >0 counts | Bins with >2000 counts | High rate bins dominated by noise | Noise dominated (total time) | Noise dominated (detector-on time) | Marked lightcurve |
|---|---|---|---|---|---|---|---|
| A | 7187 | 5634 | 3451 | 3451 | 48.02% | 61.25% | 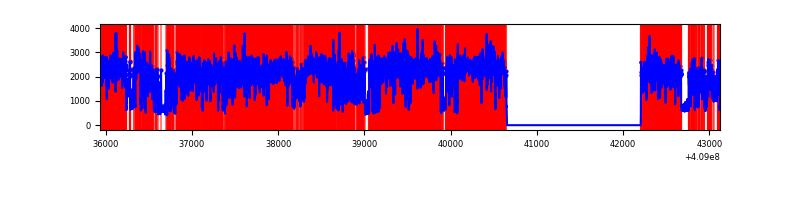 |
| B | 7187 | 5634 | 8 | 8 | 0.11% | 0.14% | 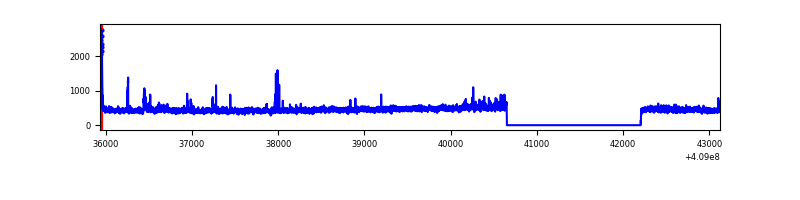 |
| C | 7187 | 5634 | 1 | 1 | 0.01% | 0.02% | 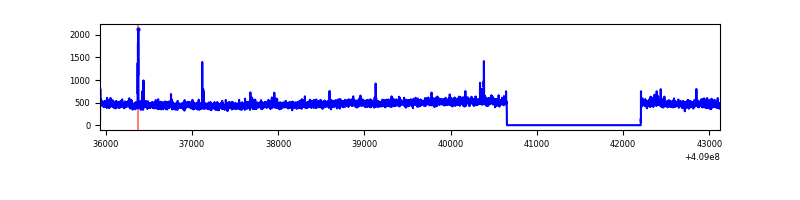 |
| D | 7187 | 5634 | 360 | 360 | 5.01% | 6.39% | 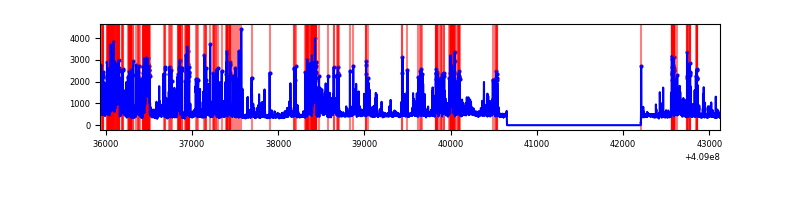 |
Top three noisy pixels from each quadrant. If the there are fewer than three noisy pixels in the level2.evt file, extra rows are filled as -1
| Pixel properties | Quadrant properties | ||||||
|---|---|---|---|---|---|---|---|
| Quadrant | DetID | PixID | Counts | Sigma | Mean | Median | Sigma |
| A | 15 | 222 | 8907812 | 88766.07 | 494 | 484 | 100.3 |
| A | 10 | 83 | 345221 | 3435.48 | 494 | 484 | 100.3 |
| A | 13 | 210 | 66443 | 657.32 | 494 | 484 | 100.3 |
| B | 0 | 190 | 79033 | 646.74 | 623 | 607 | 121.3 |
| B | 5 | 172 | 50927 | 414.96 | 623 | 607 | 121.3 |
| B | 12 | 111 | 15644 | 124.0 | 623 | 607 | 121.3 |
| C | 15 | 214 | 237270 | 1655.41 | 610 | 614 | 143.0 |
| C | 15 | 208 | 22011 | 149.67 | 610 | 614 | 143.0 |
| C | 14 | 254 | 14268 | 95.51 | 610 | 614 | 143.0 |
| D | 2 | 249 | 1050895 | 7279.38 | 595 | 578 | 144.3 |
| D | 1 | 47 | 580074 | 4016.28 | 595 | 578 | 144.3 |
| D | 12 | 227 | 181800 | 1255.99 | 595 | 578 | 144.3 |
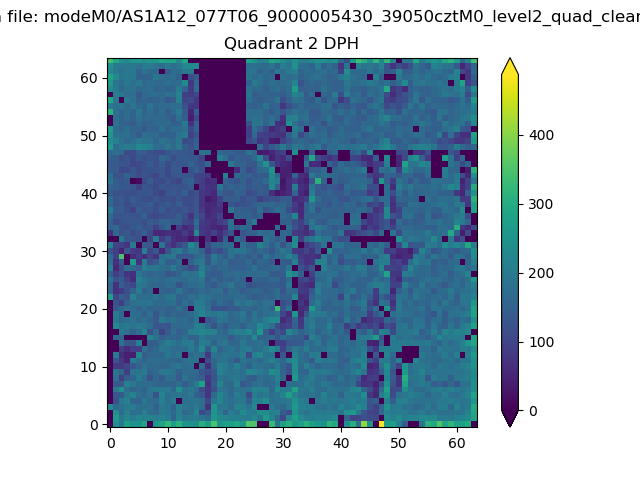
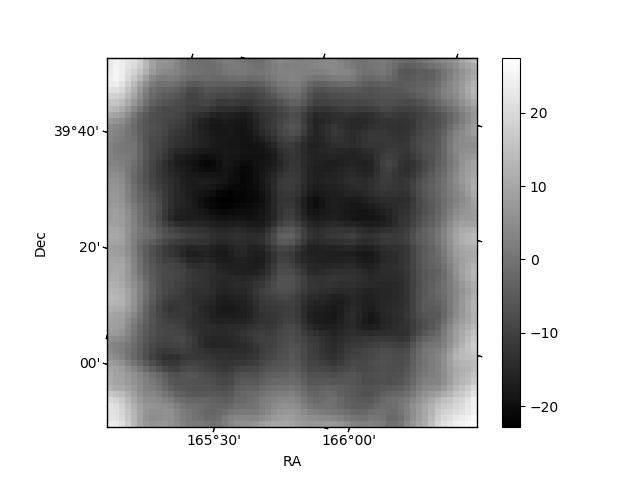
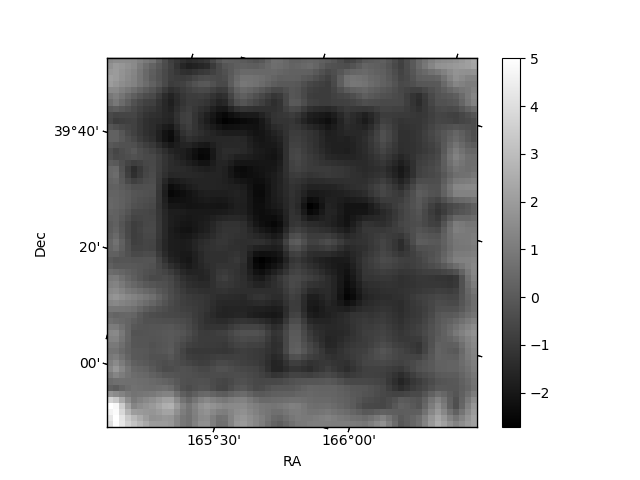
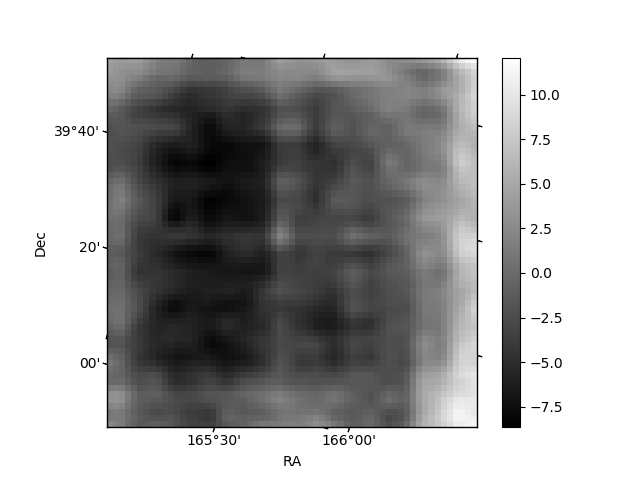
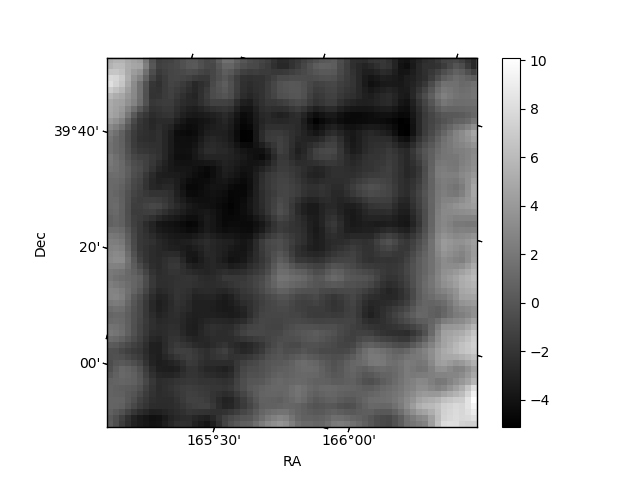
Histogram calculated using DETX and DETY for each event in the final _common_clean file
| Quadrant A | 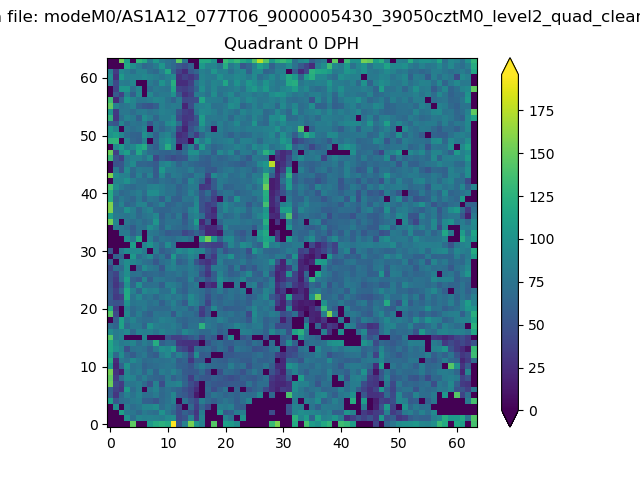 |
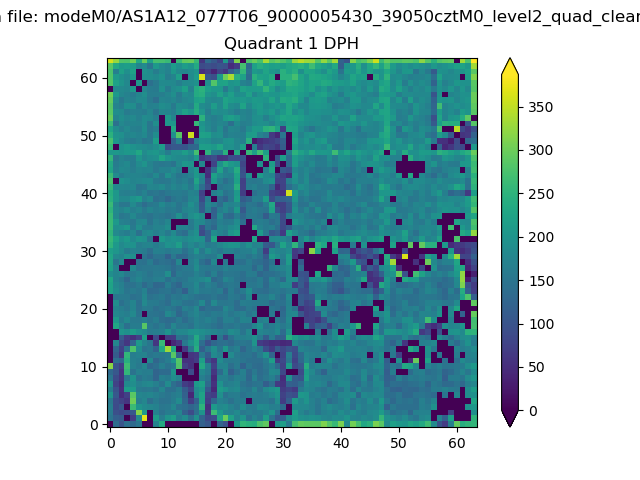 |
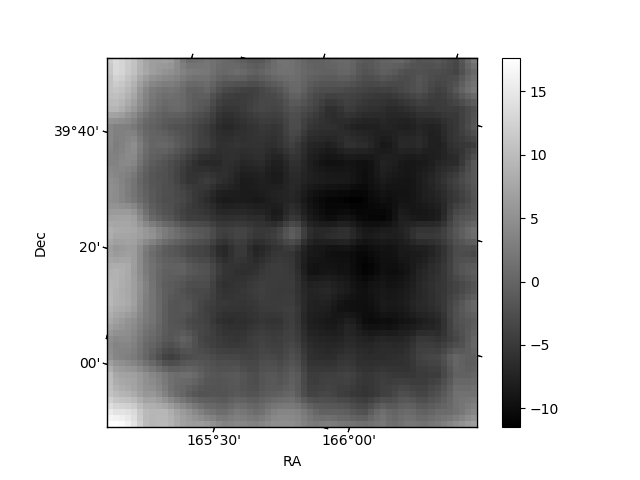
Quadrant B |
|---|---|---|---|
| Quadrant D | 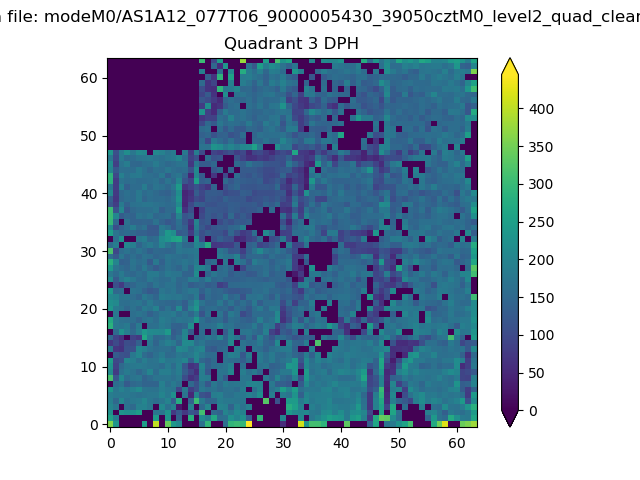 |
 |
Quadrant C |
| Plot type | Count rate plots | Images |
|---|---|---|
| Comparison with Poisson distribution Blue bars denote a histogram of data divided into 1 sec bins. Red curve is a Poisson curve with rate = median count rate of data. |
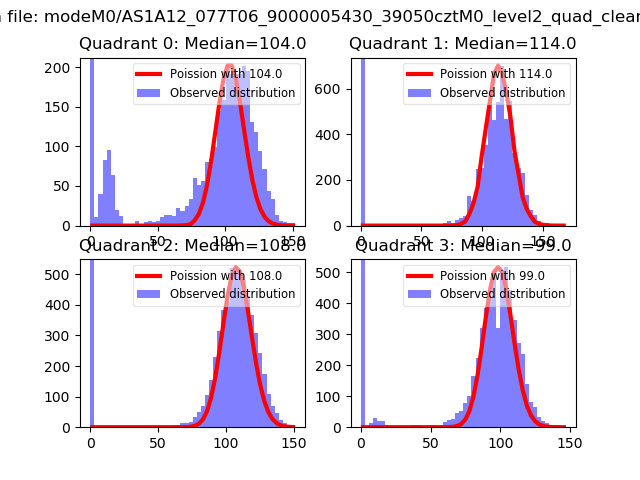 |
 |
| Quadrant-wise count rates Data is divided into 100 sec bins |
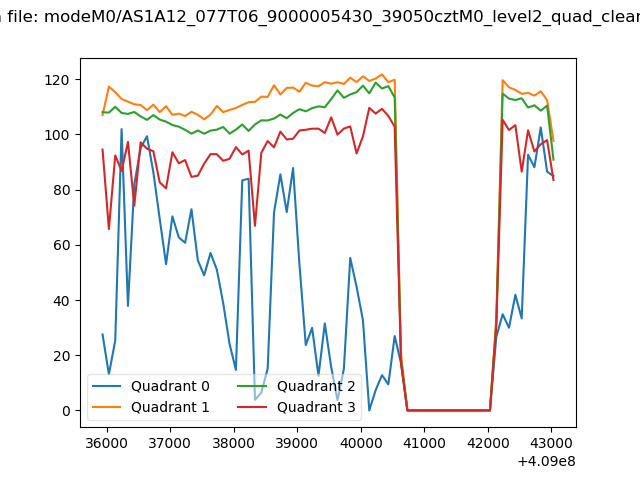 |
|
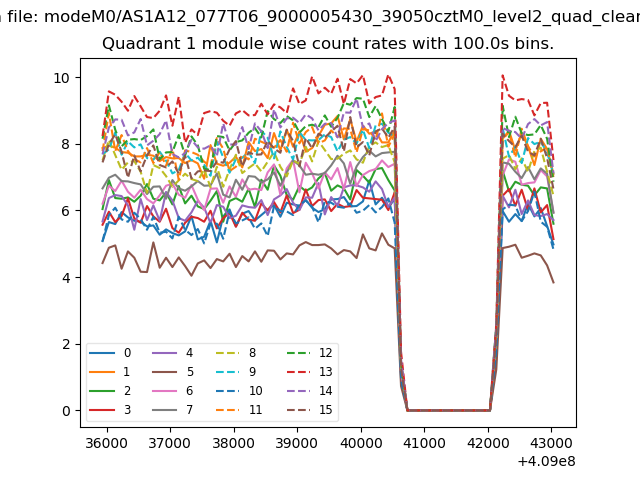
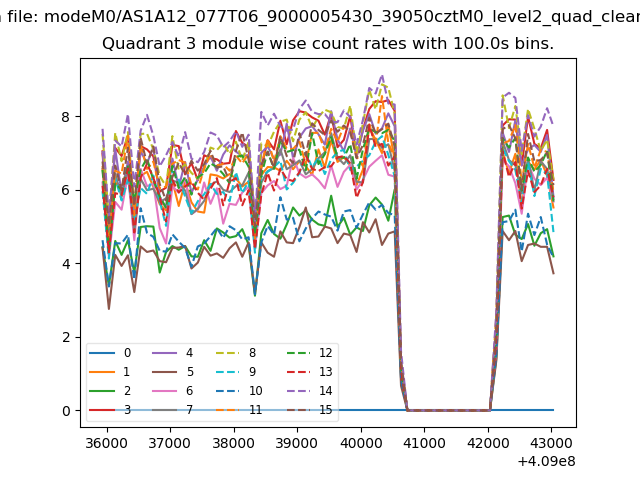
| Module-wise count rates for Quadrant A Data is divided into 100 sec bins |
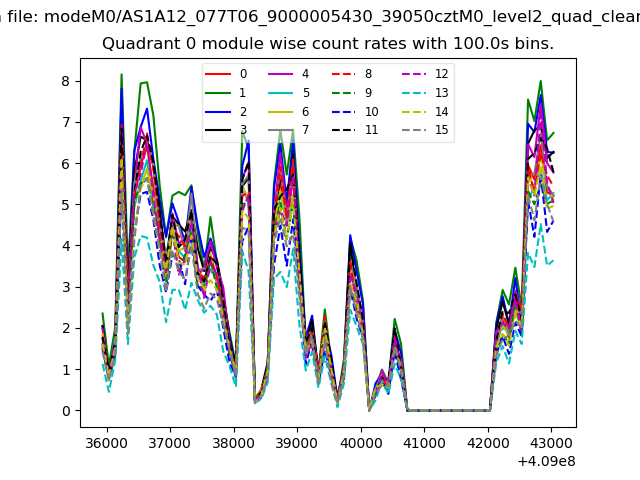 |
 |
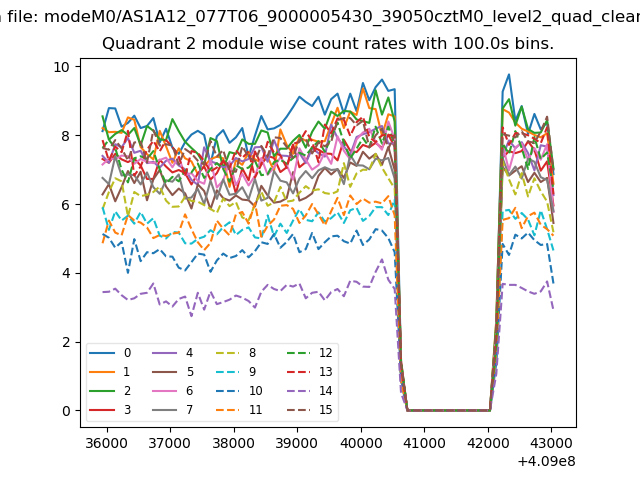
| Module-wise count rates for Quadrant B Data is divided into 100 sec bins |
 |
 |
| Module-wise count rates for Quadrant C Data is divided into 100 sec bins |
 |
 |
| Module-wise count rates for Quadrant D Data is divided into 100 sec bins |
 |
 |
| Parameter | Plot |
|---|---|
| CZT HV Monitor | 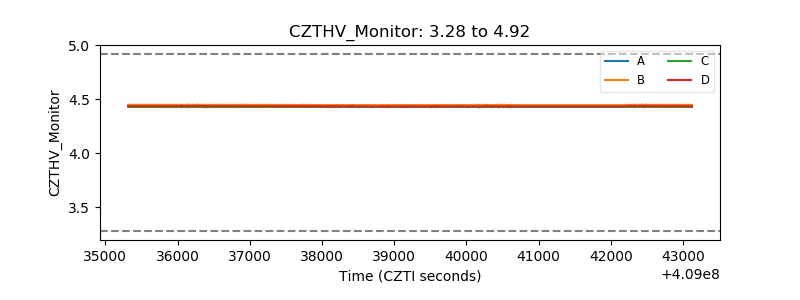 |
| D_VDD | 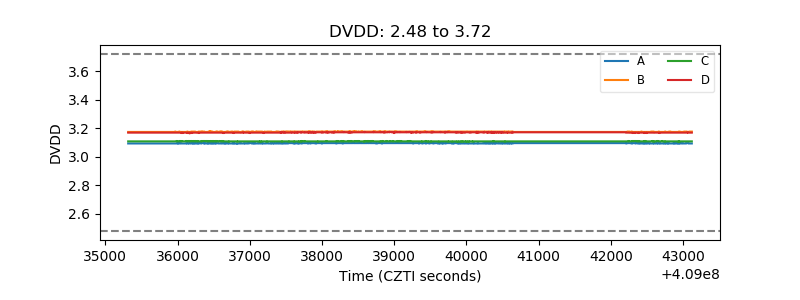 |
| Temperature 1 | 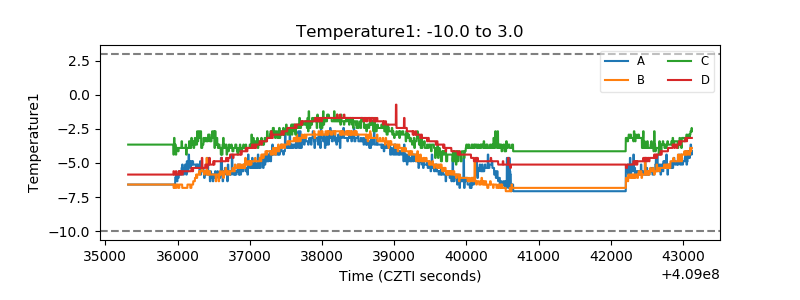 |
| Veto HV Monitor | 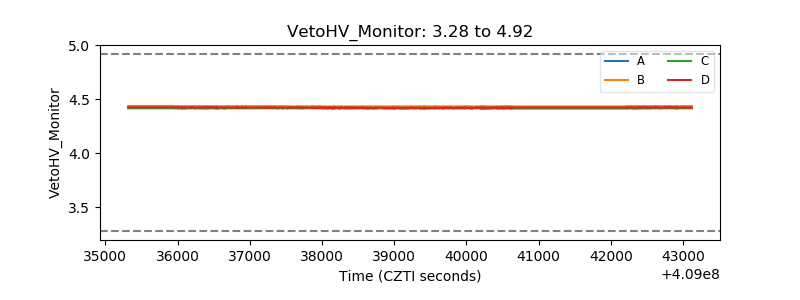 |
| Veto LLD | 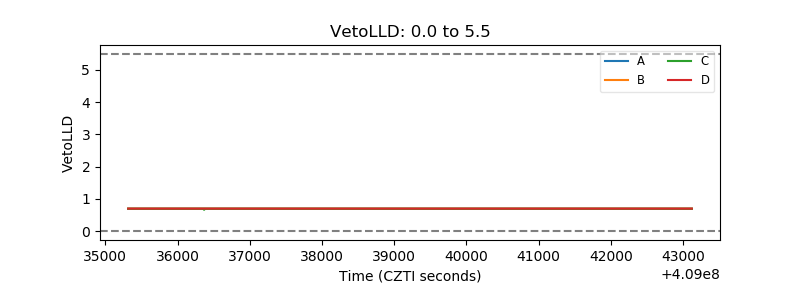 |
| Alpha Counter | 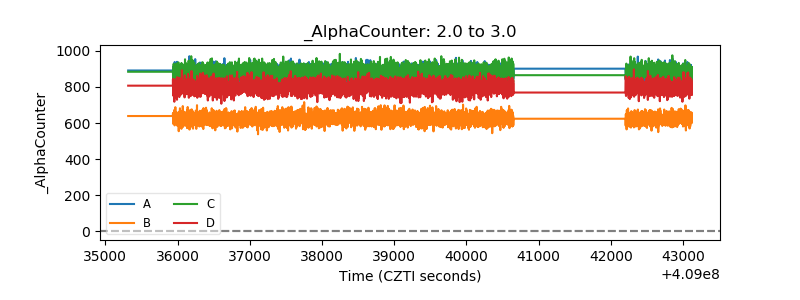 |
| _CPM_Rate | 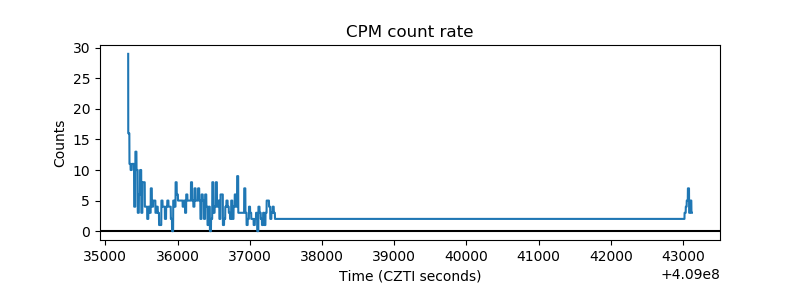 |
| CZT Counter | 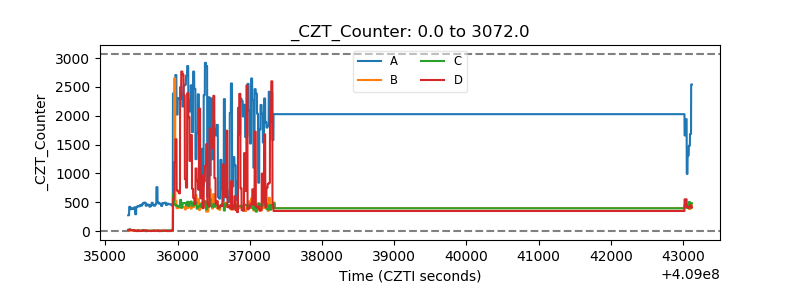 |
| +2.5 Volts monitor | 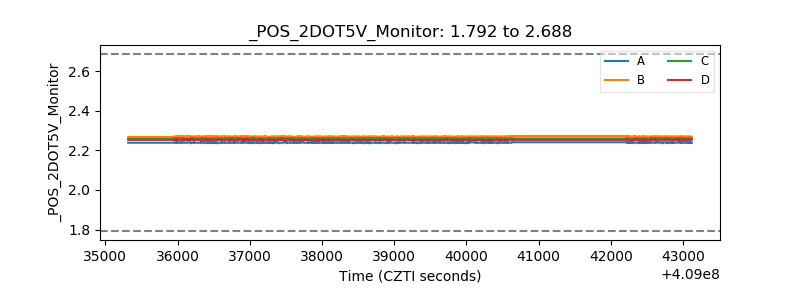 |
| +5 Volts monitor | 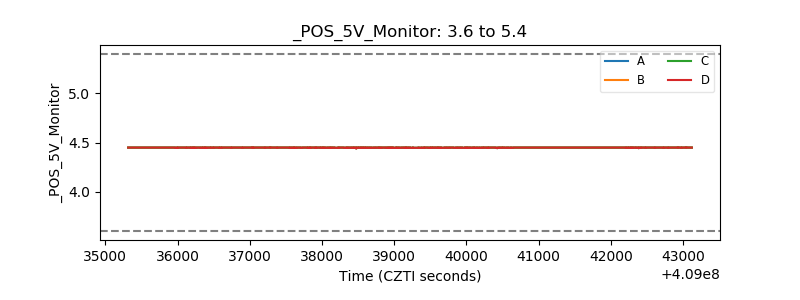 |
| _ROLL_ROT | 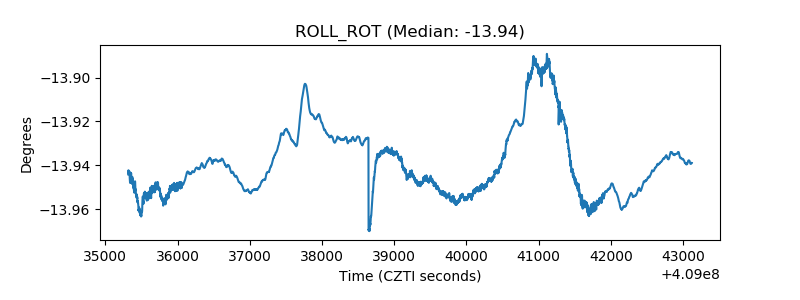 |
| _Roll_DEC | 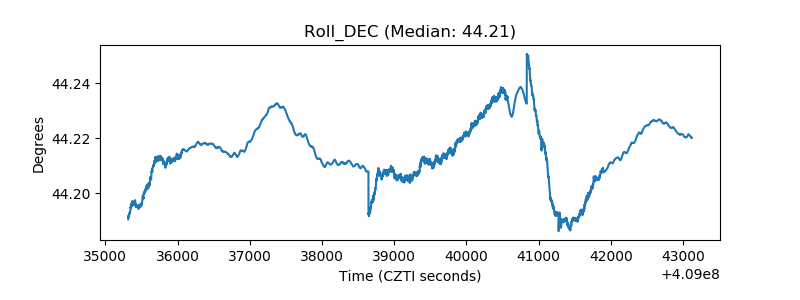 |
| _Roll_RA | 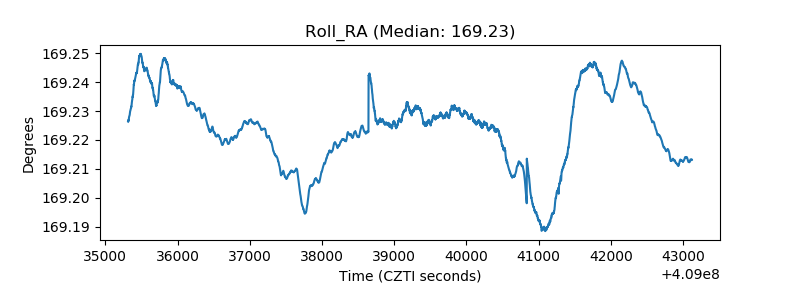 |
| Veto Counter | 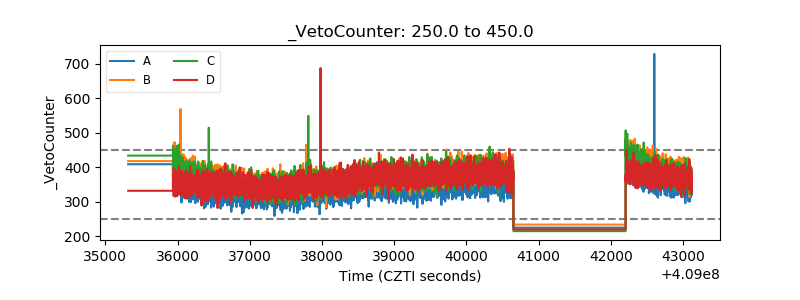 |