| Param | Original file | Final file |
|---|---|---|
| Filename | modeM0/AS1A12_077T06_9000005430_39051cztM0_level2.fits | modeM0/AS1A12_077T06_9000005430_39051cztM0_level2_quad_clean.evt |
| Size (bytes) | 495,095,040 | 85,944,960 |
| Size | 472.2 MB | 82.0 MB |
| Events in quadrant A | 8,811,991 | 452,783 |
| Events in quadrant B | 2,440,483 | 635,275 |
| Events in quadrant C | 2,666,248 | 600,589 |
| Events in quadrant D | 3,985,808 | 532,720 |
| Mode M9 | |||
|---|---|---|---|
| Quadrant | BADHDUFLAG | Total packets | Discarded packets |
| A | 0 | 20 | 0 |
| B | 0 | 20 | 0 |
| C | 0 | 20 | 0 |
| D | 0 | 21 | 0 |
| Mode M0 | |||
|---|---|---|---|
| Quadrant | BADHDUFLAG | Total packets | Discarded packets |
| A | 0 | 29993 | 3 |
| B | 0 | 10927 | 2 |
| C | 0 | 11162 | 2 |
| D | 0 | 15521 | 2 |
| Mode SS | |||
|---|---|---|---|
| Quadrant | BADHDUFLAG | Total packets | Discarded packets |
| A | 0 | 112 | 0 |
| B | 0 | 112 | 0 |
| C | 0 | 112 | 0 |
| D | 0 | 112 | 0 |
| Quadrant | Total seconds | Saturated seconds | Saturation percentage |
|---|---|---|---|
| A | 5434 | 1825 | 33.584836% |
| B | 5434 | 7 | 0.128819% |
| C | 5434 | 16 | 0.294442% |
| D | 5434 | 339 | 6.238498% |
Noise dominated data is calculated using 1-second bins in cleaned event files. If a bin has >2000 counts, and if more than 50% of those come from <1% of pixels, then it is considered to be noise-dominated and hence unusable.
| Quadrant | # 1 sec bins | Bins with >0 counts | Bins with >2000 counts | High rate bins dominated by noise | Noise dominated (total time) | Noise dominated (detector-on time) | Marked lightcurve |
|---|---|---|---|---|---|---|---|
| A | 7136 | 5435 | 1741 | 1741 | 24.40% | 32.03% | 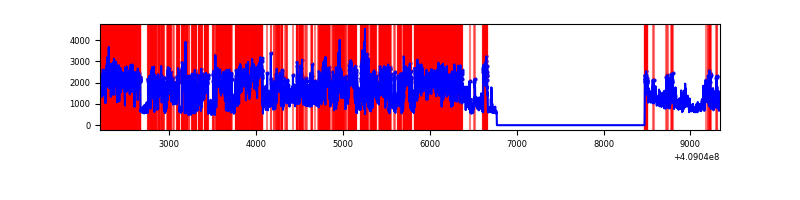 |
| B | 7136 | 5435 | 0 | 0 | 0.00% | 0.00% | 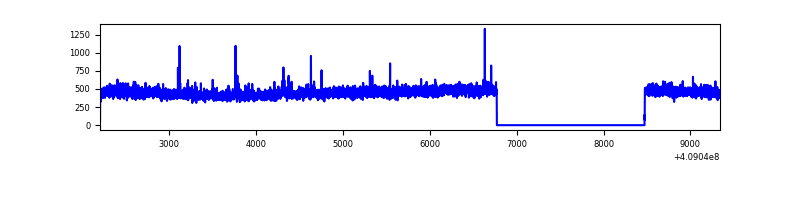 |
| C | 7136 | 5435 | 13 | 13 | 0.18% | 0.24% | 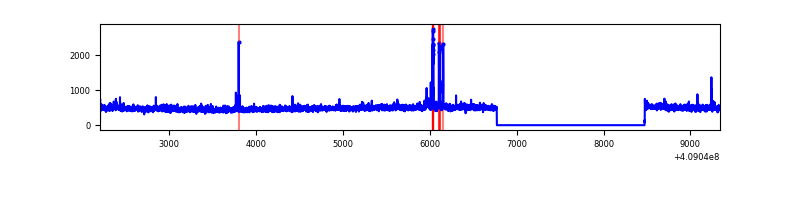 |
| D | 7136 | 5435 | 290 | 290 | 4.06% | 5.34% | 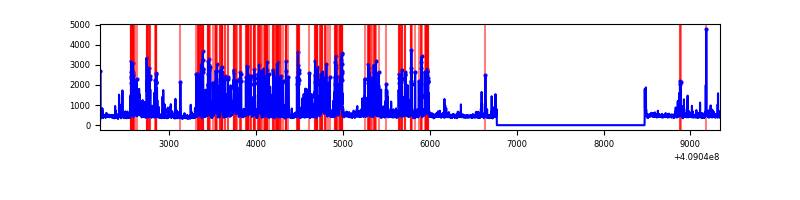 |
Top three noisy pixels from each quadrant. If the there are fewer than three noisy pixels in the level2.evt file, extra rows are filled as -1
| Pixel properties | Quadrant properties | ||||||
|---|---|---|---|---|---|---|---|
| Quadrant | DetID | PixID | Counts | Sigma | Mean | Median | Sigma |
| A | 15 | 222 | 5986775 | 52672.63 | 558 | 547 | 113.6 |
| A | 10 | 83 | 382314 | 3359.16 | 558 | 547 | 113.6 |
| A | 13 | 210 | 247681 | 2174.52 | 558 | 547 | 113.6 |
| B | 12 | 111 | 15339 | 124.97 | 611 | 594 | 118.0 |
| B | 11 | 111 | 13747 | 111.47 | 611 | 594 | 118.0 |
| B | 14 | 111 | 13351 | 108.12 | 611 | 594 | 118.0 |
| C | 15 | 214 | 230899 | 1652.51 | 598 | 602 | 139.4 |
| C | 15 | 208 | 91676 | 653.51 | 598 | 602 | 139.4 |
| C | 15 | 159 | 5848 | 37.64 | 598 | 602 | 139.4 |
| D | 2 | 249 | 1073872 | 7516.18 | 586 | 570 | 142.8 |
| D | 1 | 47 | 555357 | 3885.09 | 586 | 570 | 142.8 |
| D | 12 | 233 | 35156 | 242.2 | 586 | 570 | 142.8 |
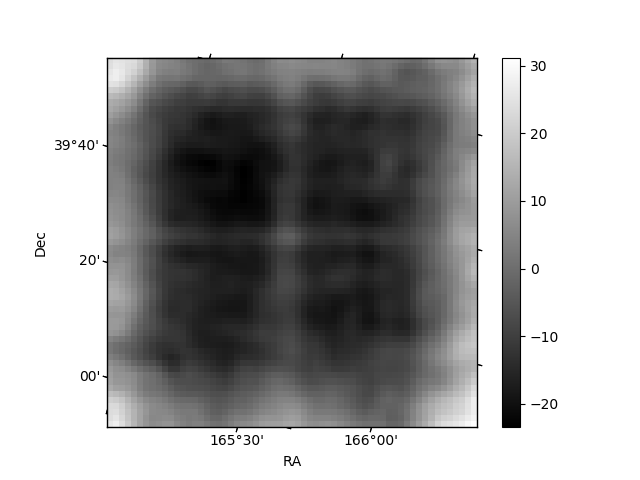
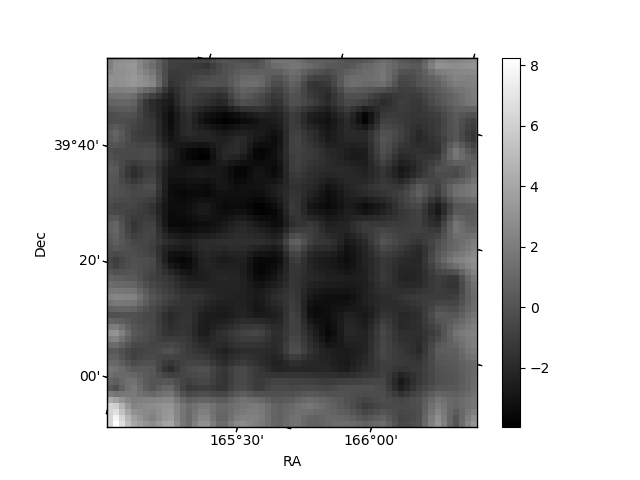
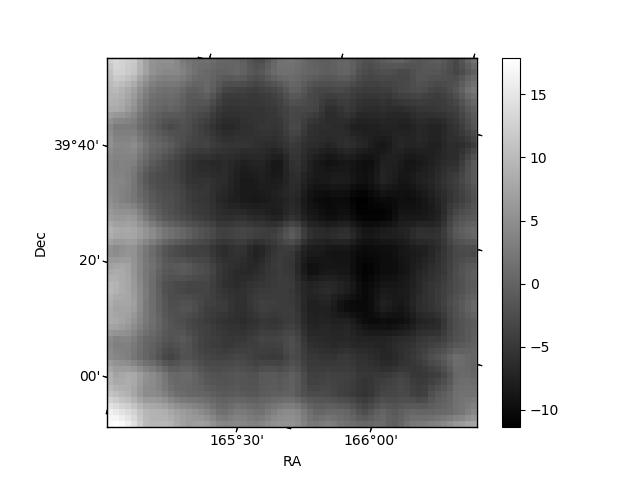
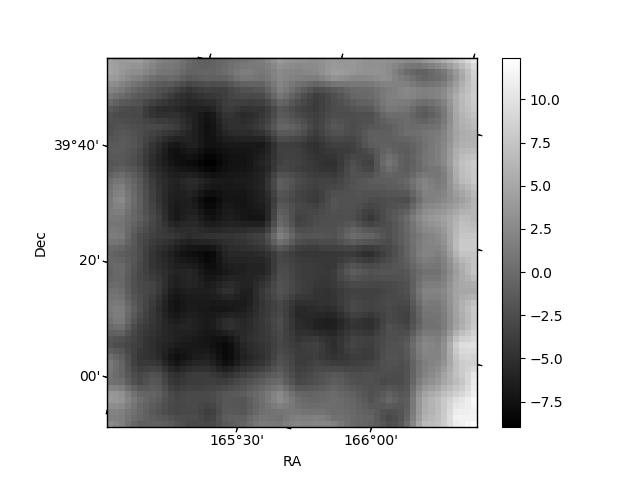
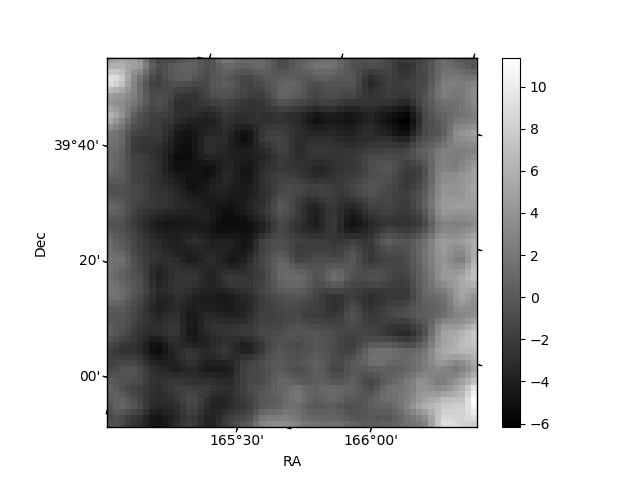
Histogram calculated using DETX and DETY for each event in the final _common_clean file
| Quadrant A | 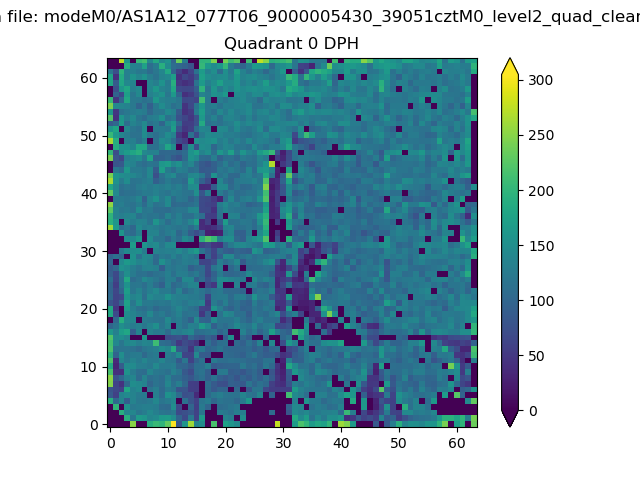 |
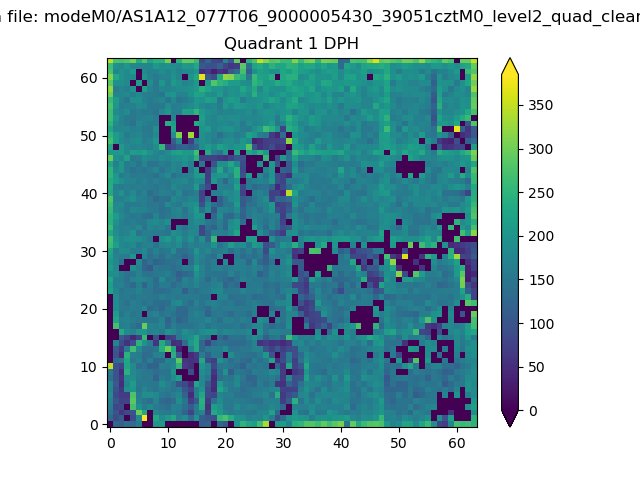 |
Quadrant B |
|---|---|---|---|
| Quadrant D | 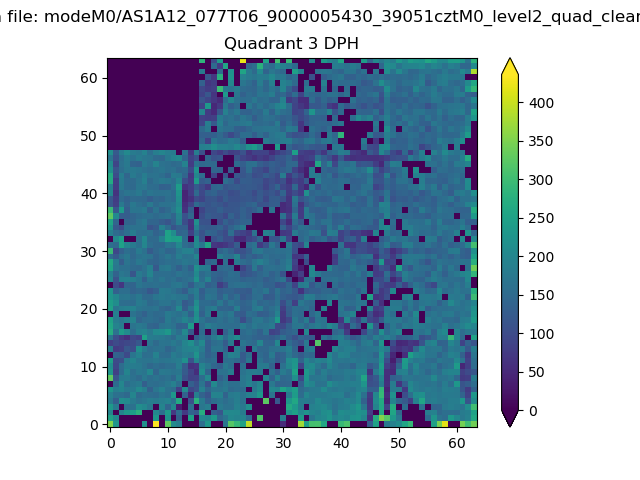 |
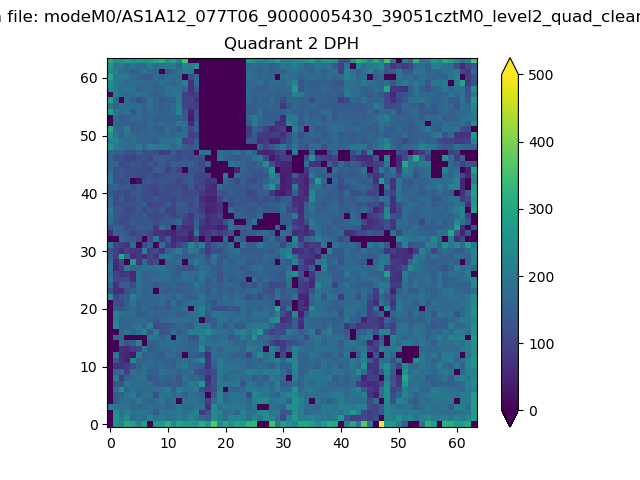 |
Quadrant C |
| Plot type | Count rate plots | Images |
|---|---|---|
| Comparison with Poisson distribution Blue bars denote a histogram of data divided into 1 sec bins. Red curve is a Poisson curve with rate = median count rate of data. |
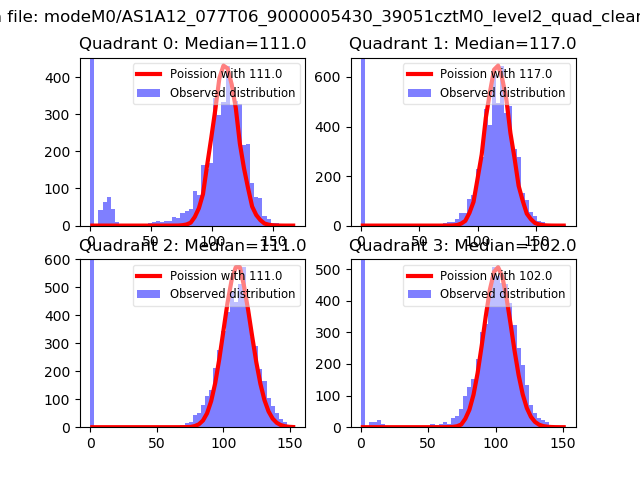 |
 |
| Quadrant-wise count rates Data is divided into 100 sec bins |
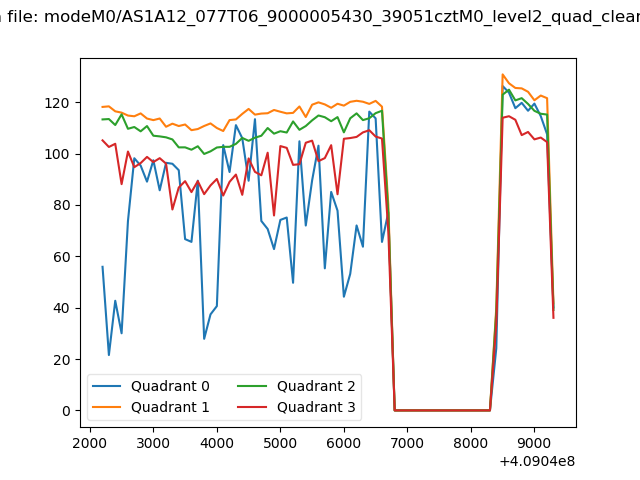 |
|
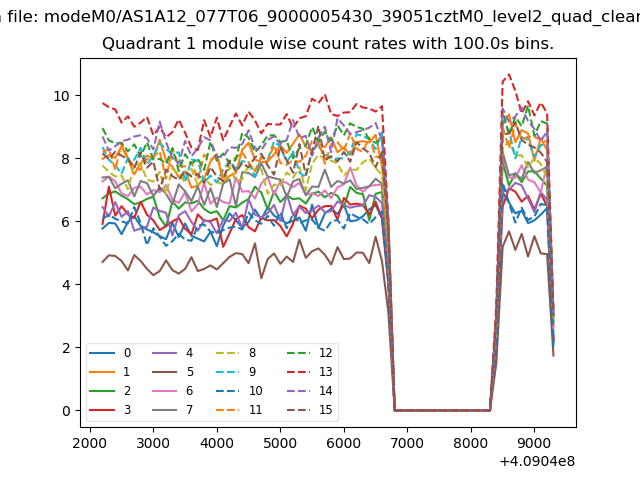
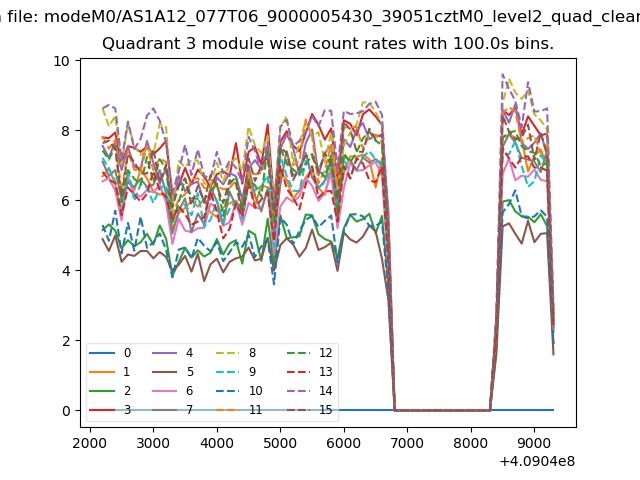
| Module-wise count rates for Quadrant A Data is divided into 100 sec bins |
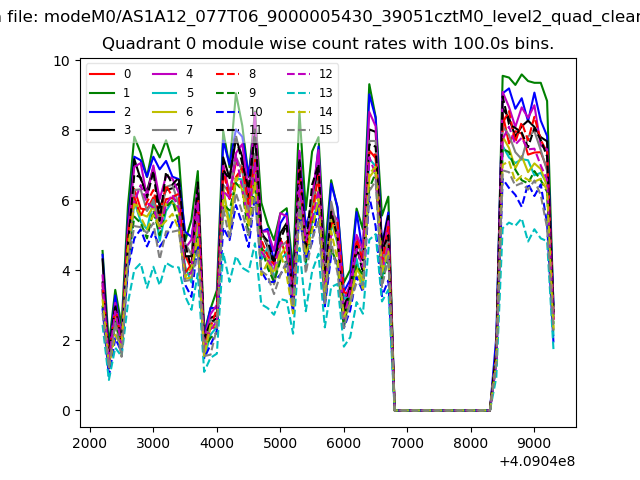 |
 |
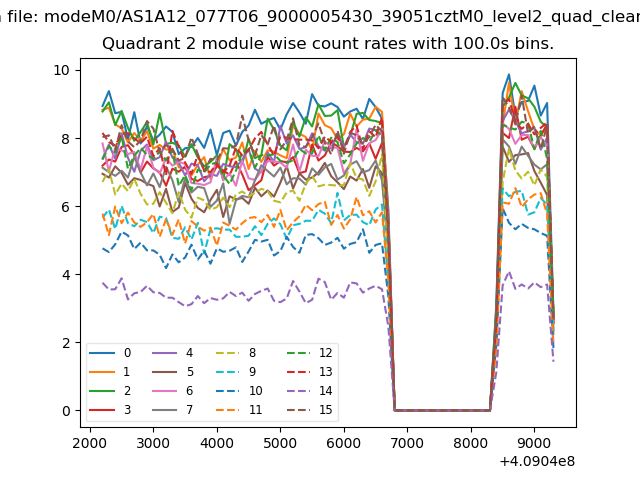
| Module-wise count rates for Quadrant B Data is divided into 100 sec bins |
 |
 |
| Module-wise count rates for Quadrant C Data is divided into 100 sec bins |
 |
 |
| Module-wise count rates for Quadrant D Data is divided into 100 sec bins |
 |
 |
| Parameter | Plot |
|---|---|
| CZT HV Monitor | 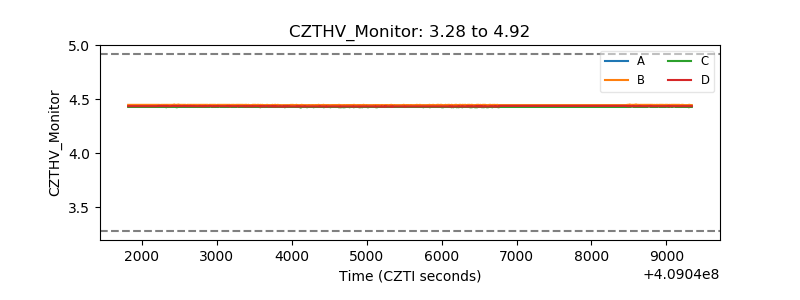 |
| D_VDD | 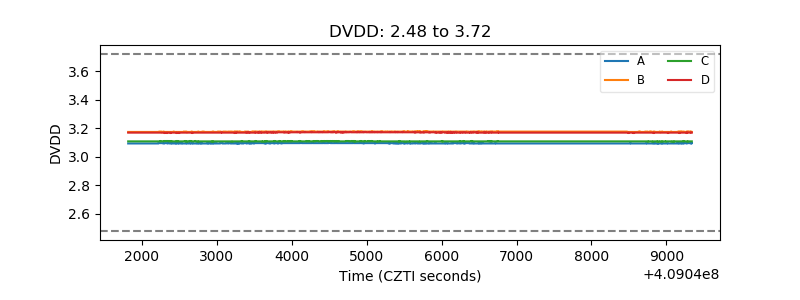 |
| Temperature 1 | 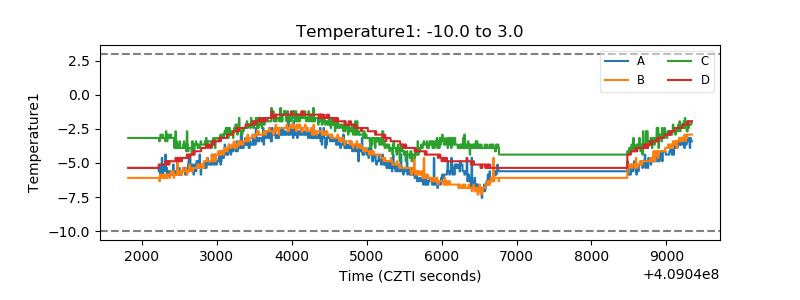 |
| Veto HV Monitor | 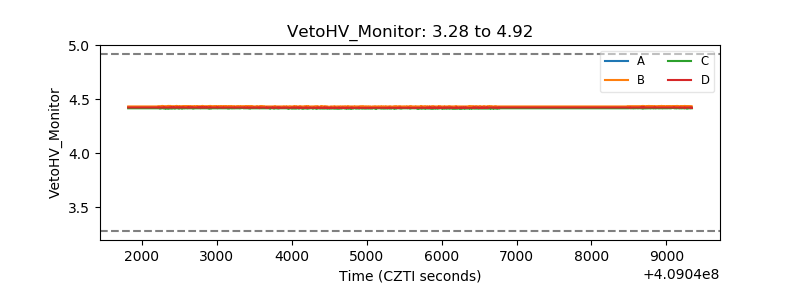 |
| Veto LLD | 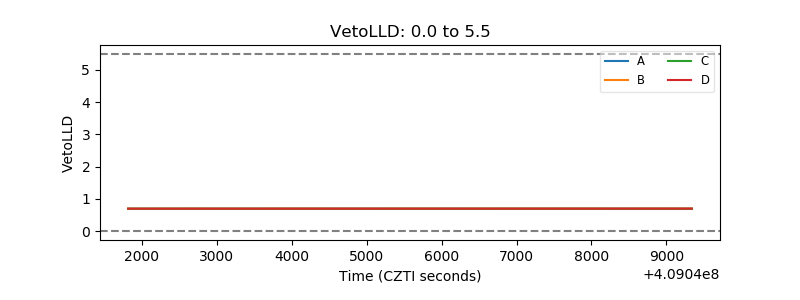 |
| Alpha Counter | 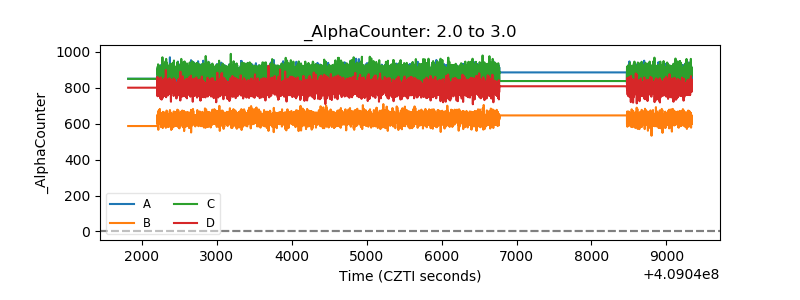 |
| _CPM_Rate | 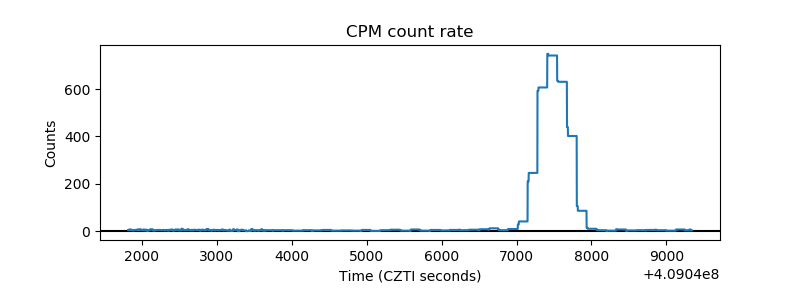 |
| CZT Counter | 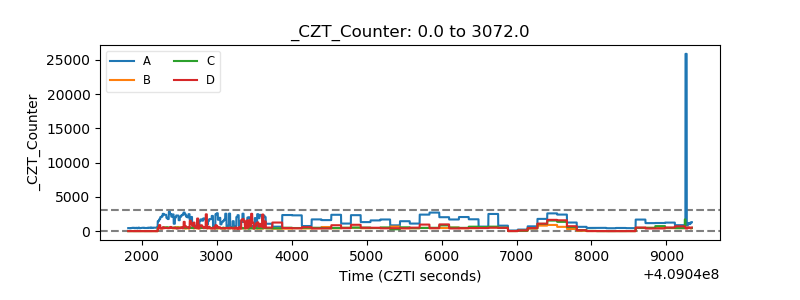 |
| +2.5 Volts monitor | 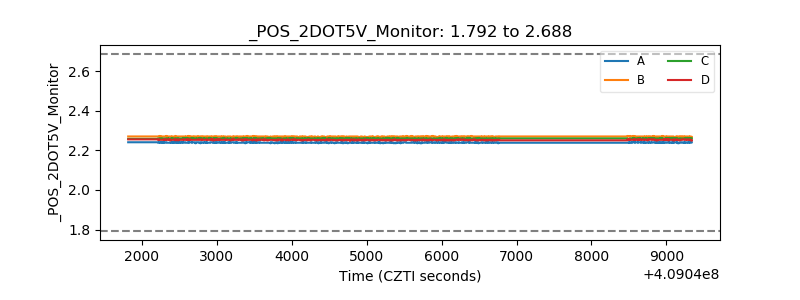 |
| +5 Volts monitor | 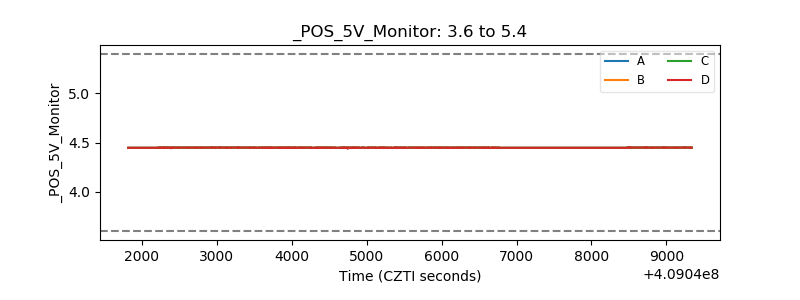 |
| _ROLL_ROT | 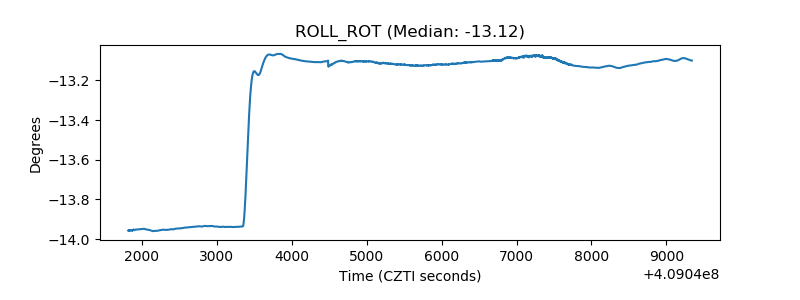 |
| _Roll_DEC | 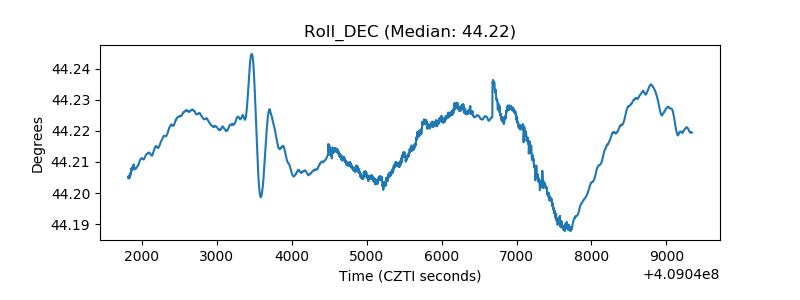 |
| _Roll_RA | 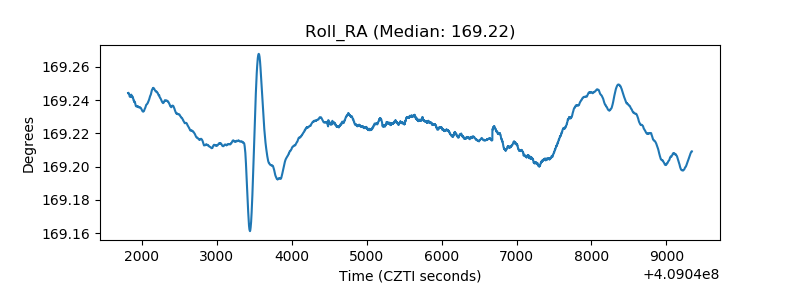 |
| Veto Counter | 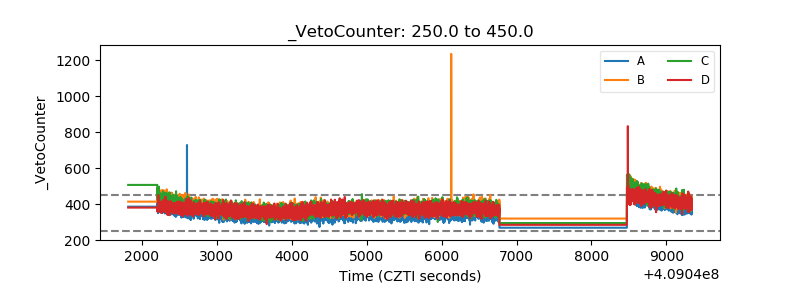 |