| Param | Original file | Final file |
|---|---|---|
| Filename | modeM0/AS1A12_077T06_9000005430_39054cztM0_level2.fits | modeM0/AS1A12_077T06_9000005430_39054cztM0_level2_quad_clean.evt |
| Size (bytes) | 474,134,400 | 99,270,720 |
| Size | 452.2 MB | 94.7 MB |
| Events in quadrant A | 7,131,716 | 654,652 |
| Events in quadrant B | 2,713,402 | 711,864 |
| Events in quadrant C | 2,943,024 | 669,038 |
| Events in quadrant D | 4,340,970 | 589,820 |
| Mode M9 | |||
|---|---|---|---|
| Quadrant | BADHDUFLAG | Total packets | Discarded packets |
| A | 0 | 20 | 0 |
| B | 0 | 20 | 0 |
| C | 0 | 20 | 0 |
| D | 0 | 20 | 0 |
| Mode M0 | |||
|---|---|---|---|
| Quadrant | BADHDUFLAG | Total packets | Discarded packets |
| A | 0 | 25042 | 2 |
| B | 0 | 11261 | 1 |
| C | 0 | 11829 | 1 |
| D | 0 | 16471 | 1 |
| Mode SS | |||
|---|---|---|---|
| Quadrant | BADHDUFLAG | Total packets | Discarded packets |
| A | 0 | 110 | 0 |
| B | 0 | 110 | 0 |
| C | 0 | 110 | 0 |
| D | 0 | 110 | 0 |
| Quadrant | Total seconds | Saturated seconds | Saturation percentage |
|---|---|---|---|
| A | 5441 | 648 | 11.909575% |
| B | 5441 | 9 | 0.165411% |
| C | 5441 | 10 | 0.183790% |
| D | 5442 | 413 | 7.589122% |
Noise dominated data is calculated using 1-second bins in cleaned event files. If a bin has >2000 counts, and if more than 50% of those come from <1% of pixels, then it is considered to be noise-dominated and hence unusable.
| Quadrant | # 1 sec bins | Bins with >0 counts | Bins with >2000 counts | High rate bins dominated by noise | Noise dominated (total time) | Noise dominated (detector-on time) | Marked lightcurve |
|---|---|---|---|---|---|---|---|
| A | 7384 | 5442 | 566 | 566 | 7.67% | 10.40% | 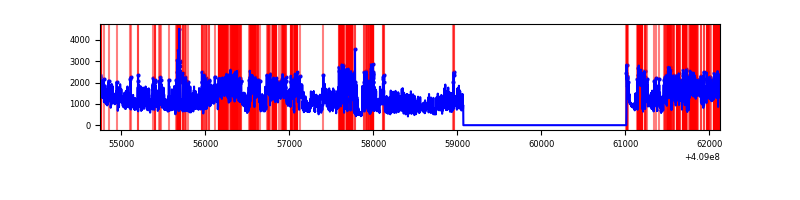 |
| B | 7384 | 5442 | 5 | 5 | 0.07% | 0.09% | 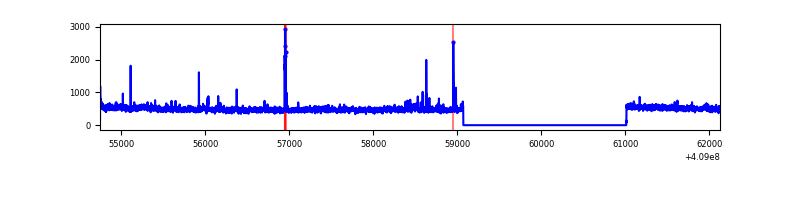 |
| C | 7384 | 5442 | 7 | 7 | 0.09% | 0.13% | 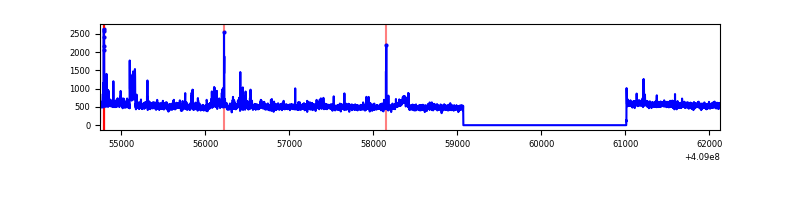 |
| D | 7385 | 5443 | 362 | 362 | 4.90% | 6.65% | 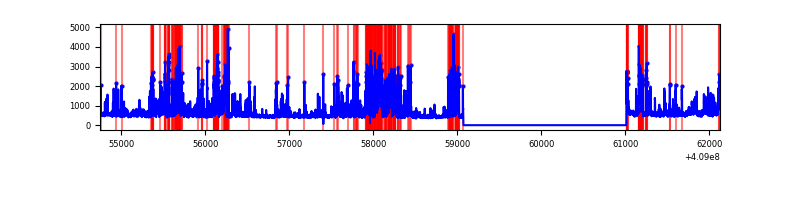 |
Top three noisy pixels from each quadrant. If the there are fewer than three noisy pixels in the level2.evt file, extra rows are filled as -1
| Pixel properties | Quadrant properties | ||||||
|---|---|---|---|---|---|---|---|
| Quadrant | DetID | PixID | Counts | Sigma | Mean | Median | Sigma |
| A | 15 | 222 | 4172055 | 32201.06 | 647 | 634 | 129.5 |
| A | 10 | 83 | 427202 | 3292.87 | 647 | 634 | 129.5 |
| A | 9 | 143 | 19589 | 146.32 | 647 | 634 | 129.5 |
| B | 0 | 230 | 56381 | 446.21 | 655 | 638 | 124.9 |
| B | 0 | 190 | 22684 | 176.47 | 655 | 638 | 124.9 |
| B | 15 | 85 | 20012 | 155.08 | 655 | 638 | 124.9 |
| C | 15 | 214 | 228114 | 1538.45 | 643 | 647 | 147.9 |
| C | 15 | 208 | 90809 | 609.8 | 643 | 647 | 147.9 |
| C | 15 | 159 | 37136 | 246.79 | 643 | 647 | 147.9 |
| D | 2 | 249 | 881594 | 5699.96 | 631 | 613 | 154.6 |
| D | 1 | 47 | 412543 | 2665.2 | 631 | 613 | 154.6 |
| D | 12 | 233 | 275568 | 1778.96 | 631 | 613 | 154.6 |
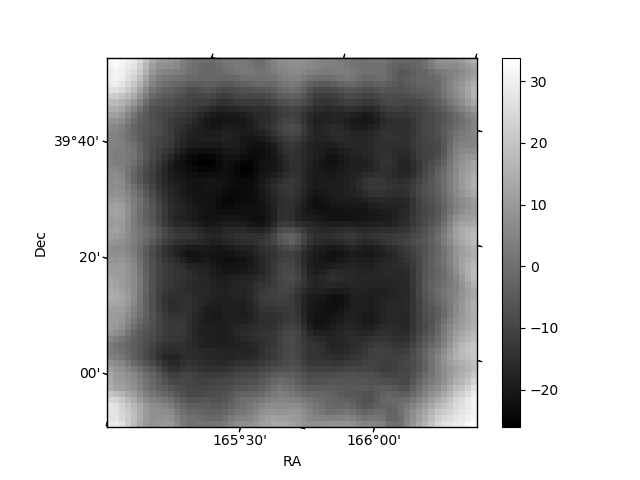
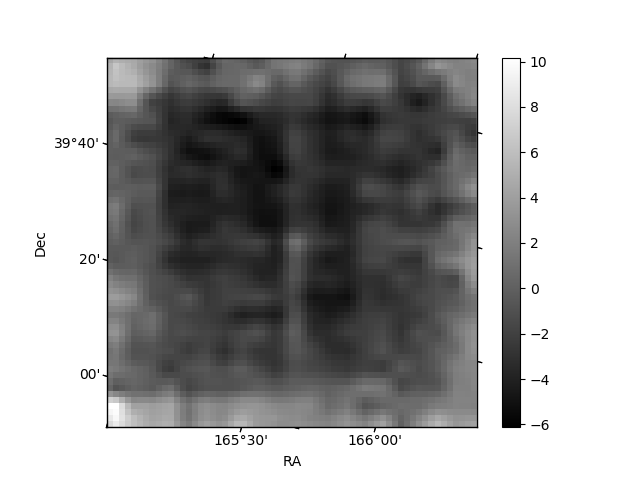
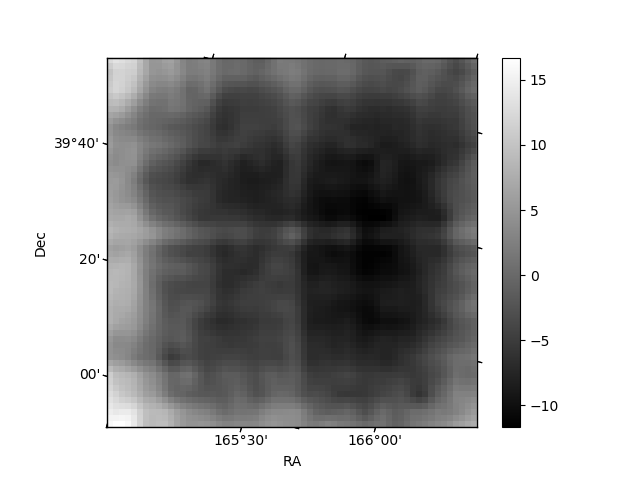
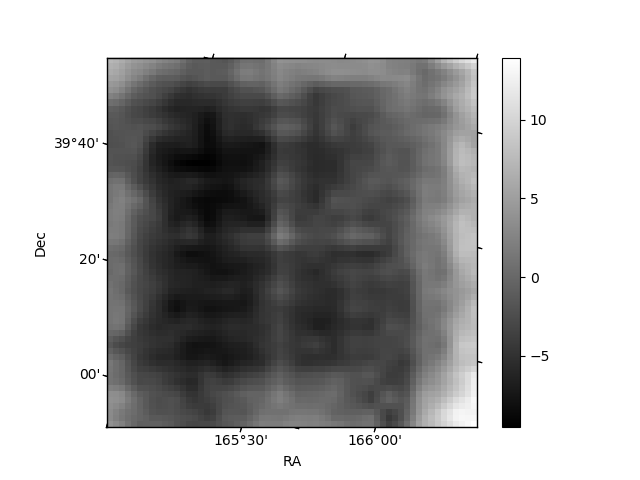
Histogram calculated using DETX and DETY for each event in the final _common_clean file
| Quadrant A | 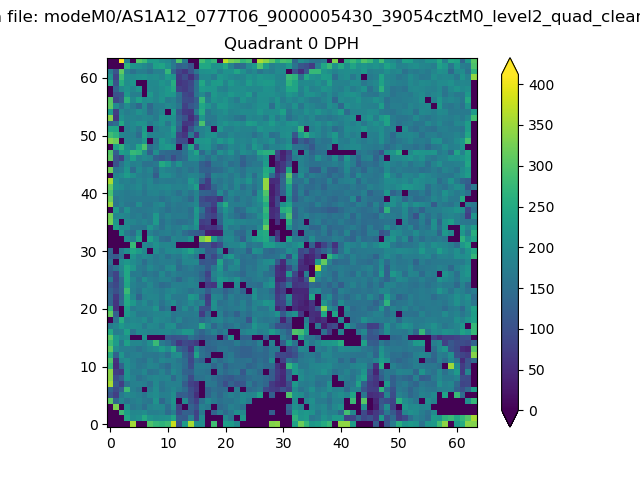 |
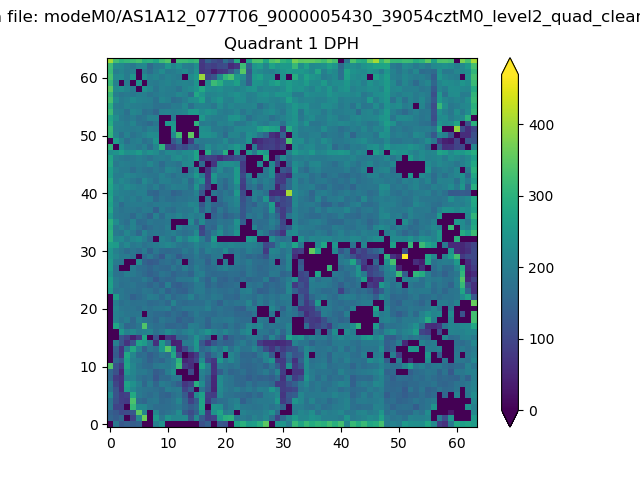 |
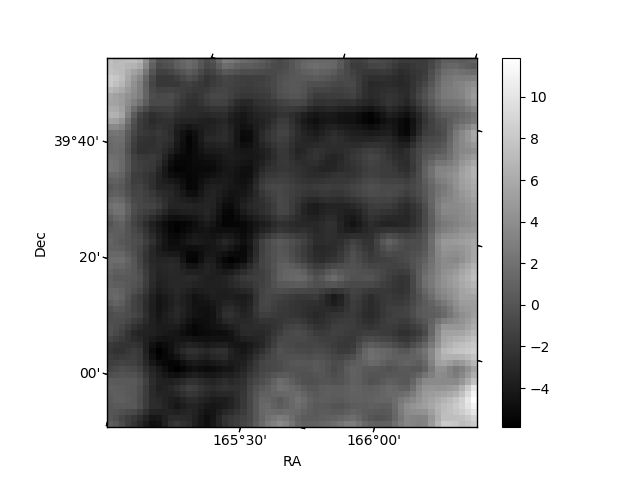
Quadrant B |
|---|---|---|---|
| Quadrant D | 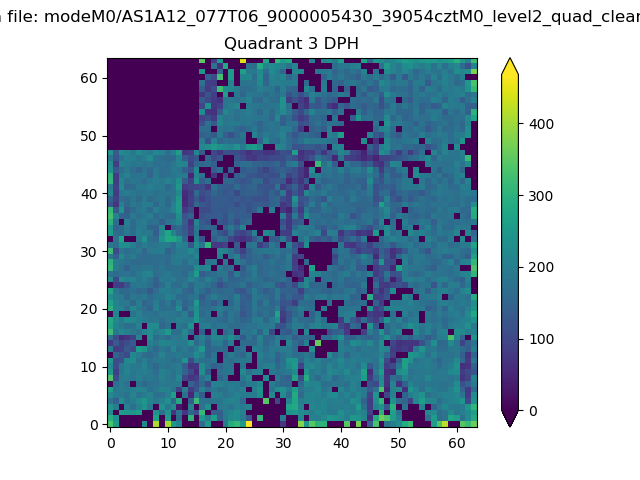 |
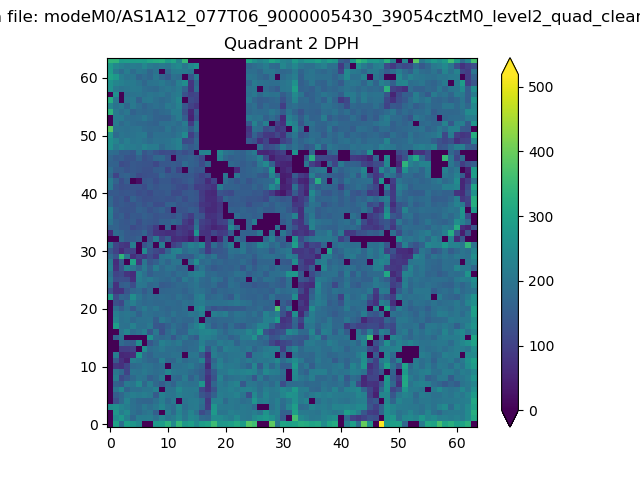 |
Quadrant C |
| Plot type | Count rate plots | Images |
|---|---|---|
| Comparison with Poisson distribution Blue bars denote a histogram of data divided into 1 sec bins. Red curve is a Poisson curve with rate = median count rate of data. |
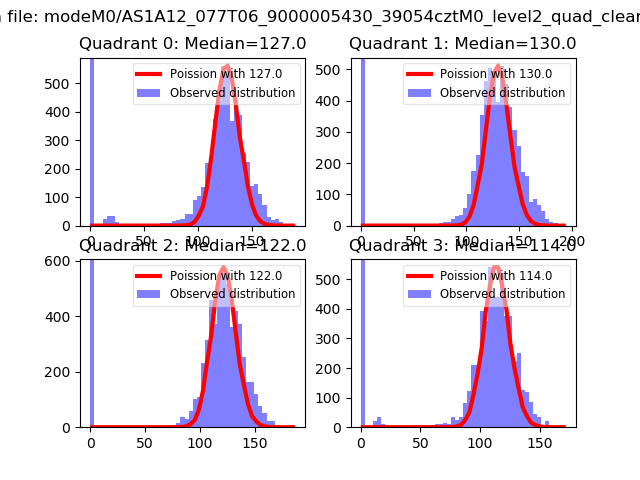 |
 |
| Quadrant-wise count rates Data is divided into 100 sec bins |
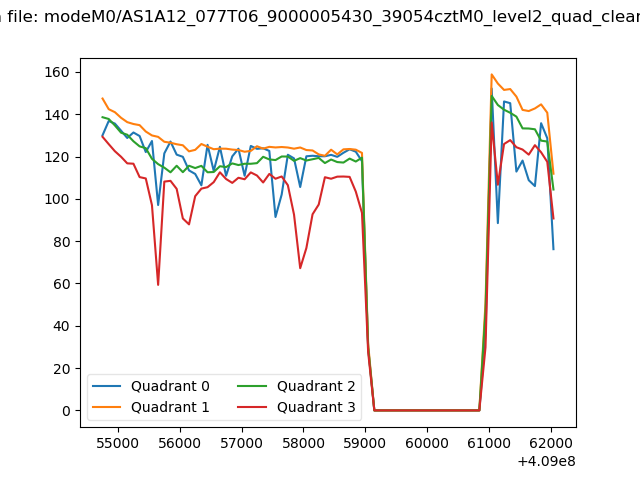 |
|
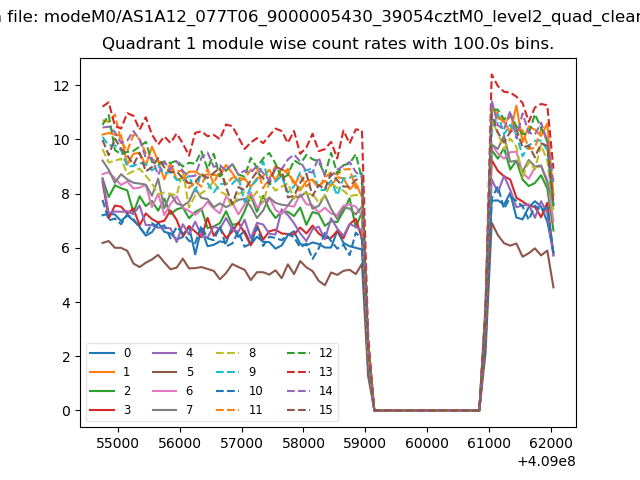
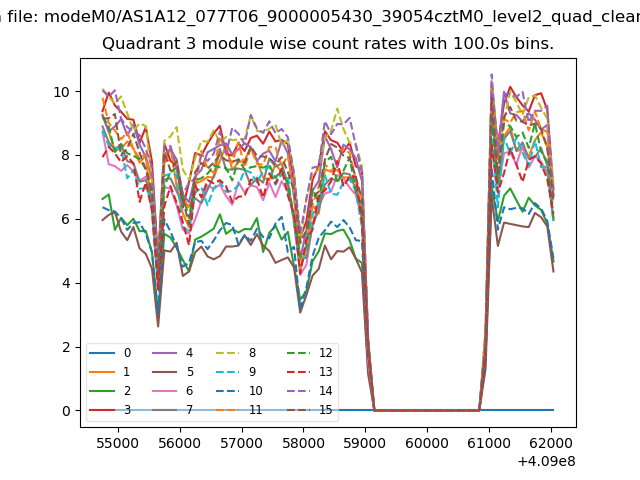
| Module-wise count rates for Quadrant A Data is divided into 100 sec bins |
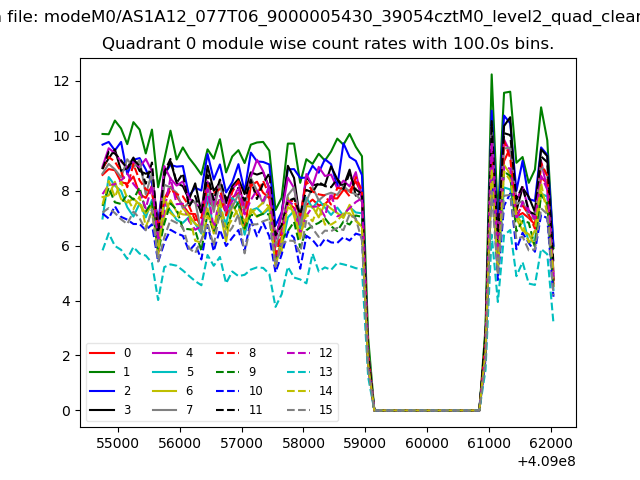 |
 |
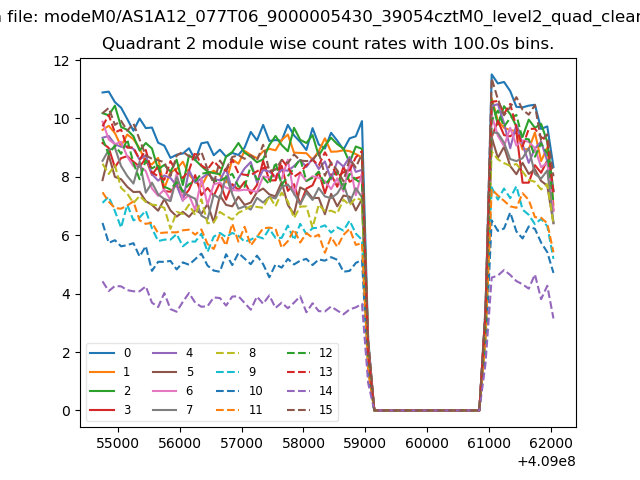
| Module-wise count rates for Quadrant B Data is divided into 100 sec bins |
 |
 |
| Module-wise count rates for Quadrant C Data is divided into 100 sec bins |
 |
 |
| Module-wise count rates for Quadrant D Data is divided into 100 sec bins |
 |
 |
| Parameter | Plot |
|---|---|
| CZT HV Monitor |  |
| D_VDD | 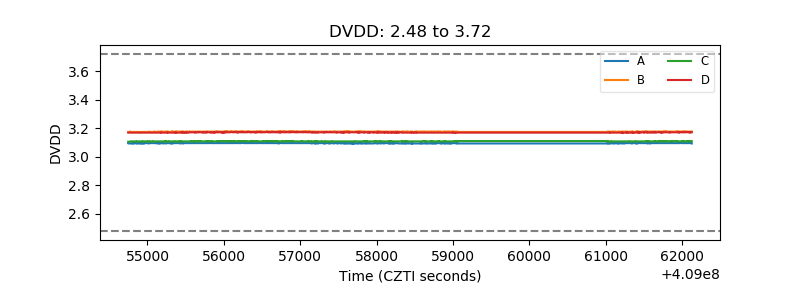 |
| Temperature 1 | 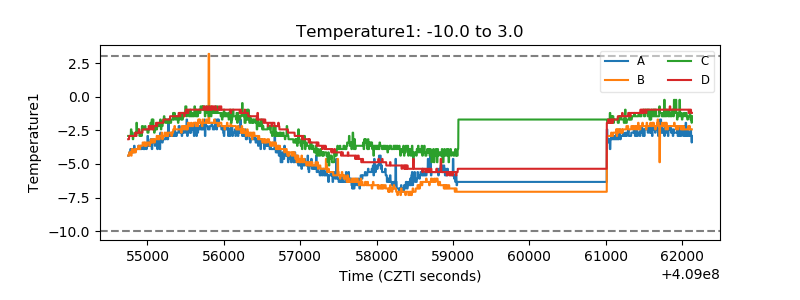 |
| Veto HV Monitor | 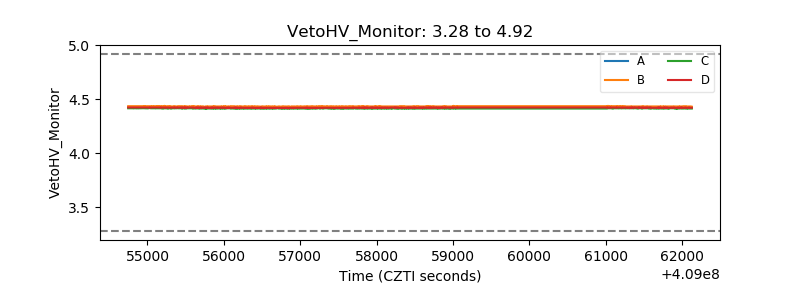 |
| Veto LLD | 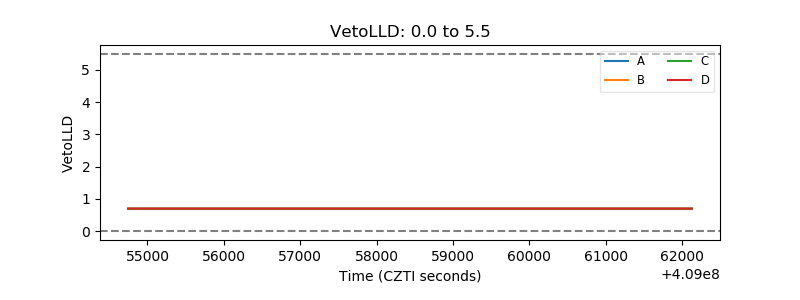 |
| Alpha Counter | 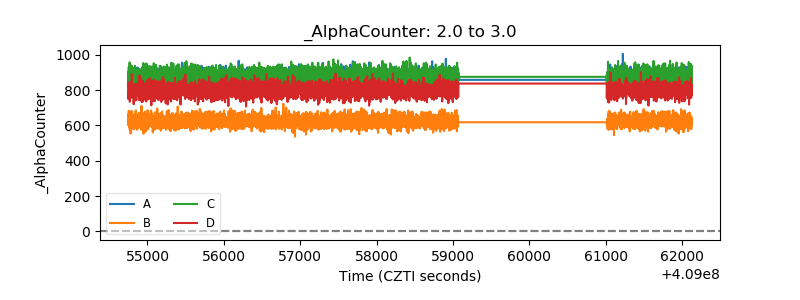 |
| _CPM_Rate | 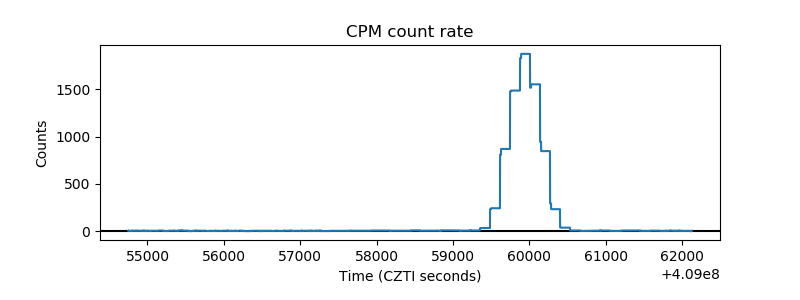 |
| CZT Counter | 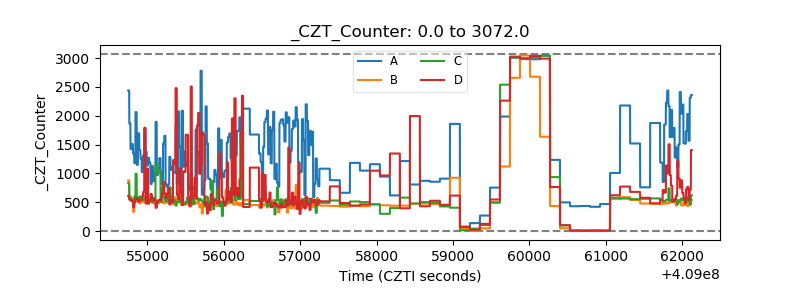 |
| +2.5 Volts monitor | 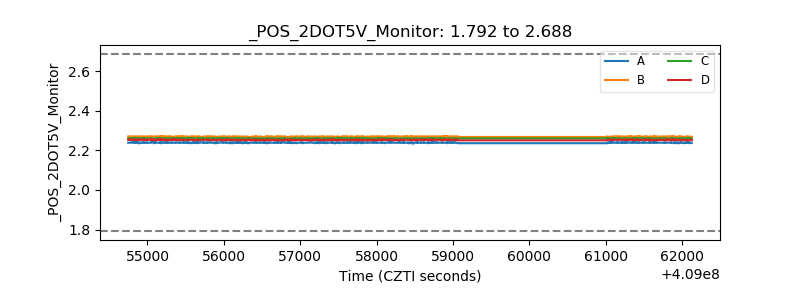 |
| +5 Volts monitor | 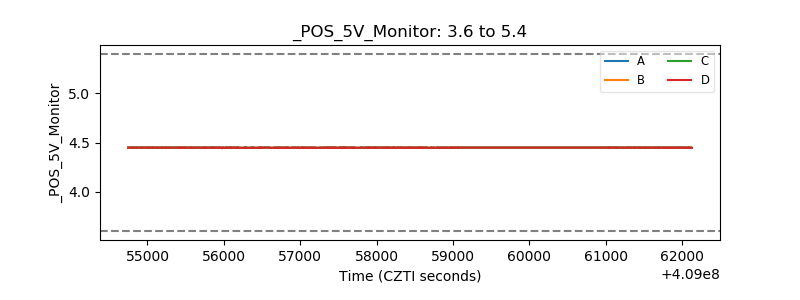 |
| _ROLL_ROT | 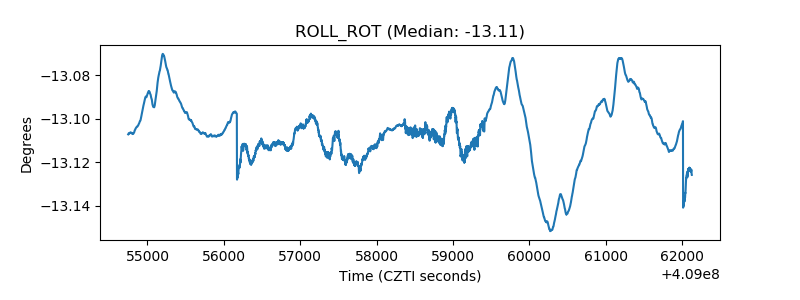 |
| _Roll_DEC | 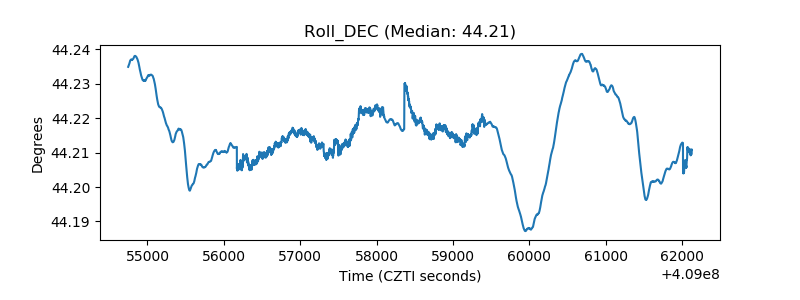 |
| _Roll_RA | 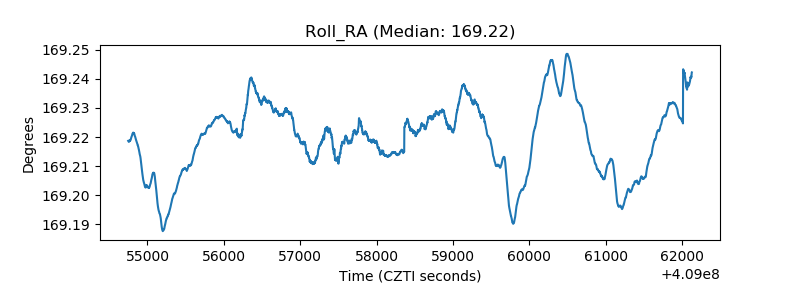 |
| Veto Counter | 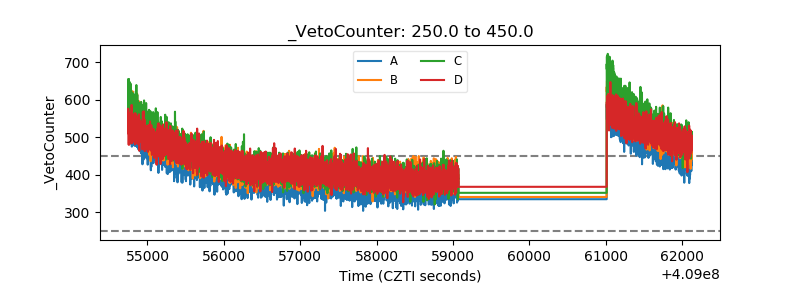 |