| Param | Original file | Final file |
|---|---|---|
| Filename | modeM0/AS1A12_077T06_9000005430_39055cztM0_level2.fits | modeM0/AS1A12_077T06_9000005430_39055cztM0_level2_quad_clean.evt |
| Size (bytes) | 515,119,680 | 96,946,560 |
| Size | 491.3 MB | 92.5 MB |
| Events in quadrant A | 8,851,090 | 550,640 |
| Events in quadrant B | 2,660,241 | 728,925 |
| Events in quadrant C | 2,792,352 | 686,362 |
| Events in quadrant D | 4,354,179 | 599,376 |
| Mode M9 | |||
|---|---|---|---|
| Quadrant | BADHDUFLAG | Total packets | Discarded packets |
| A | 0 | 25 | 0 |
| B | 0 | 25 | 0 |
| C | 0 | 25 | 0 |
| D | 0 | 26 | 0 |
| Mode M0 | |||
|---|---|---|---|
| Quadrant | BADHDUFLAG | Total packets | Discarded packets |
| A | 0 | 29983 | 2 |
| B | 0 | 11025 | 1 |
| C | 0 | 11262 | 1 |
| D | 0 | 16449 | 1 |
| Mode SS | |||
|---|---|---|---|
| Quadrant | BADHDUFLAG | Total packets | Discarded packets |
| A | 0 | 108 | 0 |
| B | 0 | 108 | 0 |
| C | 0 | 108 | 0 |
| D | 0 | 108 | 0 |
| Quadrant | Total seconds | Saturated seconds | Saturation percentage |
|---|---|---|---|
| A | 5289 | 1651 | 31.215731% |
| B | 5289 | 9 | 0.170164% |
| C | 5289 | 9 | 0.170164% |
| D | 5289 | 423 | 7.997731% |
Noise dominated data is calculated using 1-second bins in cleaned event files. If a bin has >2000 counts, and if more than 50% of those come from <1% of pixels, then it is considered to be noise-dominated and hence unusable.
| Quadrant | # 1 sec bins | Bins with >0 counts | Bins with >2000 counts | High rate bins dominated by noise | Noise dominated (total time) | Noise dominated (detector-on time) | Marked lightcurve |
|---|---|---|---|---|---|---|---|
| A | 7323 | 5290 | 1629 | 1629 | 22.24% | 30.79% | 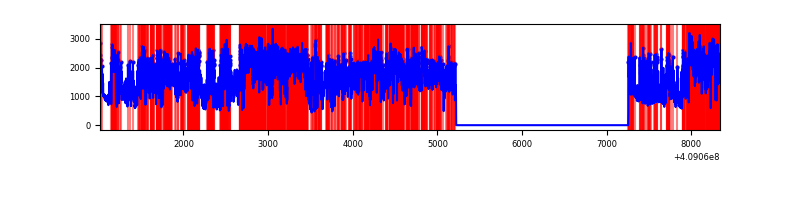 |
| B | 7323 | 5290 | 0 | 0 | 0.00% | 0.00% | 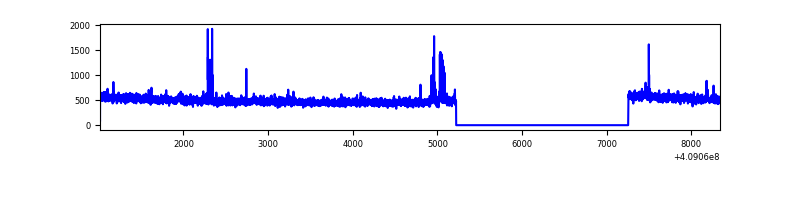 |
| C | 7323 | 5290 | 4 | 4 | 0.05% | 0.08% | 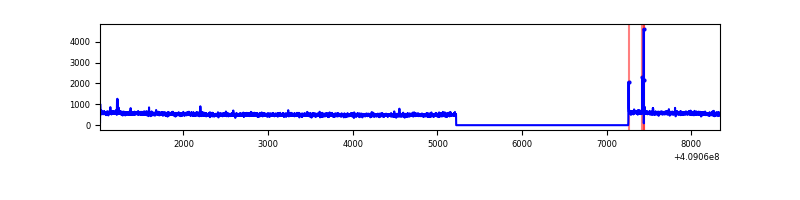 |
| D | 7323 | 5290 | 362 | 362 | 4.94% | 6.84% | 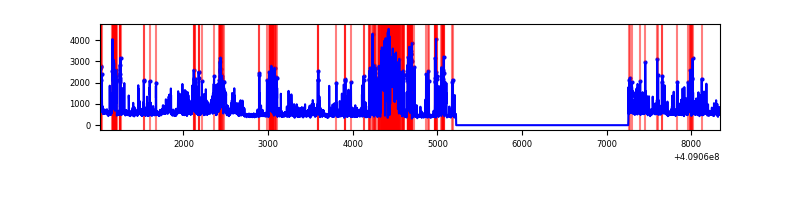 |
Top three noisy pixels from each quadrant. If the there are fewer than three noisy pixels in the level2.evt file, extra rows are filled as -1
| Pixel properties | Quadrant properties | ||||||
|---|---|---|---|---|---|---|---|
| Quadrant | DetID | PixID | Counts | Sigma | Mean | Median | Sigma |
| A | 15 | 222 | 6008112 | 49189.18 | 614 | 603 | 122.1 |
| A | 10 | 83 | 407296 | 3329.98 | 614 | 603 | 122.1 |
| A | 15 | 223 | 41934 | 338.42 | 614 | 603 | 122.1 |
| B | 5 | 184 | 48702 | 390.11 | 655 | 639 | 123.2 |
| B | 15 | 85 | 16236 | 126.6 | 655 | 639 | 123.2 |
| B | 12 | 111 | 14626 | 113.53 | 655 | 639 | 123.2 |
| C | 15 | 214 | 220417 | 1482.2 | 647 | 653 | 148.3 |
| C | 1 | 23 | 17950 | 116.66 | 647 | 653 | 148.3 |
| C | 15 | 208 | 12210 | 77.95 | 647 | 653 | 148.3 |
| D | 2 | 249 | 996017 | 6468.68 | 626 | 608 | 153.9 |
| D | 1 | 47 | 443786 | 2880.0 | 626 | 608 | 153.9 |
| D | 12 | 235 | 229203 | 1485.53 | 626 | 608 | 153.9 |
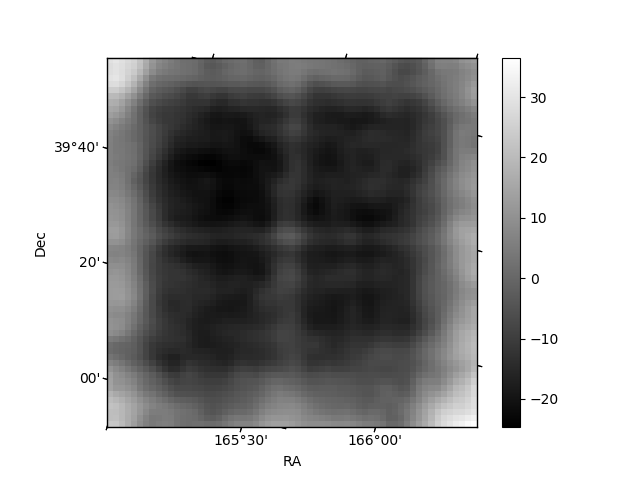
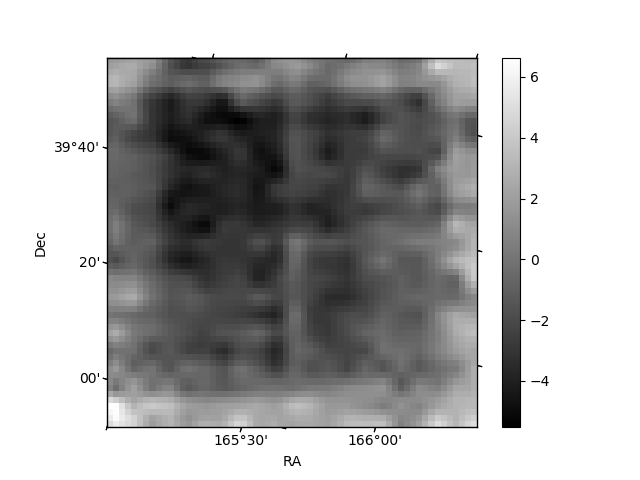
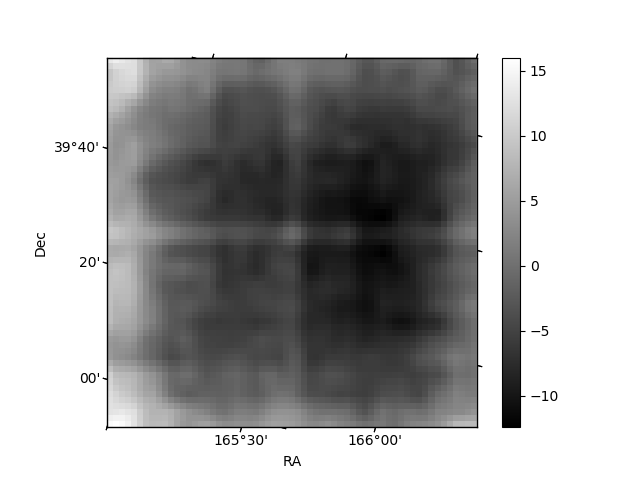
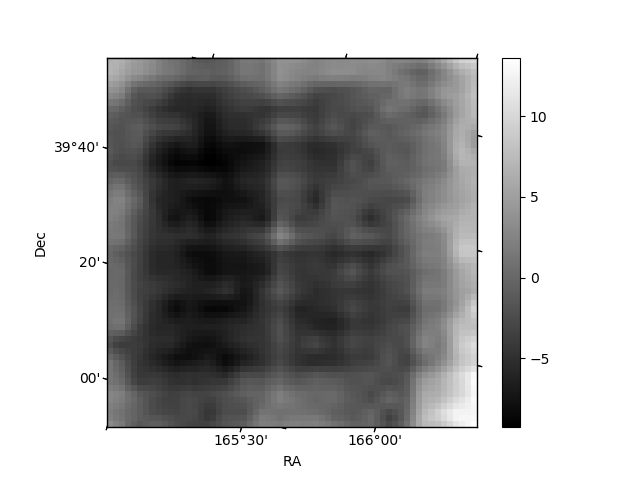
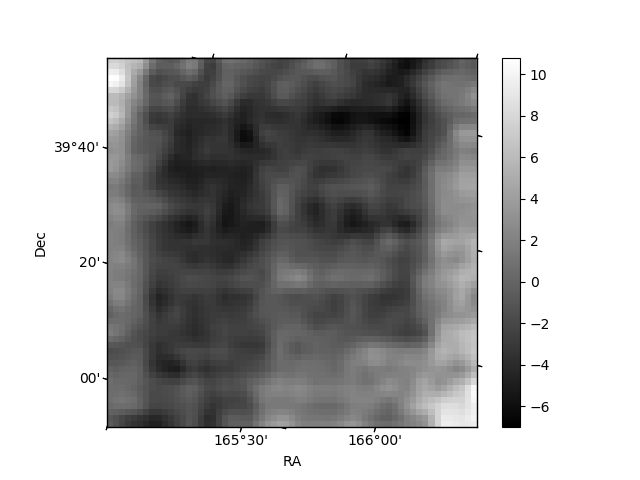
Histogram calculated using DETX and DETY for each event in the final _common_clean file
| Quadrant A | 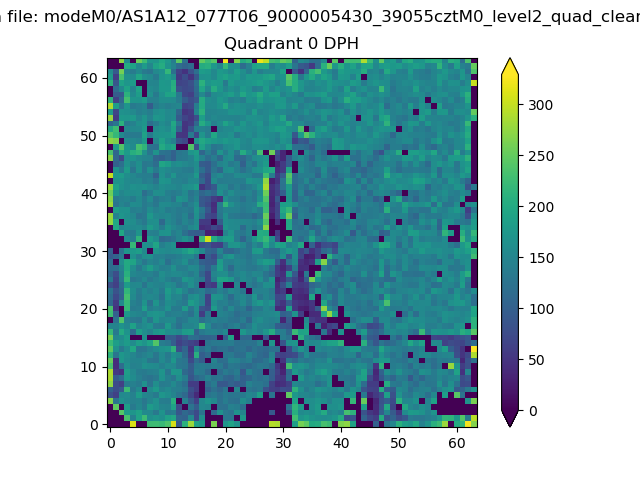 |
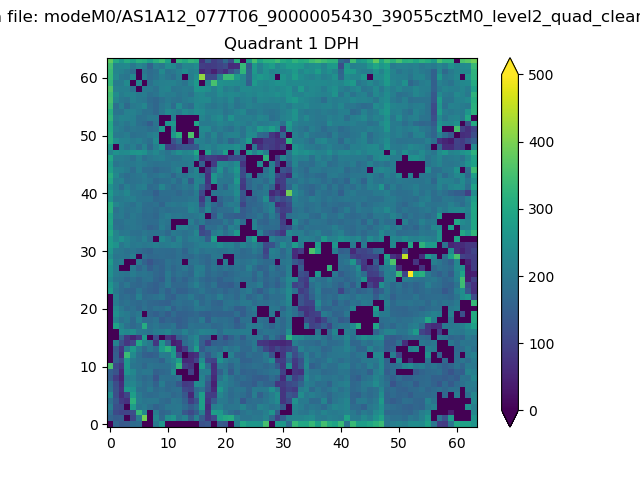 |
Quadrant B |
|---|---|---|---|
| Quadrant D | 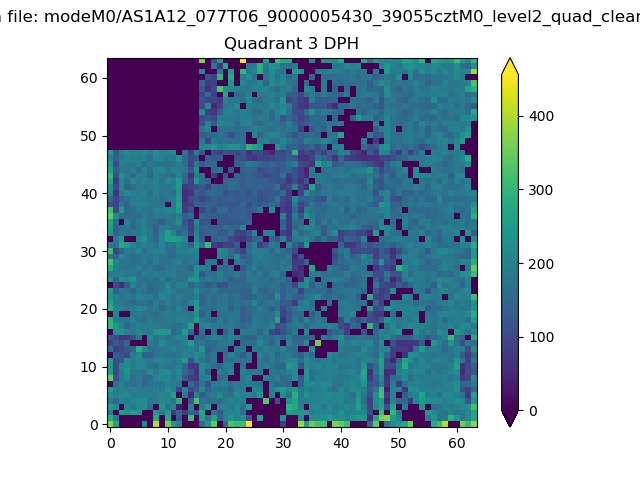 |
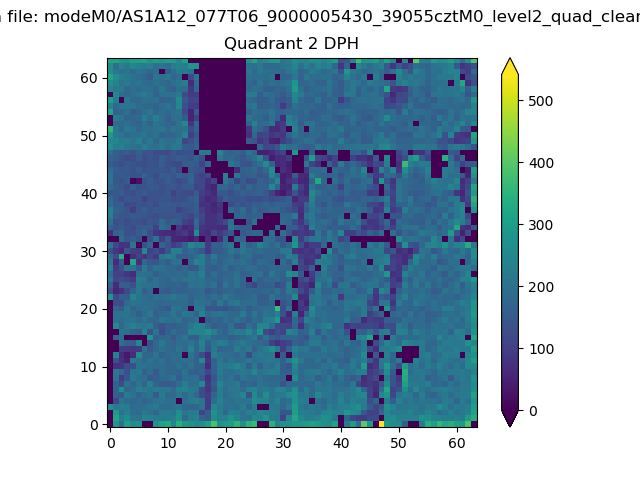 |
Quadrant C |
| Plot type | Count rate plots | Images |
|---|---|---|
| Comparison with Poisson distribution Blue bars denote a histogram of data divided into 1 sec bins. Red curve is a Poisson curve with rate = median count rate of data. |
 |
 |
| Quadrant-wise count rates Data is divided into 100 sec bins |
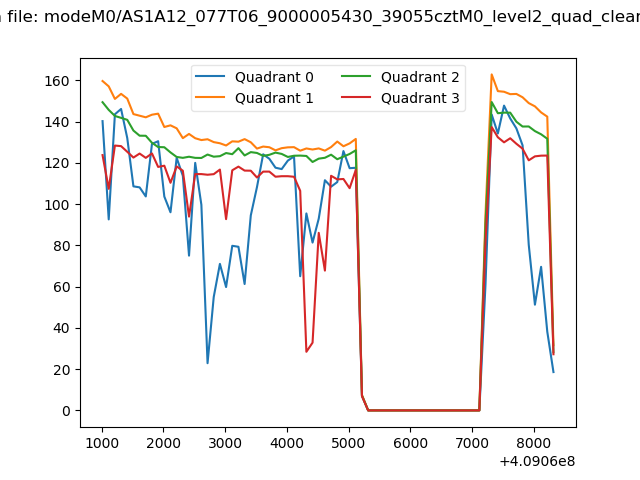 |
|
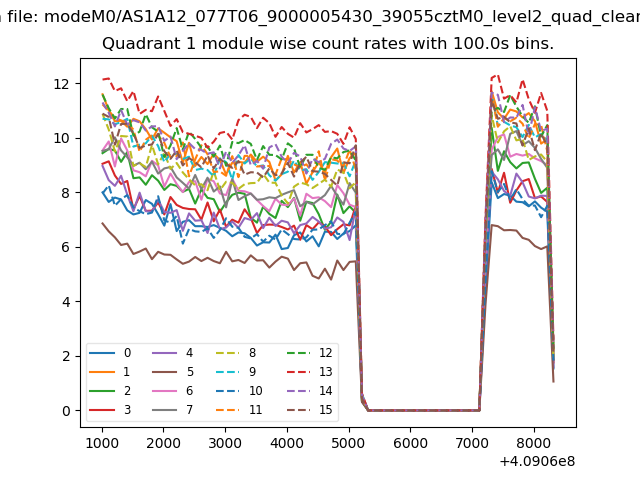
| Module-wise count rates for Quadrant A Data is divided into 100 sec bins |
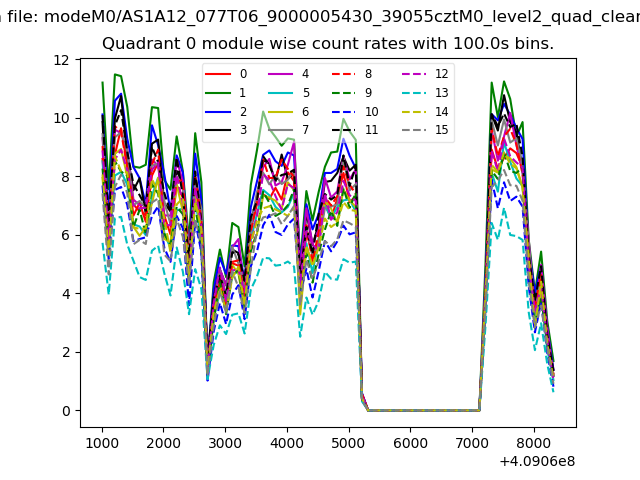 |
 |
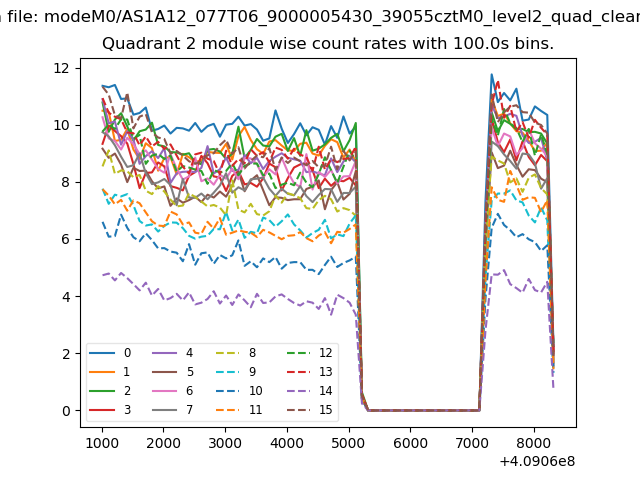
| Module-wise count rates for Quadrant B Data is divided into 100 sec bins |
 |
 |
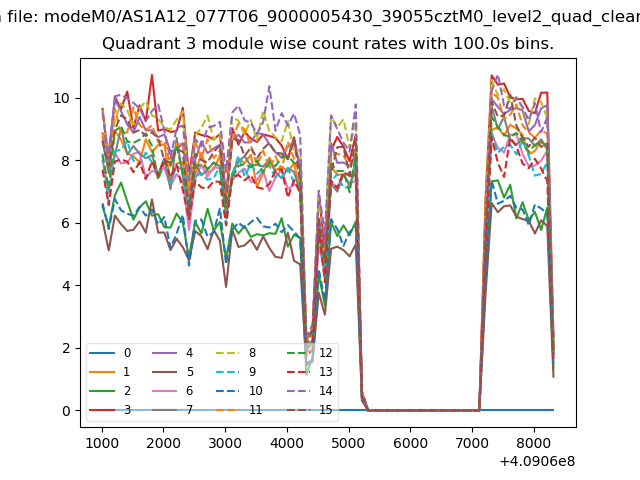
| Module-wise count rates for Quadrant C Data is divided into 100 sec bins |
 |
 |
| Module-wise count rates for Quadrant D Data is divided into 100 sec bins |
 |
 |
| Parameter | Plot |
|---|---|
| CZT HV Monitor | 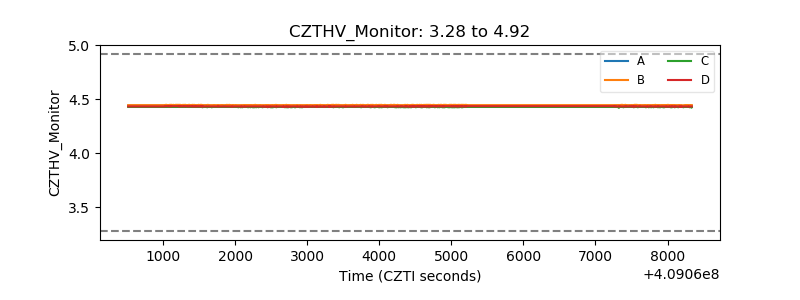 |
| D_VDD | 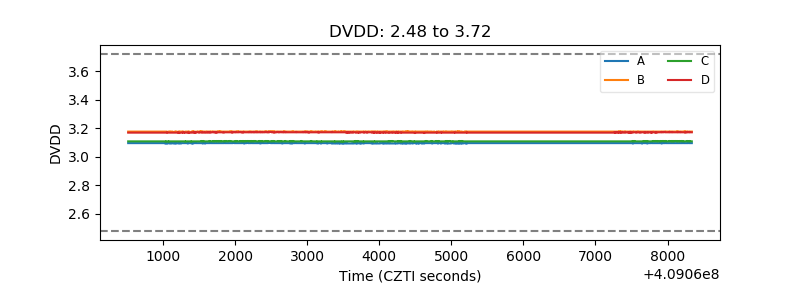 |
| Temperature 1 | 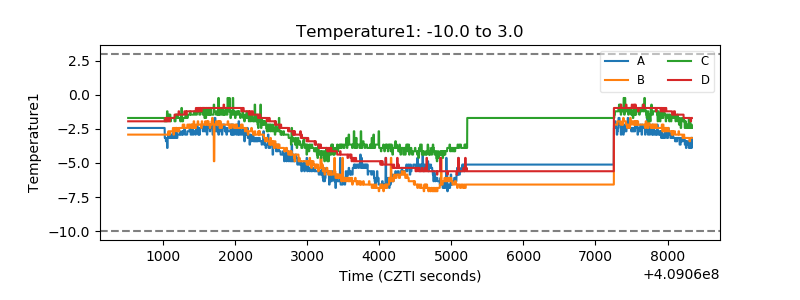 |
| Veto HV Monitor | 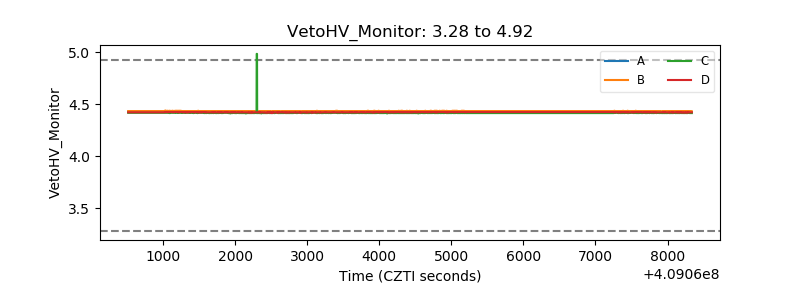 |
| Veto LLD | 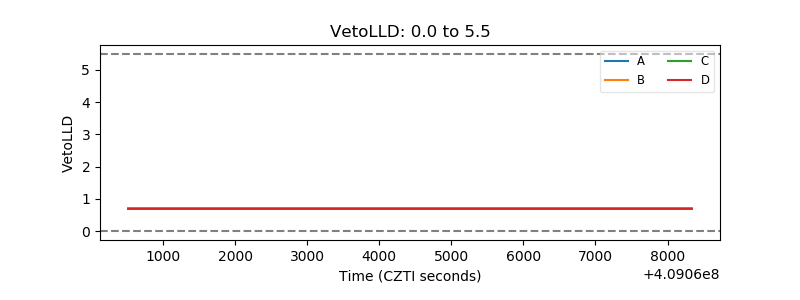 |
| Alpha Counter | 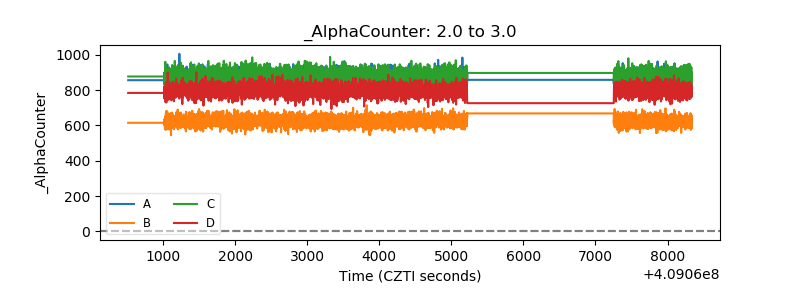 |
| _CPM_Rate | 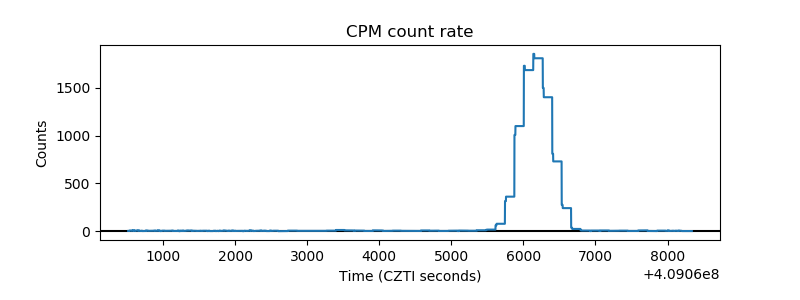 |
| CZT Counter | 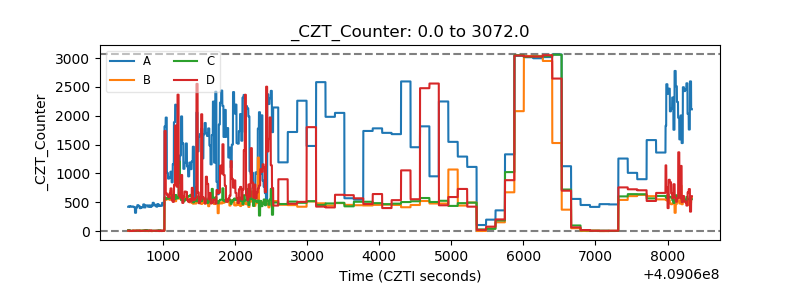 |
| +2.5 Volts monitor | 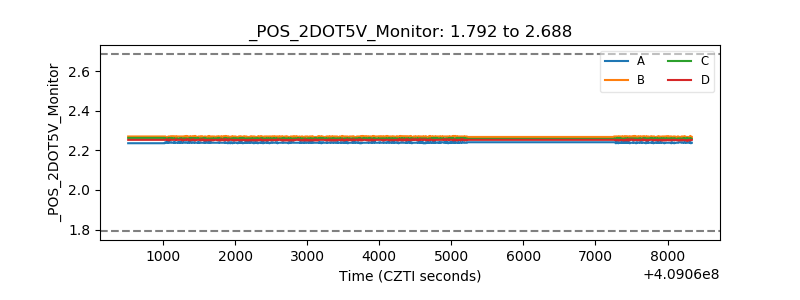 |
| +5 Volts monitor | 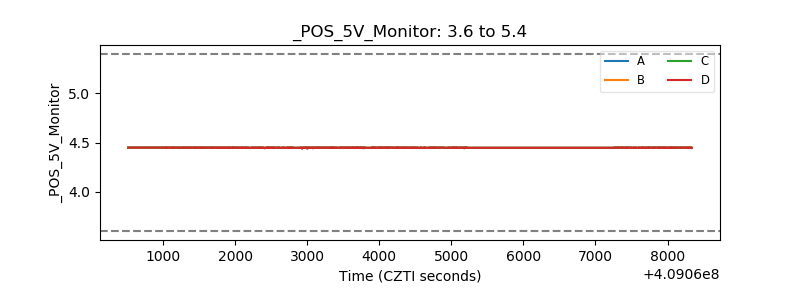 |
| _ROLL_ROT | 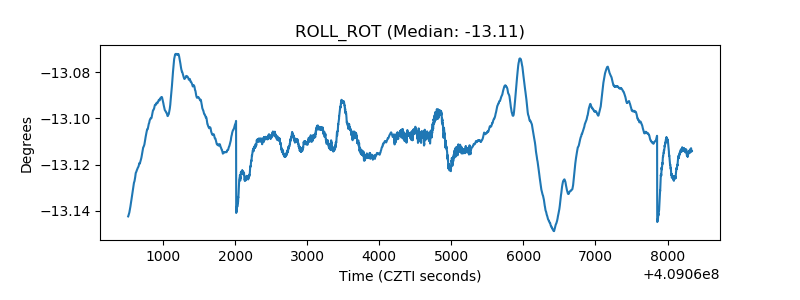 |
| _Roll_DEC | 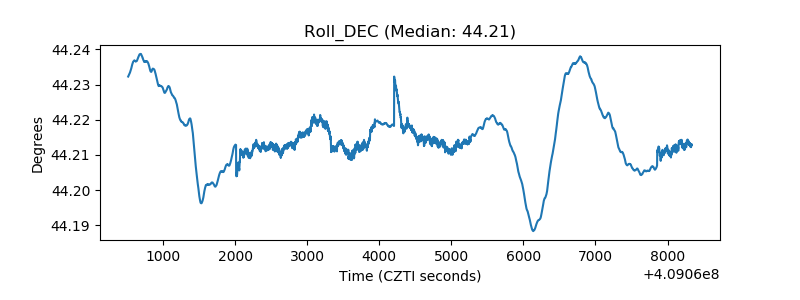 |
| _Roll_RA | 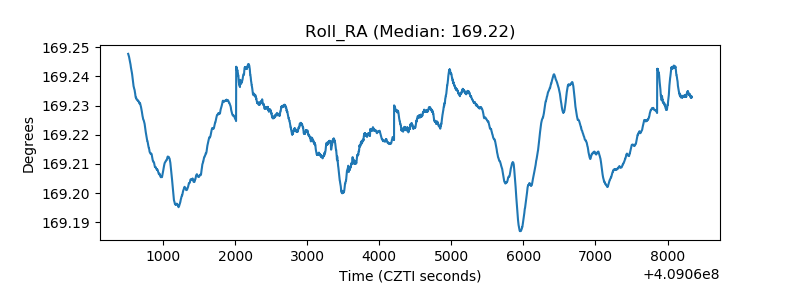 |
| Veto Counter | 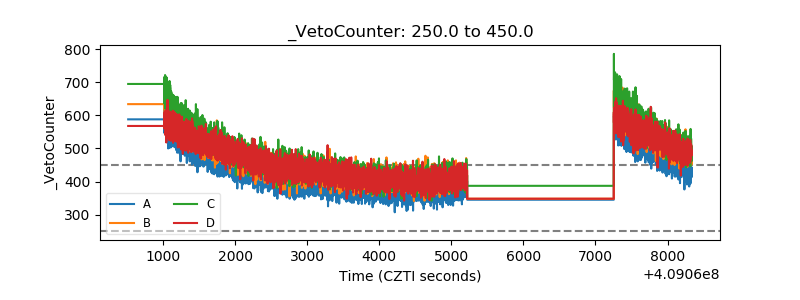 |