| Param | Original file | Final file |
|---|---|---|
| Filename | modeM0/AS1A12_077T06_9000005430_39056cztM0_level2.fits | modeM0/AS1A12_077T06_9000005430_39056cztM0_level2_quad_clean.evt |
| Size (bytes) | 430,447,680 | 94,757,760 |
| Size | 410.5 MB | 90.4 MB |
| Events in quadrant A | 6,567,952 | 536,060 |
| Events in quadrant B | 2,528,411 | 706,220 |
| Events in quadrant C | 2,743,593 | 668,583 |
| Events in quadrant D | 3,694,878 | 599,768 |
| Mode M9 | |||
|---|---|---|---|
| Quadrant | BADHDUFLAG | Total packets | Discarded packets |
| A | 0 | 24 | 0 |
| B | 0 | 24 | 0 |
| C | 0 | 24 | 0 |
| D | 0 | 25 | 0 |
| Mode M0 | |||
|---|---|---|---|
| Quadrant | BADHDUFLAG | Total packets | Discarded packets |
| A | 0 | 23209 | 3 |
| B | 0 | 10578 | 2 |
| C | 0 | 11139 | 2 |
| D | 0 | 14406 | 2 |
| Mode SS | |||
|---|---|---|---|
| Quadrant | BADHDUFLAG | Total packets | Discarded packets |
| A | 0 | 102 | 0 |
| B | 0 | 102 | 0 |
| C | 0 | 102 | 0 |
| D | 0 | 102 | 0 |
| Quadrant | Total seconds | Saturated seconds | Saturation percentage |
|---|---|---|---|
| A | 5129 | 1358 | 26.476896% |
| B | 5129 | 7 | 0.136479% |
| C | 5129 | 10 | 0.194970% |
| D | 5129 | 260 | 5.069214% |
Noise dominated data is calculated using 1-second bins in cleaned event files. If a bin has >2000 counts, and if more than 50% of those come from <1% of pixels, then it is considered to be noise-dominated and hence unusable.
| Quadrant | # 1 sec bins | Bins with >0 counts | Bins with >2000 counts | High rate bins dominated by noise | Noise dominated (total time) | Noise dominated (detector-on time) | Marked lightcurve |
|---|---|---|---|---|---|---|---|
| A | 7252 | 5130 | 1204 | 1204 | 16.60% | 23.47% | 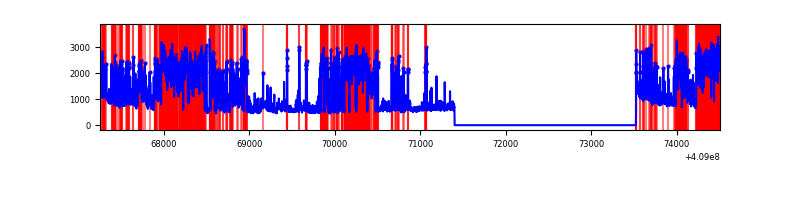 |
| B | 7252 | 5130 | 1 | 1 | 0.01% | 0.02% |  |
| C | 7252 | 5130 | 5 | 5 | 0.07% | 0.10% | 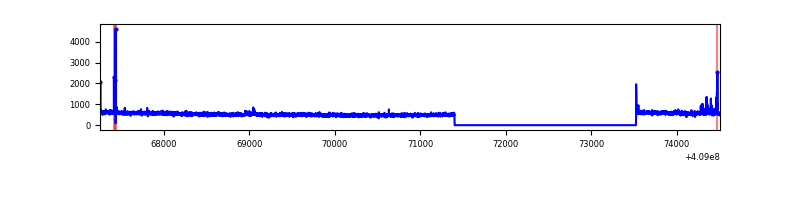 |
| D | 7252 | 5130 | 222 | 222 | 3.06% | 4.33% | 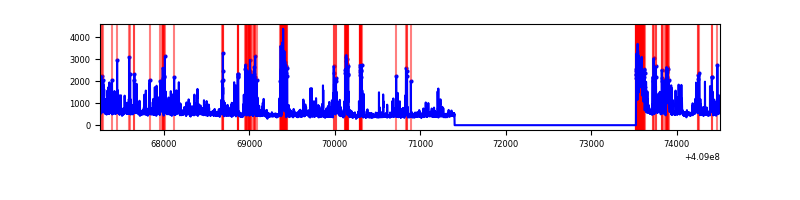 |
Top three noisy pixels from each quadrant. If the there are fewer than three noisy pixels in the level2.evt file, extra rows are filled as -1
| Pixel properties | Quadrant properties | ||||||
|---|---|---|---|---|---|---|---|
| Quadrant | DetID | PixID | Counts | Sigma | Mean | Median | Sigma |
| A | 15 | 222 | 3864984 | 33402.63 | 578 | 569 | 115.7 |
| A | 10 | 83 | 397424 | 3430.27 | 578 | 569 | 115.7 |
| A | 15 | 223 | 40863 | 348.29 | 578 | 569 | 115.7 |
| B | 5 | 172 | 14420 | 116.34 | 632 | 617 | 118.6 |
| B | 12 | 111 | 13987 | 112.69 | 632 | 617 | 118.6 |
| B | 11 | 111 | 12871 | 103.28 | 632 | 617 | 118.6 |
| C | 15 | 214 | 216217 | 1527.01 | 623 | 630 | 141.2 |
| C | 15 | 208 | 37973 | 264.5 | 623 | 630 | 141.2 |
| C | 1 | 23 | 14883 | 100.95 | 623 | 630 | 141.2 |
| D | 2 | 249 | 810703 | 5470.8 | 610 | 592 | 148.1 |
| D | 12 | 233 | 206093 | 1387.78 | 610 | 592 | 148.1 |
| D | 12 | 227 | 146937 | 988.29 | 610 | 592 | 148.1 |
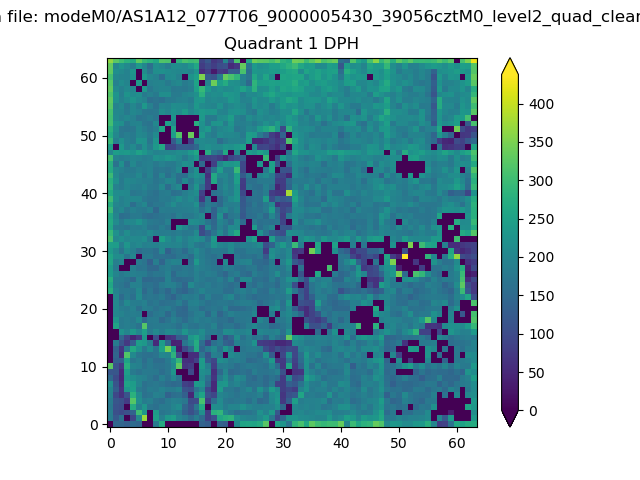
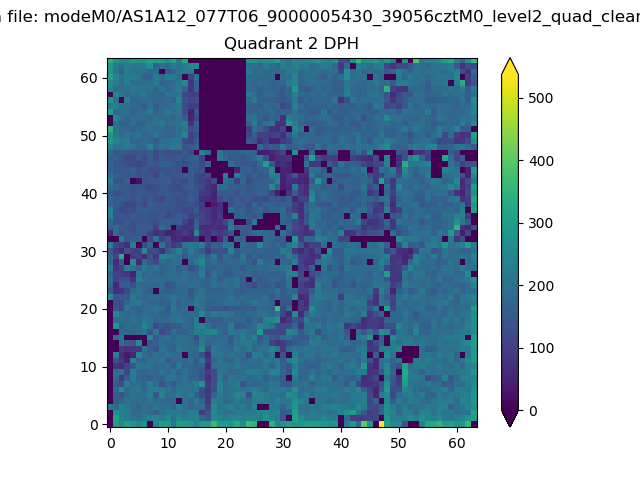
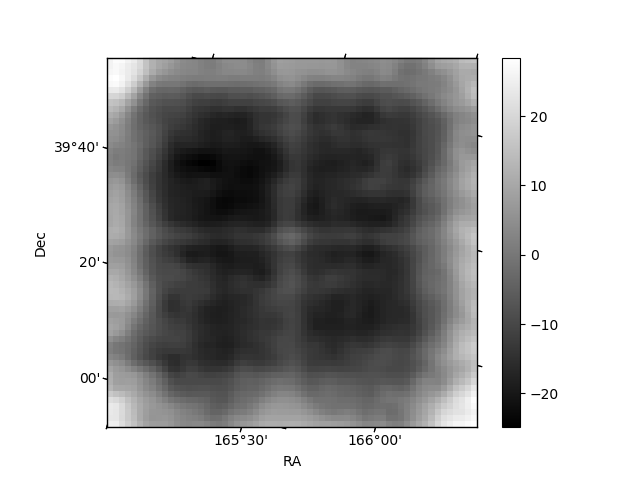
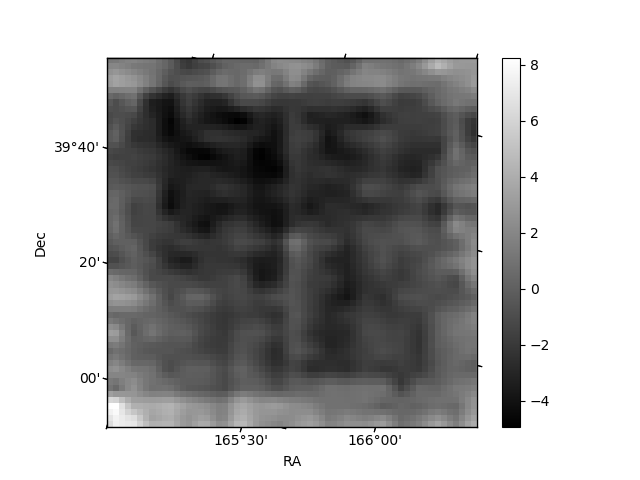
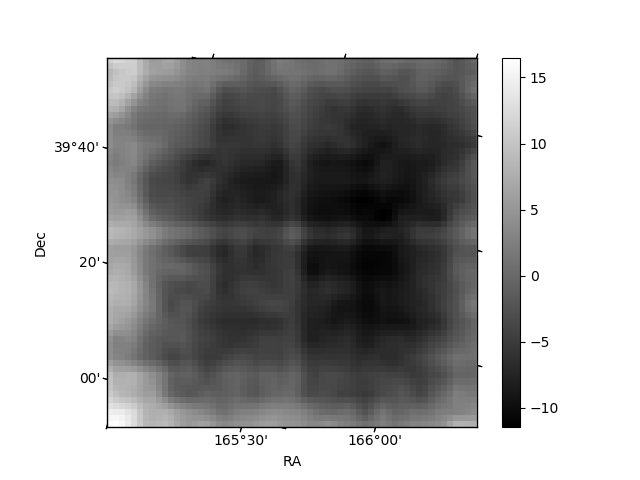
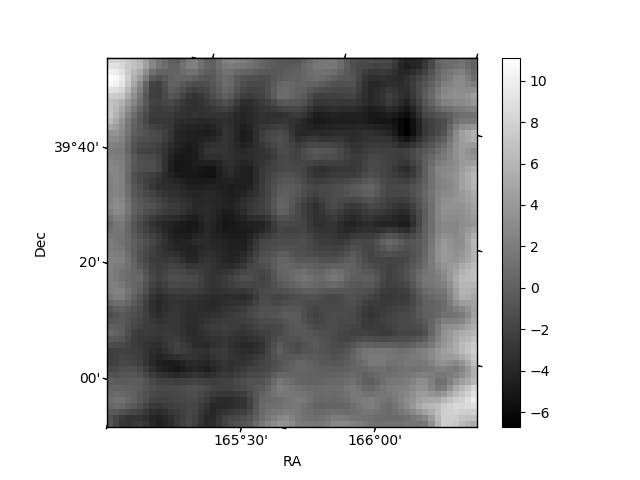
Histogram calculated using DETX and DETY for each event in the final _common_clean file
| Quadrant A | 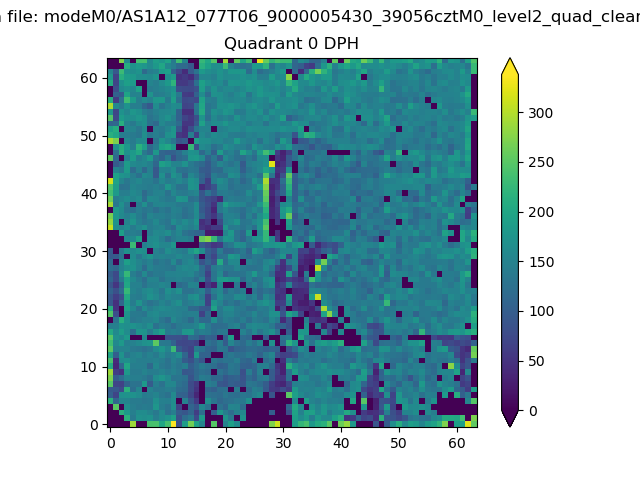 |
 |
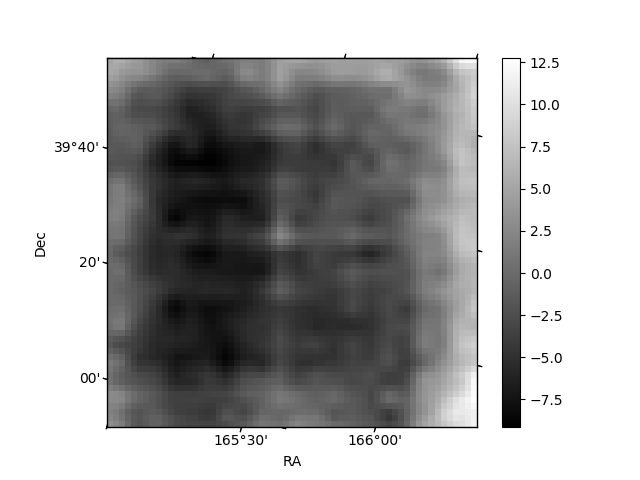
Quadrant B |
|---|---|---|---|
| Quadrant D | 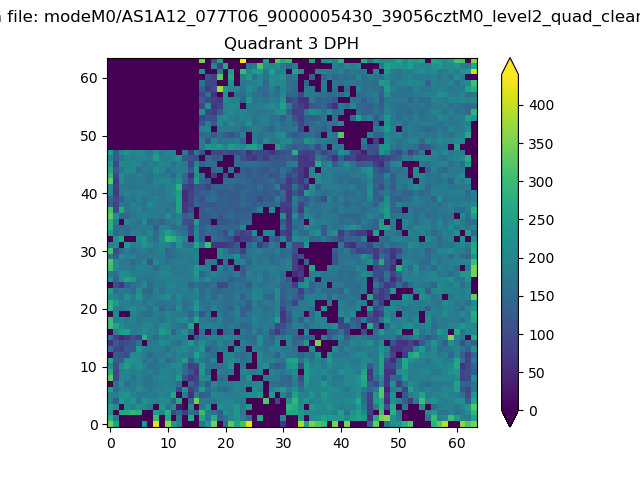 |
 |
Quadrant C |
| Plot type | Count rate plots | Images |
|---|---|---|
| Comparison with Poisson distribution Blue bars denote a histogram of data divided into 1 sec bins. Red curve is a Poisson curve with rate = median count rate of data. |
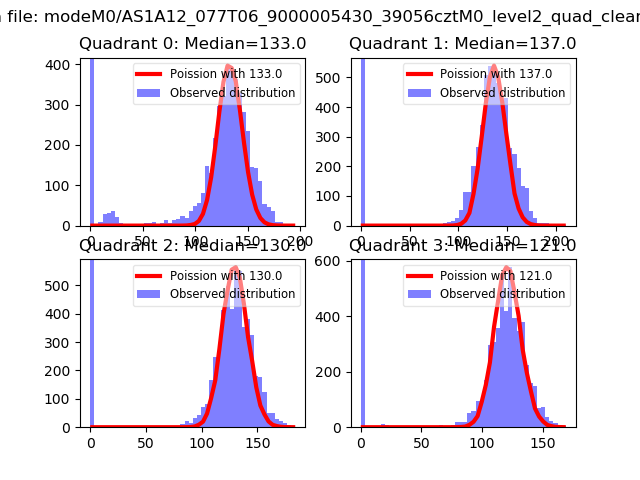 |
 |
| Quadrant-wise count rates Data is divided into 100 sec bins |
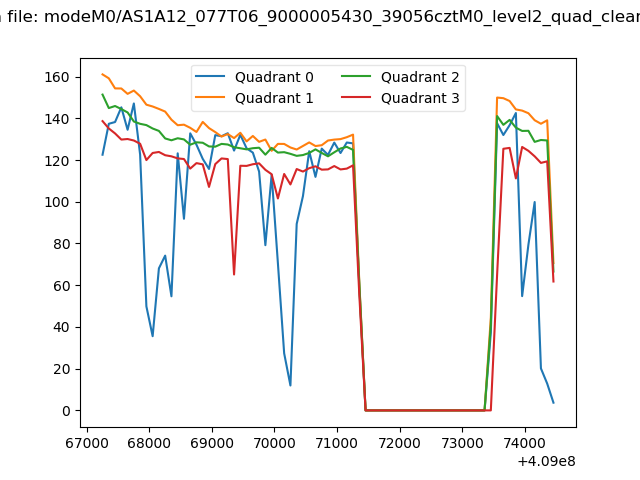 |
|
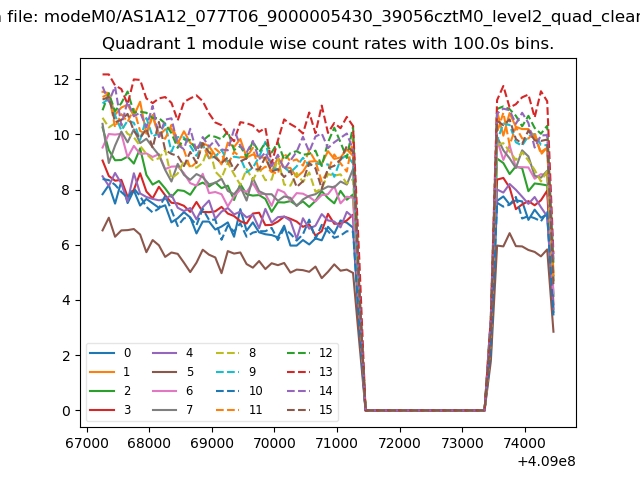
| Module-wise count rates for Quadrant A Data is divided into 100 sec bins |
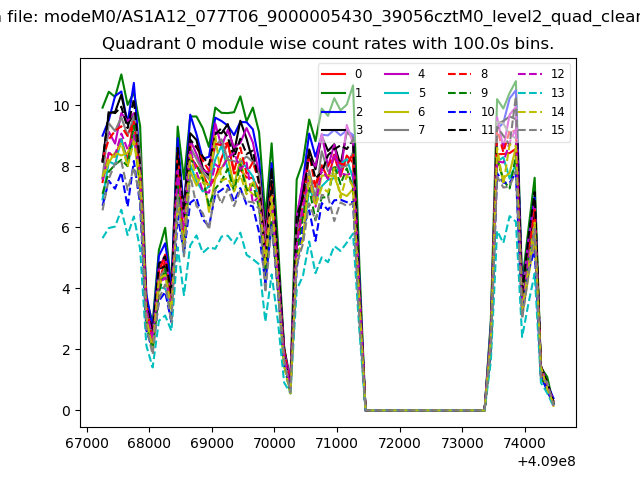 |
 |
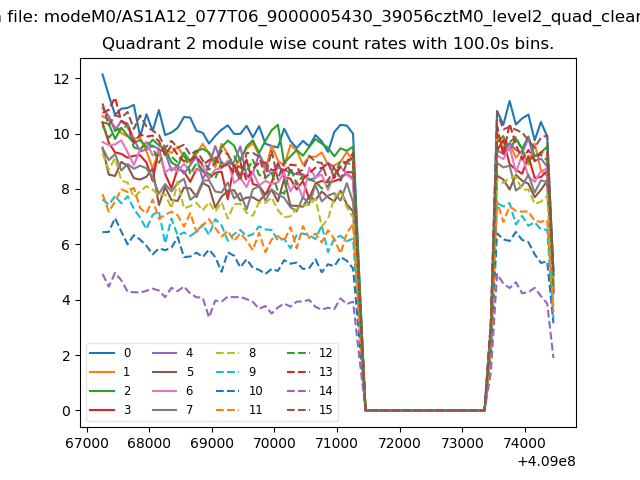
| Module-wise count rates for Quadrant B Data is divided into 100 sec bins |
 |
 |
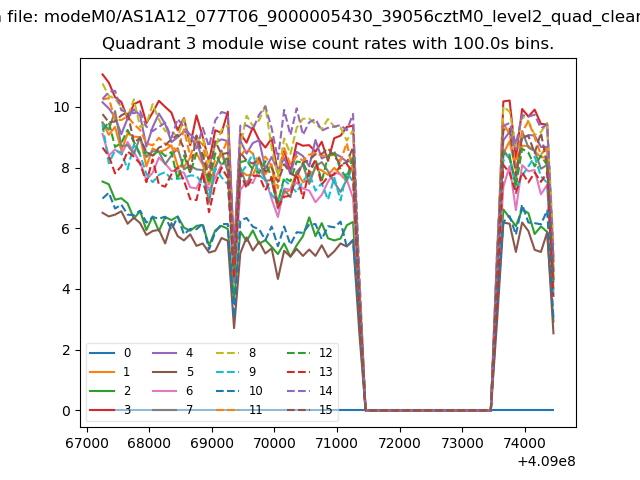
| Module-wise count rates for Quadrant C Data is divided into 100 sec bins |
 |
 |
| Module-wise count rates for Quadrant D Data is divided into 100 sec bins |
 |
 |
| Parameter | Plot |
|---|---|
| CZT HV Monitor | 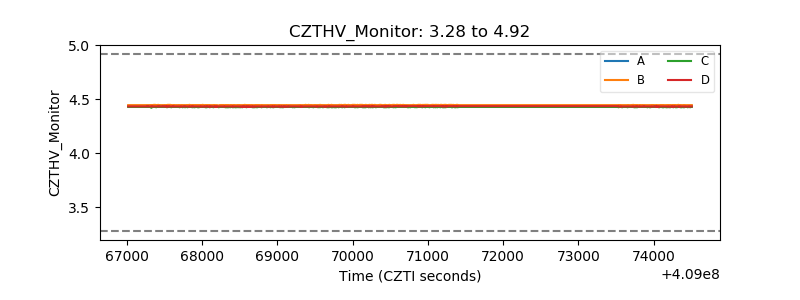 |
| D_VDD |  |
| Temperature 1 | 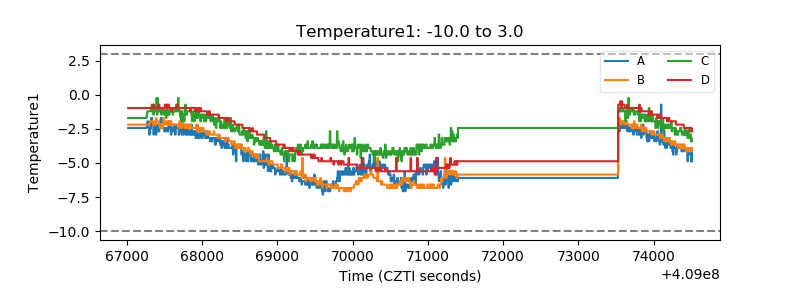 |
| Veto HV Monitor | 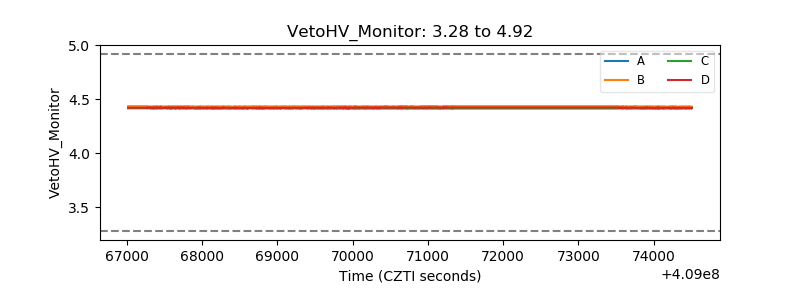 |
| Veto LLD | 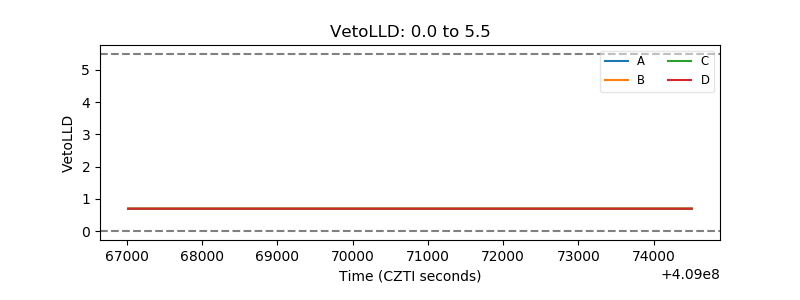 |
| Alpha Counter | 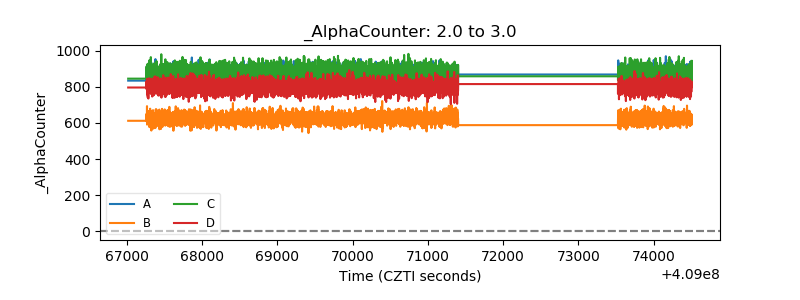 |
| _CPM_Rate | 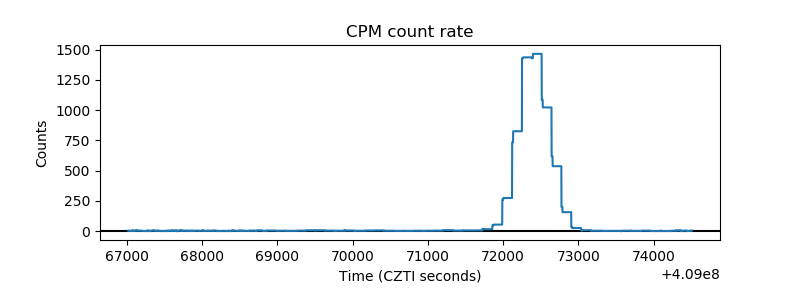 |
| CZT Counter |  |
| +2.5 Volts monitor |  |
| +5 Volts monitor | 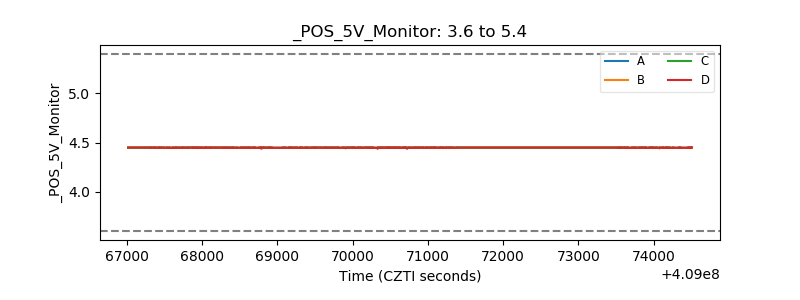 |
| _ROLL_ROT | 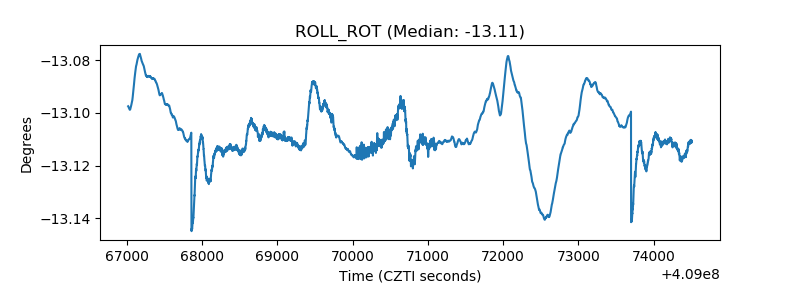 |
| _Roll_DEC | 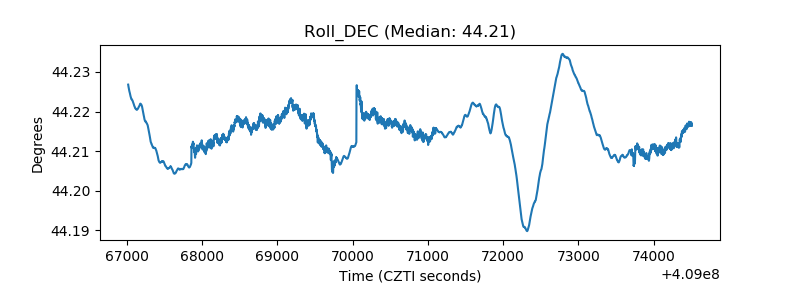 |
| _Roll_RA | 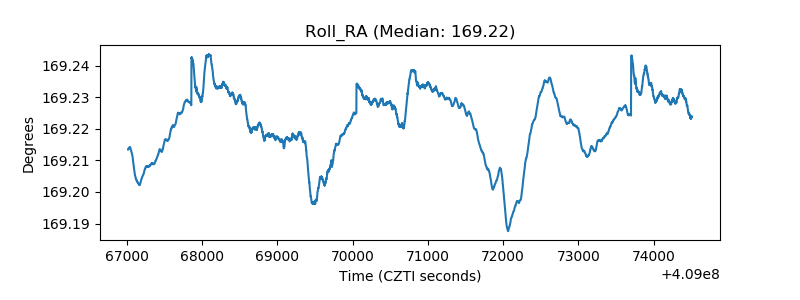 |
| Veto Counter | 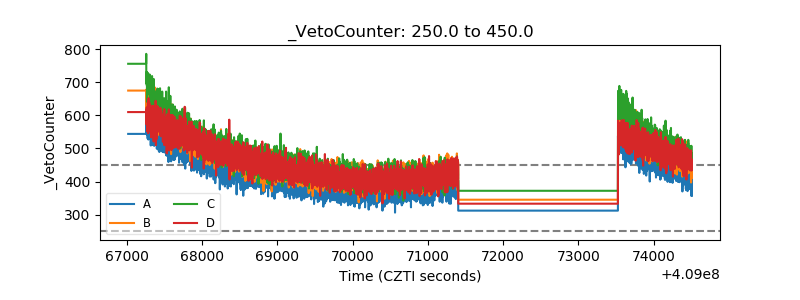 |