| Param | Original file | Final file |
|---|---|---|
| Filename | modeM0/AS1A12_077T06_9000005430_39057cztM0_level2.fits | modeM0/AS1A12_077T06_9000005430_39057cztM0_level2_quad_clean.evt |
| Size (bytes) | 449,968,320 | 85,596,480 |
| Size | 429.1 MB | 81.6 MB |
| Events in quadrant A | 7,235,246 | 485,902 |
| Events in quadrant B | 2,305,925 | 638,767 |
| Events in quadrant C | 2,831,960 | 602,672 |
| Events in quadrant D | 3,905,092 | 523,635 |
| Mode M9 | |||
|---|---|---|---|
| Quadrant | BADHDUFLAG | Total packets | Discarded packets |
| A | 0 | 28 | 0 |
| B | 0 | 28 | 0 |
| C | 0 | 28 | 0 |
| D | 0 | 29 | 0 |
| Mode M0 | |||
|---|---|---|---|
| Quadrant | BADHDUFLAG | Total packets | Discarded packets |
| A | 0 | 24872 | 3 |
| B | 0 | 9913 | 2 |
| C | 0 | 11445 | 2 |
| D | 0 | 14922 | 2 |
| Mode SS | |||
|---|---|---|---|
| Quadrant | BADHDUFLAG | Total packets | Discarded packets |
| A | 0 | 98 | 0 |
| B | 0 | 98 | 0 |
| C | 0 | 98 | 0 |
| D | 0 | 98 | 0 |
| Quadrant | Total seconds | Saturated seconds | Saturation percentage |
|---|---|---|---|
| A | 4865 | 1297 | 26.659815% |
| B | 4865 | 10 | 0.205550% |
| C | 4865 | 71 | 1.459404% |
| D | 4865 | 467 | 9.599178% |
Noise dominated data is calculated using 1-second bins in cleaned event files. If a bin has >2000 counts, and if more than 50% of those come from <1% of pixels, then it is considered to be noise-dominated and hence unusable.
| Quadrant | # 1 sec bins | Bins with >0 counts | Bins with >2000 counts | High rate bins dominated by noise | Noise dominated (total time) | Noise dominated (detector-on time) | Marked lightcurve |
|---|---|---|---|---|---|---|---|
| A | 6987 | 4866 | 1217 | 1217 | 17.42% | 25.01% | 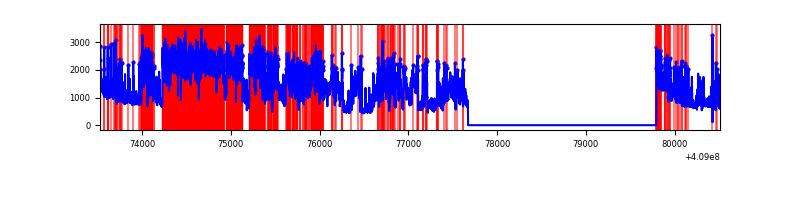 |
| B | 6987 | 4866 | 3 | 3 | 0.04% | 0.06% | 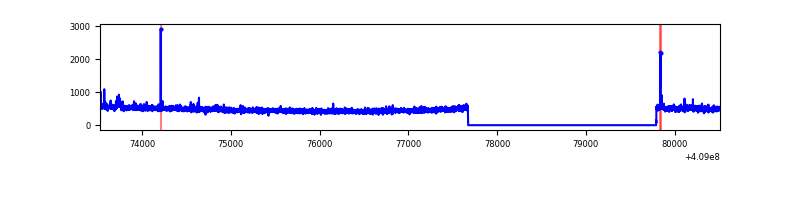 |
| C | 6987 | 4866 | 54 | 54 | 0.77% | 1.11% | 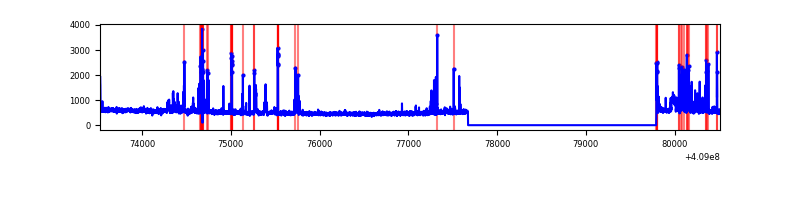 |
| D | 6987 | 4866 | 382 | 382 | 5.47% | 7.85% | 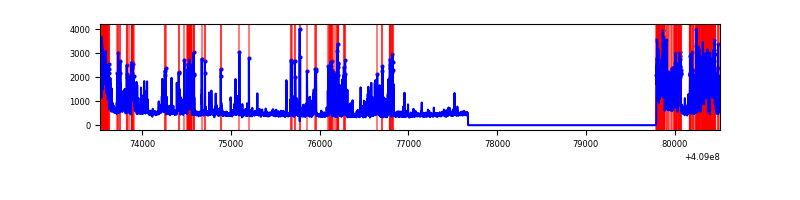 |
Top three noisy pixels from each quadrant. If the there are fewer than three noisy pixels in the level2.evt file, extra rows are filled as -1
| Pixel properties | Quadrant properties | ||||||
|---|---|---|---|---|---|---|---|
| Quadrant | DetID | PixID | Counts | Sigma | Mean | Median | Sigma |
| A | 15 | 222 | 4760234 | 45063.4 | 529 | 519 | 105.6 |
| A | 10 | 83 | 383610 | 3626.98 | 529 | 519 | 105.6 |
| A | 13 | 248 | 40262 | 376.27 | 529 | 519 | 105.6 |
| B | 15 | 85 | 15327 | 135.13 | 576 | 561 | 109.3 |
| B | 12 | 111 | 13219 | 115.84 | 576 | 561 | 109.3 |
| B | 5 | 172 | 13012 | 113.95 | 576 | 561 | 109.3 |
| C | 15 | 208 | 375154 | 2856.52 | 568 | 573 | 131.1 |
| C | 15 | 214 | 205593 | 1563.46 | 568 | 573 | 131.1 |
| C | 3 | 233 | 10222 | 73.58 | 568 | 573 | 131.1 |
| D | 2 | 249 | 913281 | 6944.82 | 544 | 530 | 131.4 |
| D | 1 | 47 | 352611 | 2678.87 | 544 | 530 | 131.4 |
| D | 12 | 233 | 343798 | 2611.81 | 544 | 530 | 131.4 |
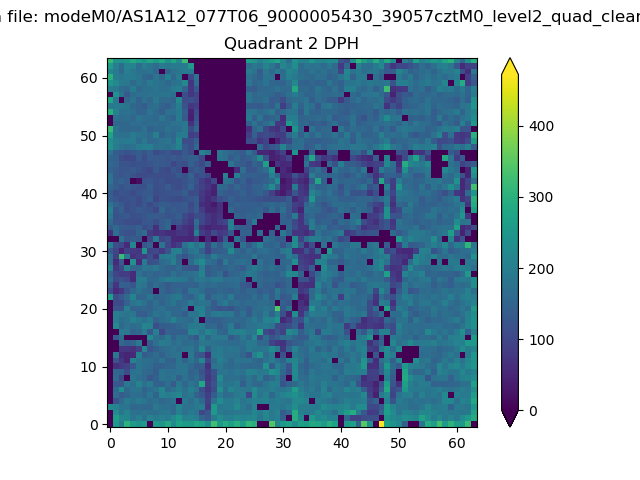
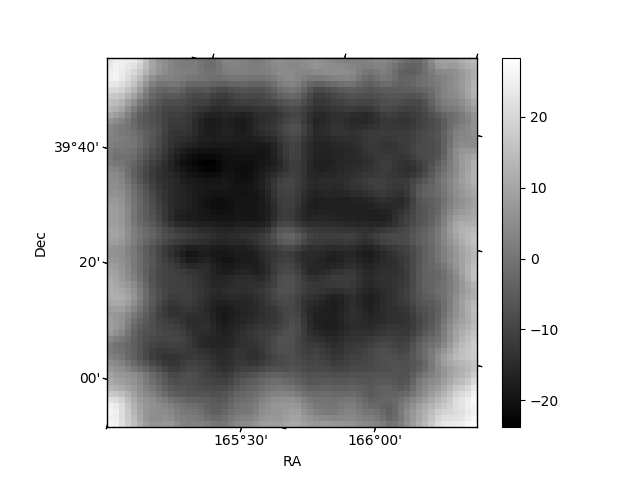
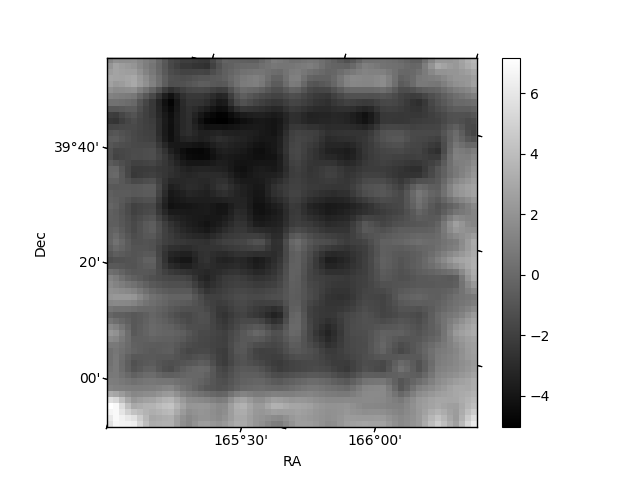
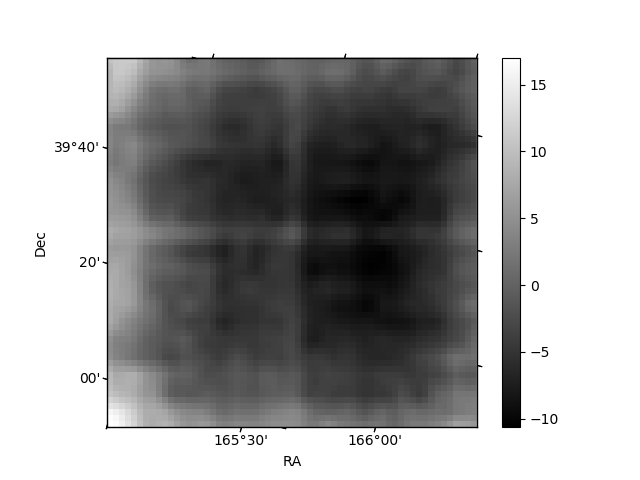
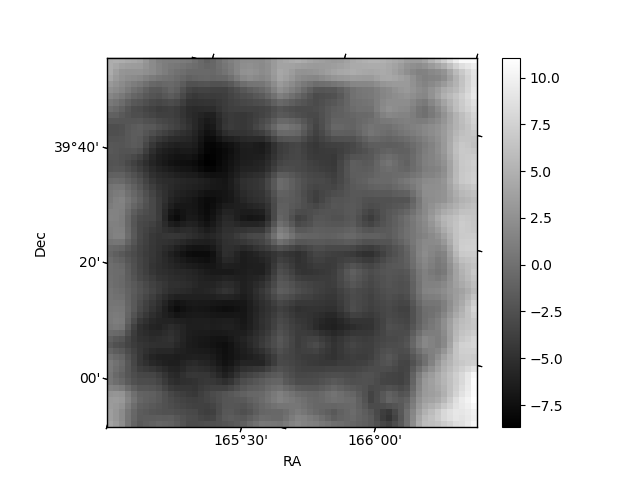
Histogram calculated using DETX and DETY for each event in the final _common_clean file
| Quadrant A | 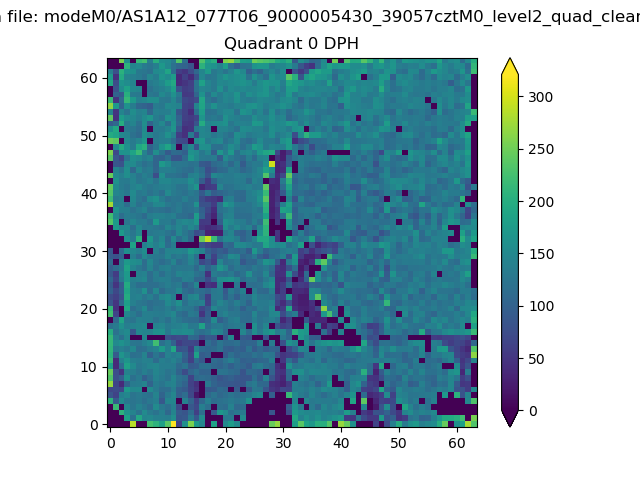 |
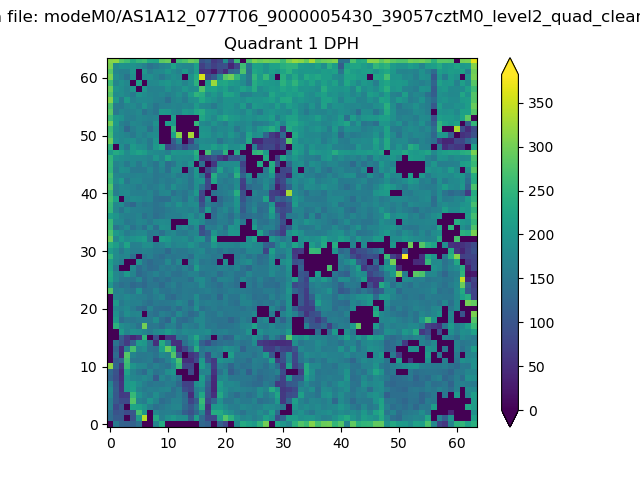 |
Quadrant B |
|---|---|---|---|
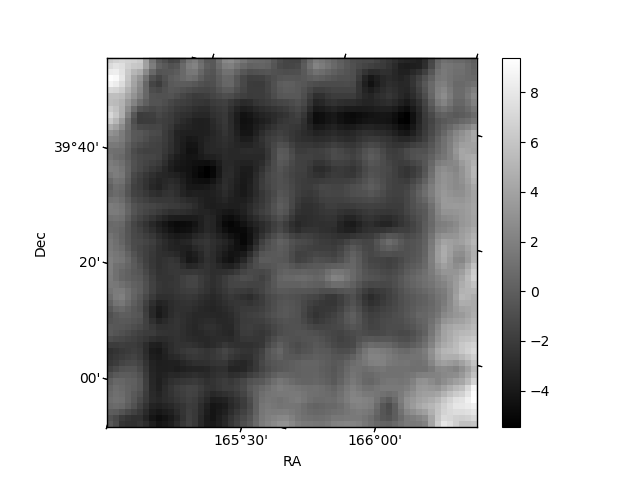
| Quadrant D | 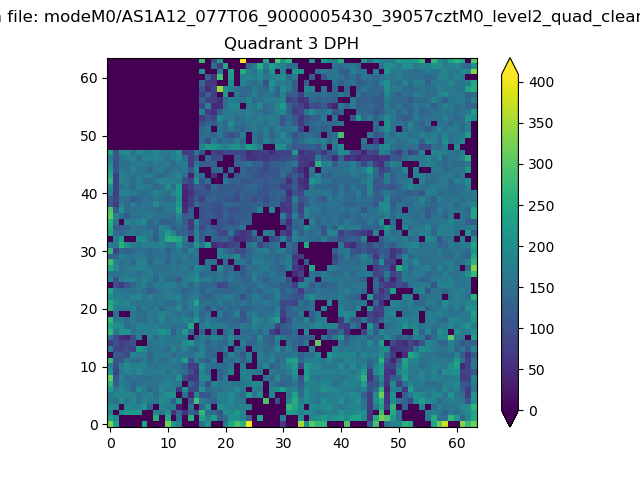 |
 |
Quadrant C |
| Plot type | Count rate plots | Images |
|---|---|---|
| Comparison with Poisson distribution Blue bars denote a histogram of data divided into 1 sec bins. Red curve is a Poisson curve with rate = median count rate of data. |
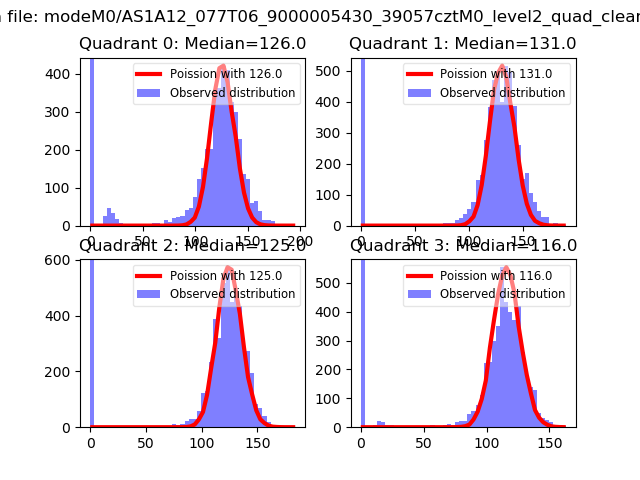 |
 |
| Quadrant-wise count rates Data is divided into 100 sec bins |
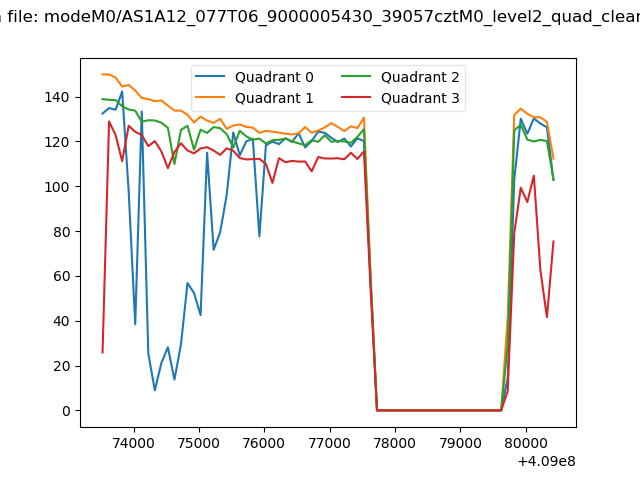 |
|
| Module-wise count rates for Quadrant A Data is divided into 100 sec bins |
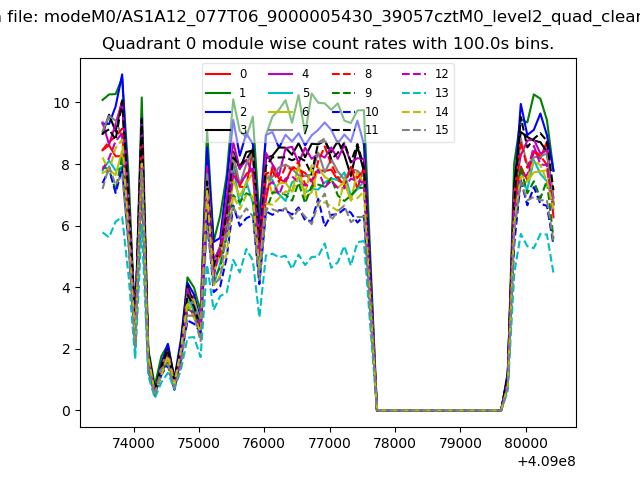 |
 |
| Module-wise count rates for Quadrant B Data is divided into 100 sec bins |
 |
 |
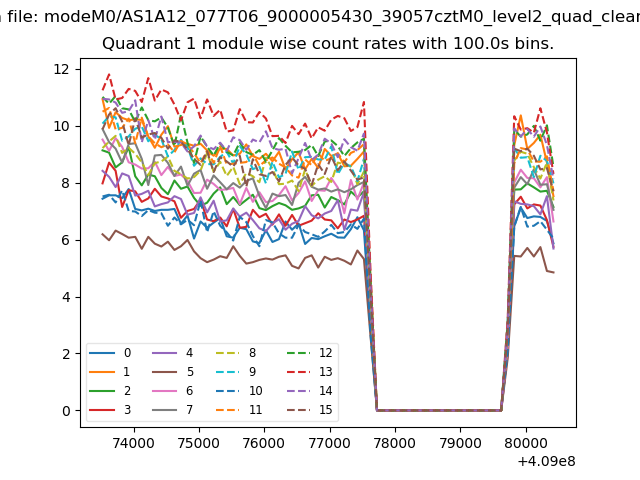
| Module-wise count rates for Quadrant C Data is divided into 100 sec bins |
 |
 |
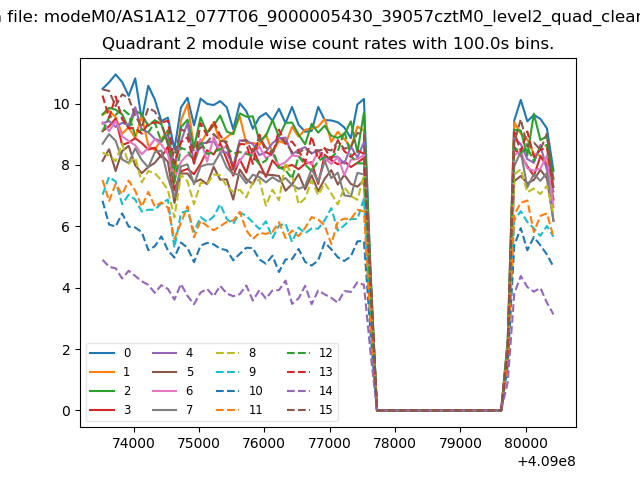
| Module-wise count rates for Quadrant D Data is divided into 100 sec bins |
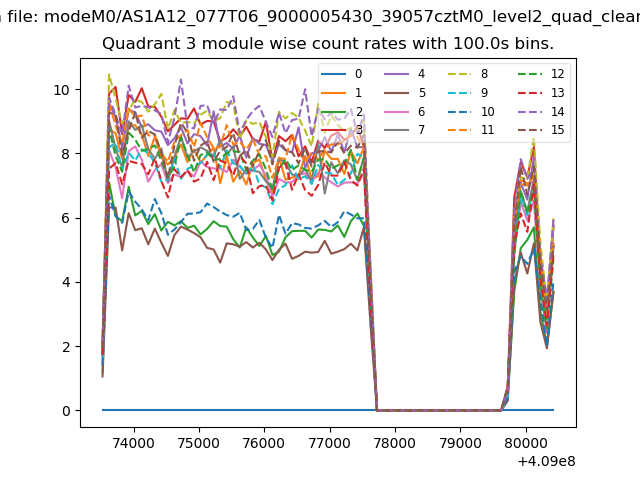 |
 |
| Parameter | Plot |
|---|---|
| CZT HV Monitor | 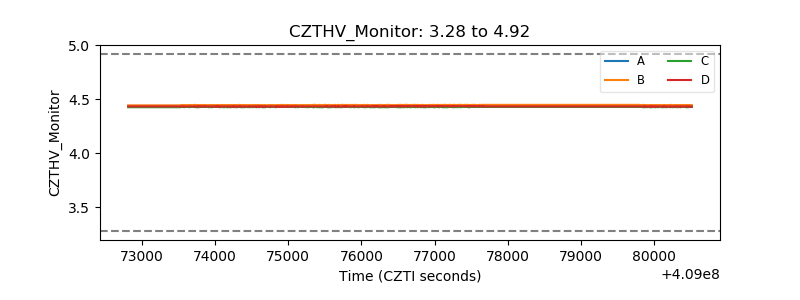 |
| D_VDD | 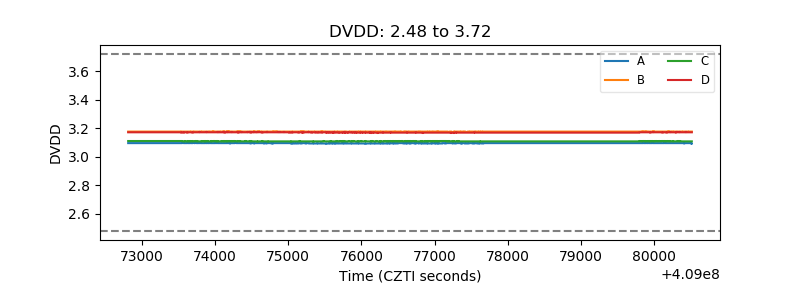 |
| Temperature 1 | 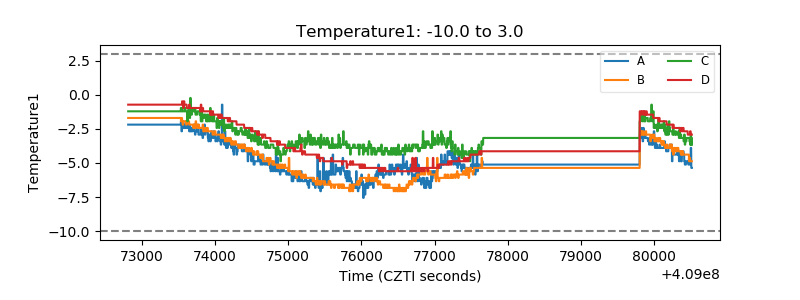 |
| Veto HV Monitor | 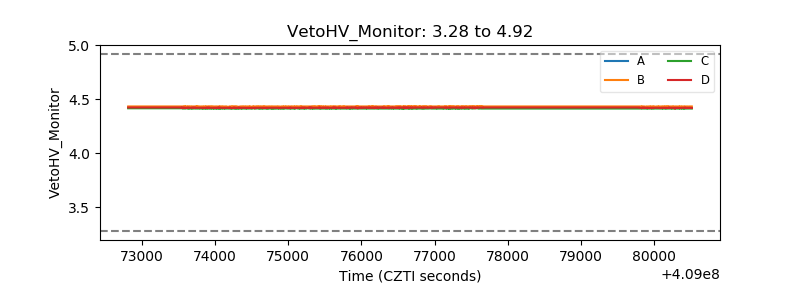 |
| Veto LLD | 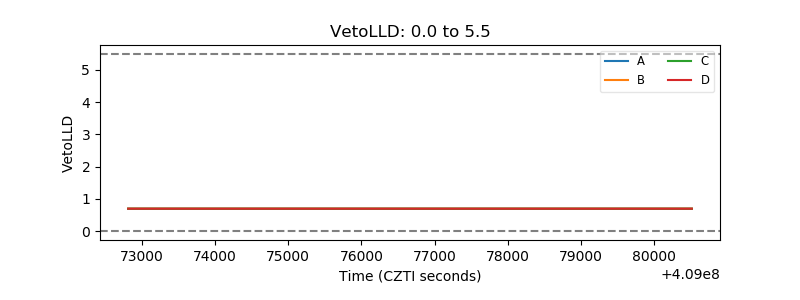 |
| Alpha Counter | 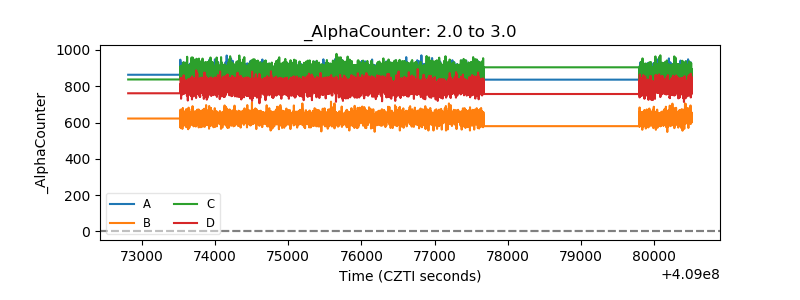 |
| _CPM_Rate | 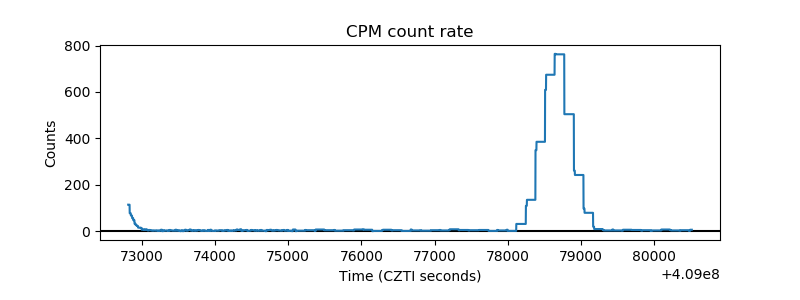 |
| CZT Counter | 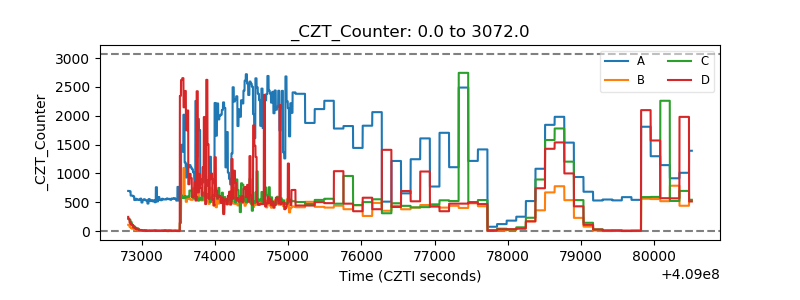 |
| +2.5 Volts monitor | 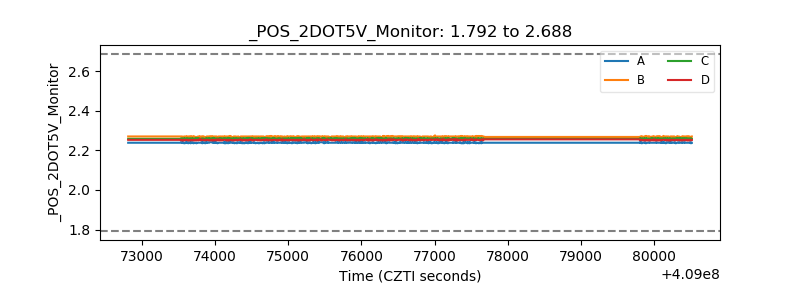 |
| +5 Volts monitor | 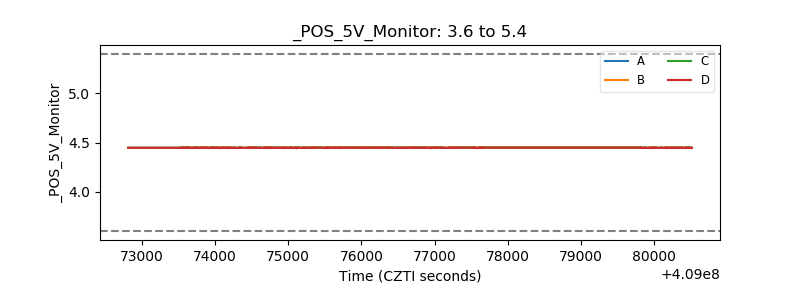 |
| _ROLL_ROT | 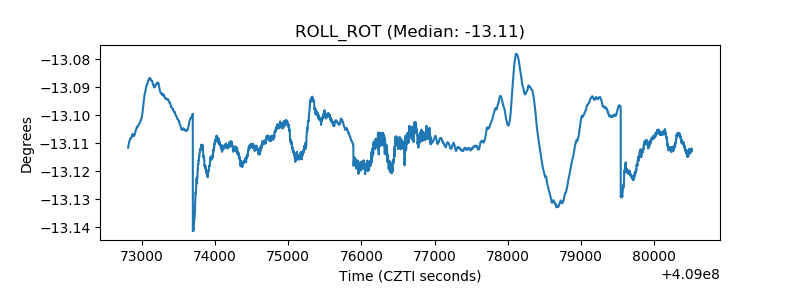 |
| _Roll_DEC | 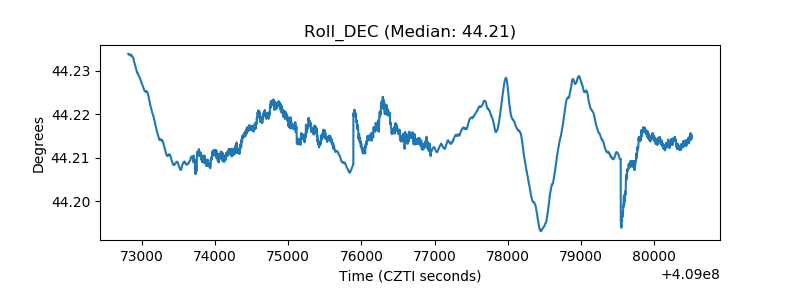 |
| _Roll_RA | 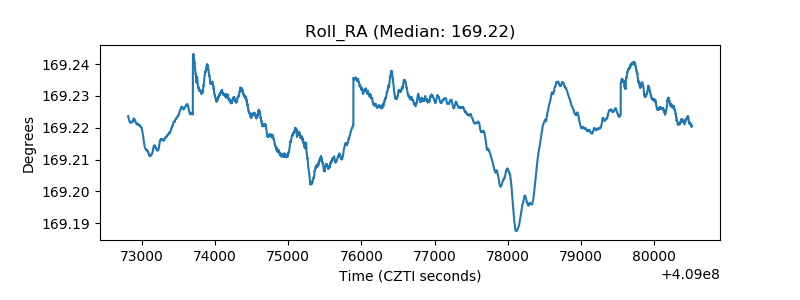 |
| Veto Counter | 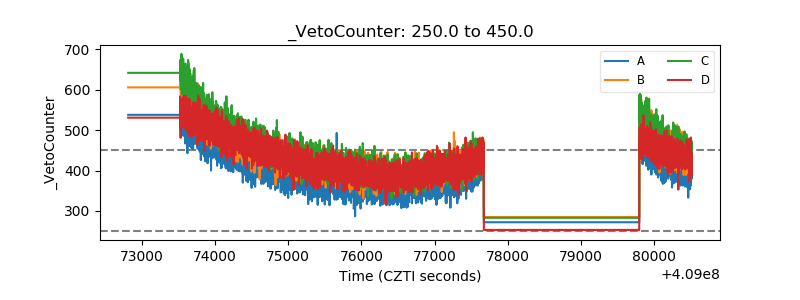 |