| Param | Original file | Final file |
|---|---|---|
| Filename | modeM0/AS1A12_077T06_9000005430_39058cztM0_level2.fits | modeM0/AS1A12_077T06_9000005430_39058cztM0_level2_quad_clean.evt |
| Size (bytes) | 396,918,720 | 85,921,920 |
| Size | 378.5 MB | 81.9 MB |
| Events in quadrant A | 4,729,904 | 572,483 |
| Events in quadrant B | 2,277,712 | 612,047 |
| Events in quadrant C | 3,260,722 | 574,669 |
| Events in quadrant D | 4,037,709 | 493,920 |
| Mode M9 | |||
|---|---|---|---|
| Quadrant | BADHDUFLAG | Total packets | Discarded packets |
| A | 0 | 32 | 0 |
| B | 0 | 32 | 0 |
| C | 0 | 32 | 0 |
| D | 0 | 33 | 0 |
| Mode M0 | |||
|---|---|---|---|
| Quadrant | BADHDUFLAG | Total packets | Discarded packets |
| A | 0 | 17545 | 3 |
| B | 0 | 10051 | 2 |
| C | 0 | 12878 | 2 |
| D | 0 | 15414 | 2 |
| Mode SS | |||
|---|---|---|---|
| Quadrant | BADHDUFLAG | Total packets | Discarded packets |
| A | 0 | 102 | 0 |
| B | 0 | 102 | 0 |
| C | 0 | 102 | 0 |
| D | 0 | 102 | 0 |
| Quadrant | Total seconds | Saturated seconds | Saturation percentage |
|---|---|---|---|
| A | 4970 | 357 | 7.183099% |
| B | 4970 | 12 | 0.241449% |
| C | 4970 | 158 | 3.179074% |
| D | 4970 | 539 | 10.845070% |
Noise dominated data is calculated using 1-second bins in cleaned event files. If a bin has >2000 counts, and if more than 50% of those come from <1% of pixels, then it is considered to be noise-dominated and hence unusable.
| Quadrant | # 1 sec bins | Bins with >0 counts | Bins with >2000 counts | High rate bins dominated by noise | Noise dominated (total time) | Noise dominated (detector-on time) | Marked lightcurve |
|---|---|---|---|---|---|---|---|
| A | 6973 | 4971 | 326 | 326 | 4.68% | 6.56% | 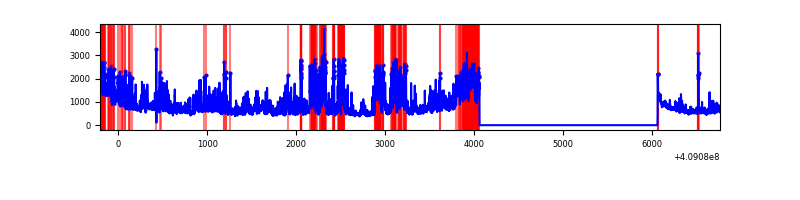 |
| B | 6973 | 4971 | 3 | 3 | 0.04% | 0.06% | 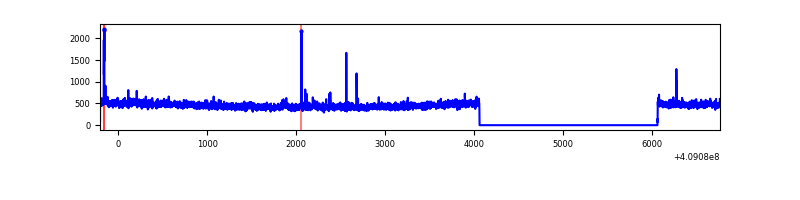 |
| C | 6973 | 4971 | 116 | 116 | 1.66% | 2.33% | 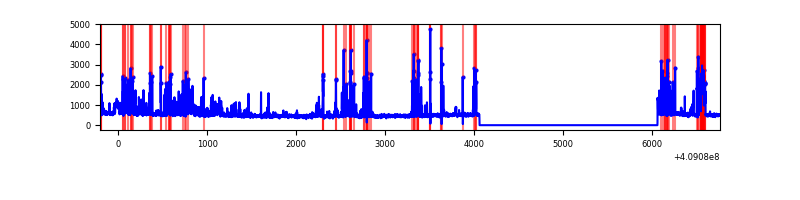 |
| D | 6973 | 4971 | 422 | 422 | 6.05% | 8.49% | 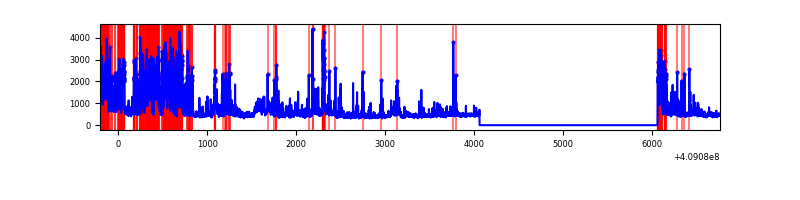 |
Top three noisy pixels from each quadrant. If the there are fewer than three noisy pixels in the level2.evt file, extra rows are filled as -1
| Pixel properties | Quadrant properties | ||||||
|---|---|---|---|---|---|---|---|
| Quadrant | DetID | PixID | Counts | Sigma | Mean | Median | Sigma |
| A | 15 | 222 | 1461065 | 13070.13 | 553 | 543 | 111.7 |
| A | 13 | 248 | 723317 | 6468.06 | 553 | 543 | 111.7 |
| A | 10 | 83 | 397711 | 3554.23 | 553 | 543 | 111.7 |
| B | 5 | 172 | 18558 | 166.79 | 563 | 548 | 108.0 |
| B | 0 | 190 | 16106 | 144.08 | 563 | 548 | 108.0 |
| B | 0 | 230 | 13425 | 119.25 | 563 | 548 | 108.0 |
| C | 15 | 208 | 885678 | 6885.71 | 550 | 553 | 128.5 |
| C | 15 | 214 | 208514 | 1617.8 | 550 | 553 | 128.5 |
| C | 3 | 233 | 7202 | 51.72 | 550 | 553 | 128.5 |
| D | 2 | 249 | 1149366 | 9029.41 | 526 | 511 | 127.2 |
| D | 1 | 47 | 338438 | 2655.93 | 526 | 511 | 127.2 |
| D | 12 | 235 | 254389 | 1995.35 | 526 | 511 | 127.2 |
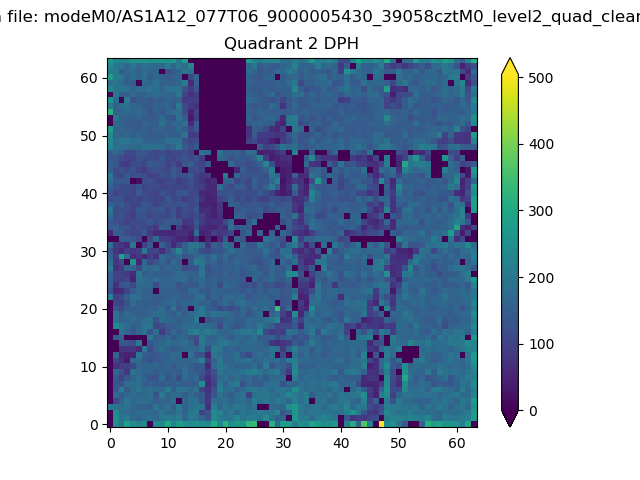
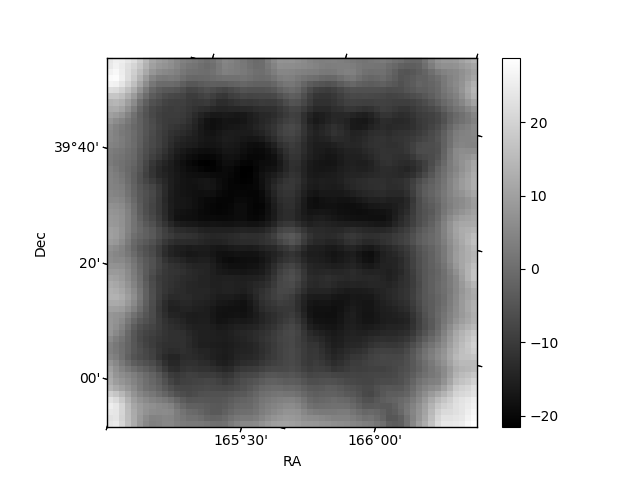
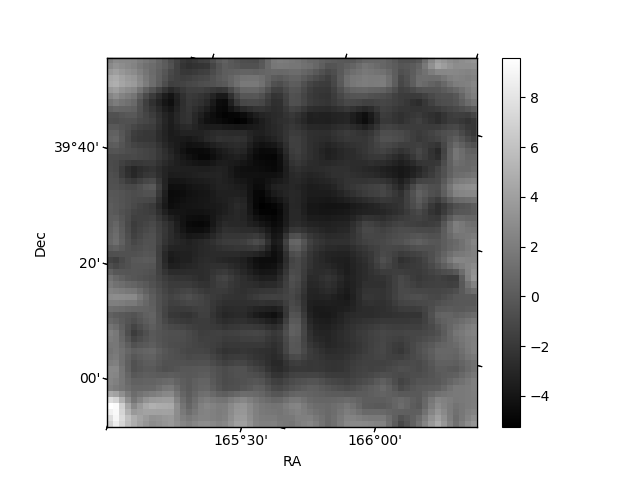
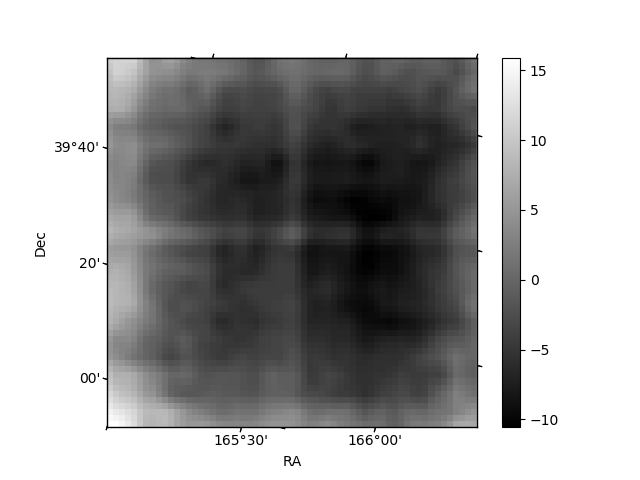
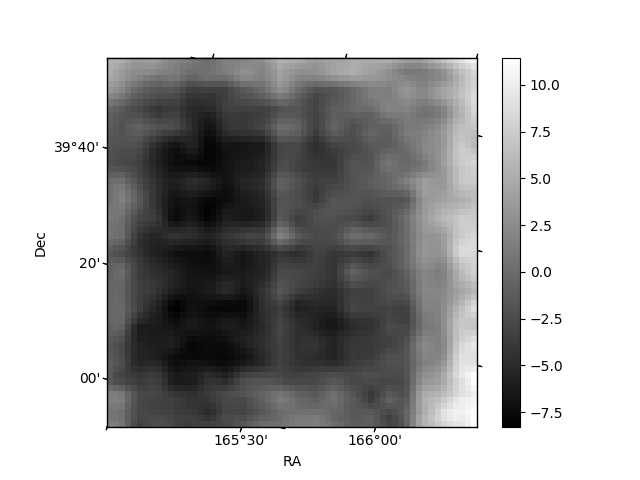
Histogram calculated using DETX and DETY for each event in the final _common_clean file
| Quadrant A | 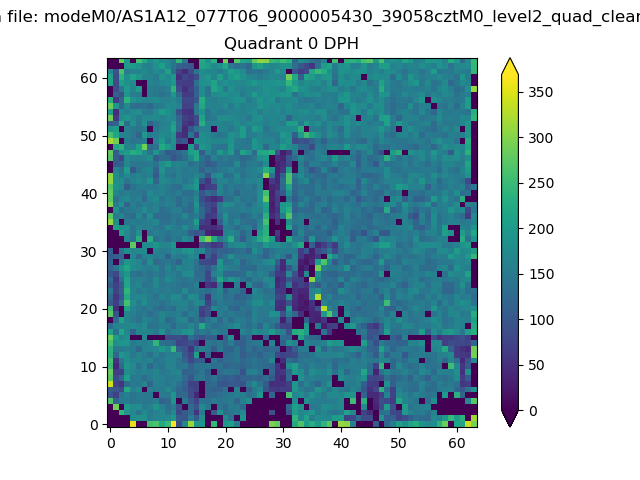 |
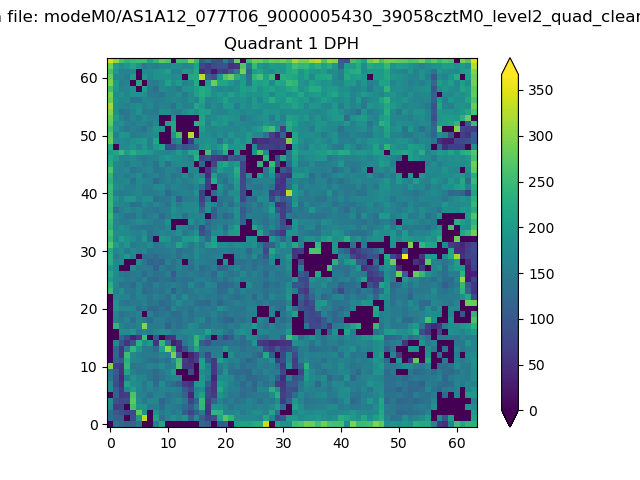 |
Quadrant B |
|---|---|---|---|
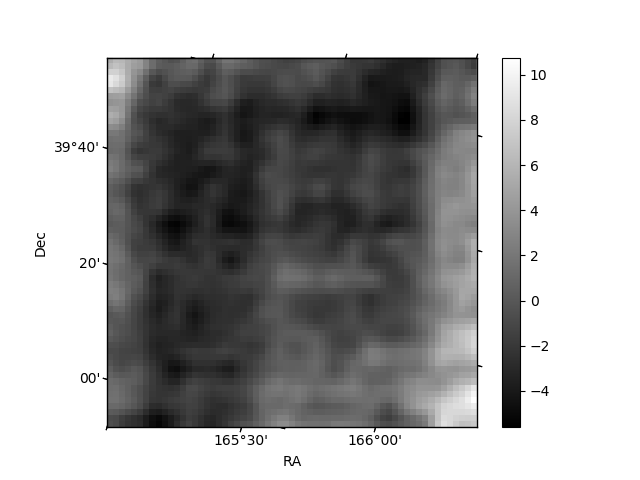
| Quadrant D | 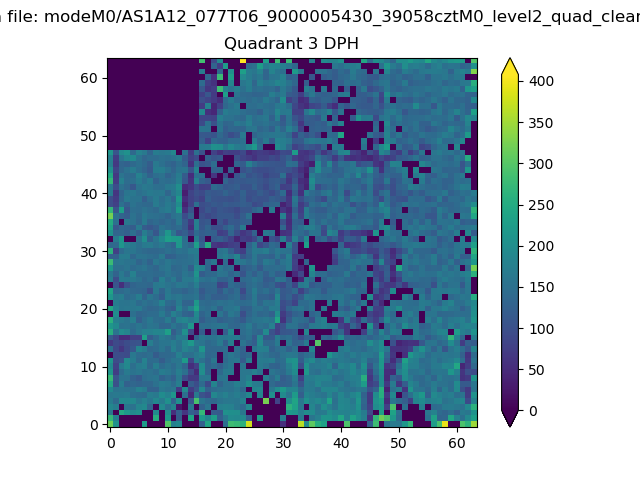 |
 |
Quadrant C |
| Plot type | Count rate plots | Images |
|---|---|---|
| Comparison with Poisson distribution Blue bars denote a histogram of data divided into 1 sec bins. Red curve is a Poisson curve with rate = median count rate of data. |
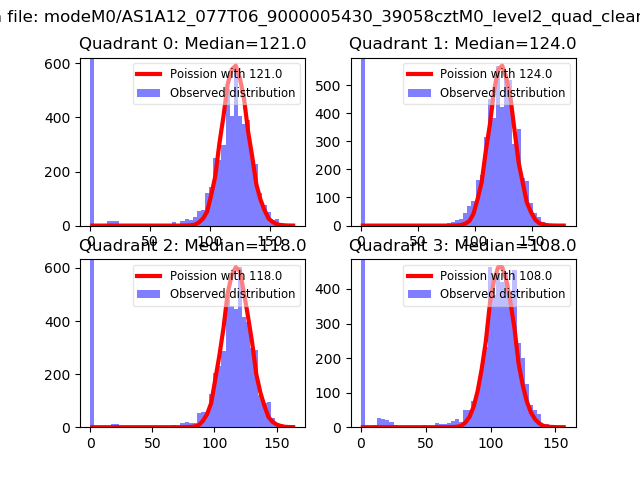 |
 |
| Quadrant-wise count rates Data is divided into 100 sec bins |
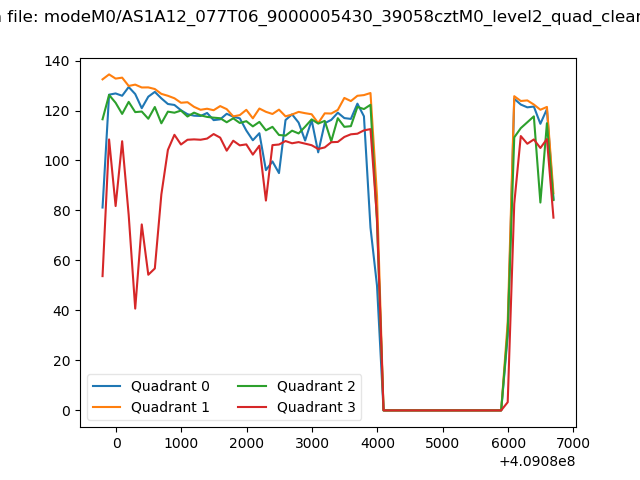 |
|
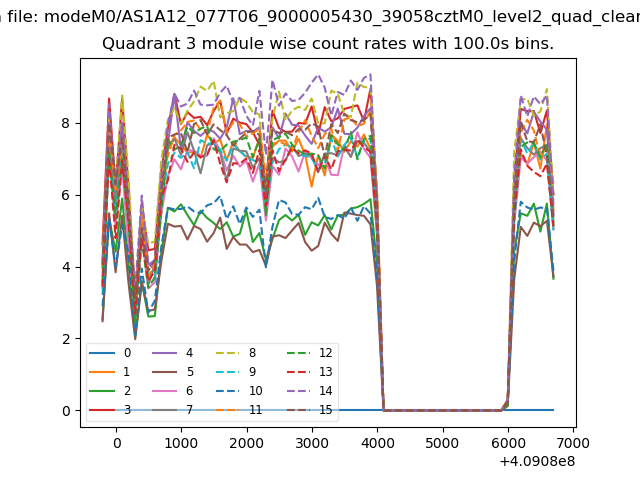
| Module-wise count rates for Quadrant A Data is divided into 100 sec bins |
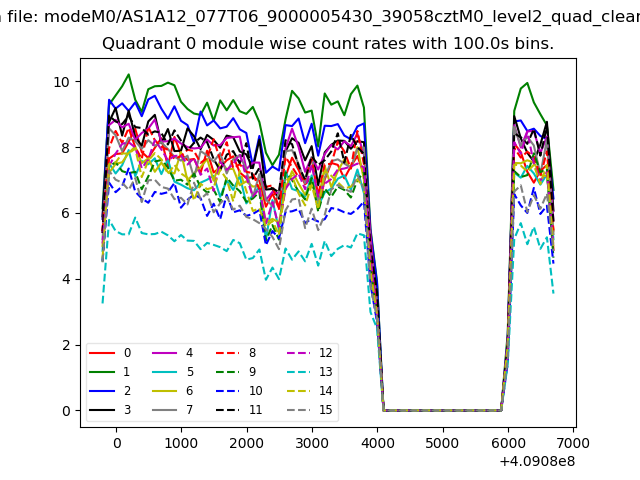 |
 |
| Module-wise count rates for Quadrant B Data is divided into 100 sec bins |
 |
 |
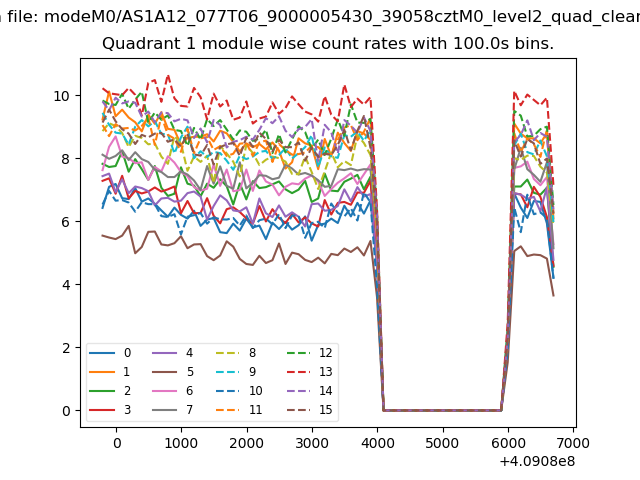
| Module-wise count rates for Quadrant C Data is divided into 100 sec bins |
 |
 |
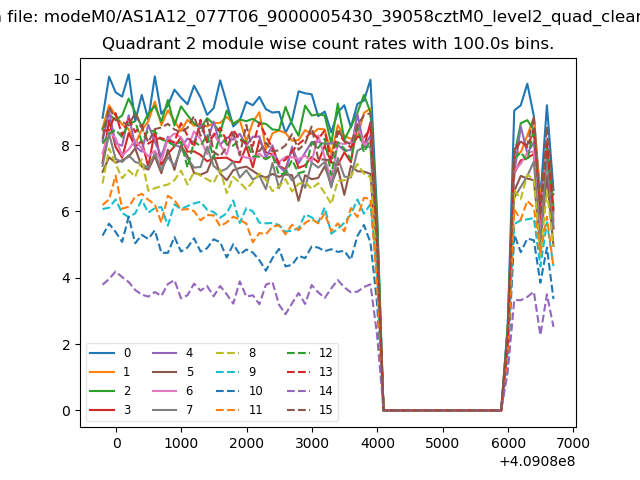
| Module-wise count rates for Quadrant D Data is divided into 100 sec bins |
 |
 |
| Parameter | Plot |
|---|---|
| CZT HV Monitor | 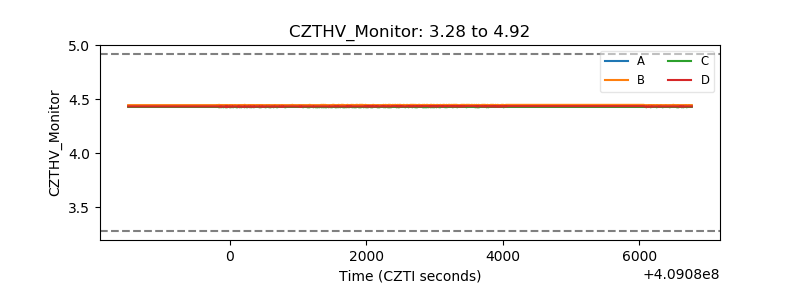 |
| D_VDD | 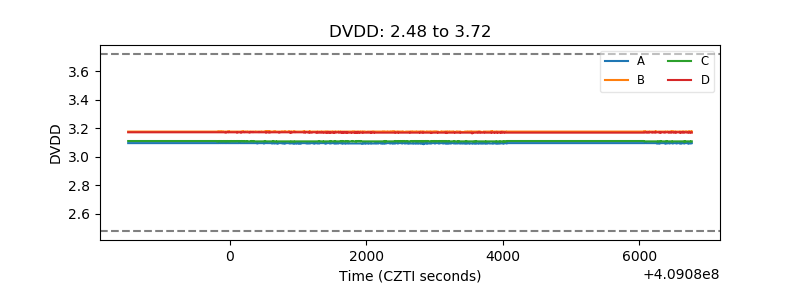 |
| Temperature 1 | 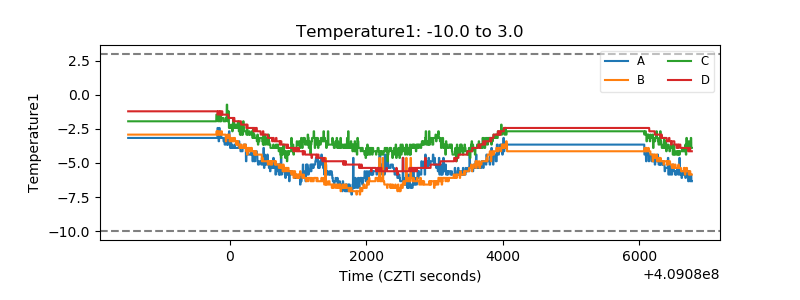 |
| Veto HV Monitor | 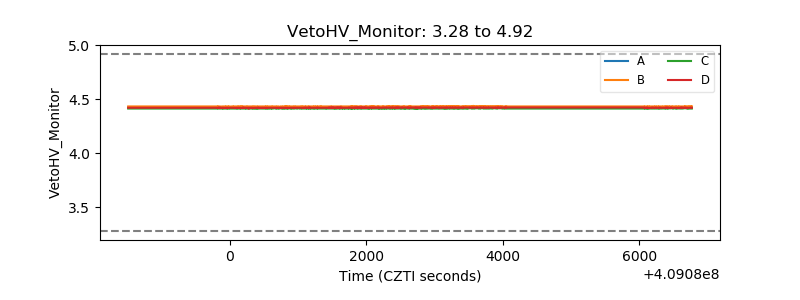 |
| Veto LLD | 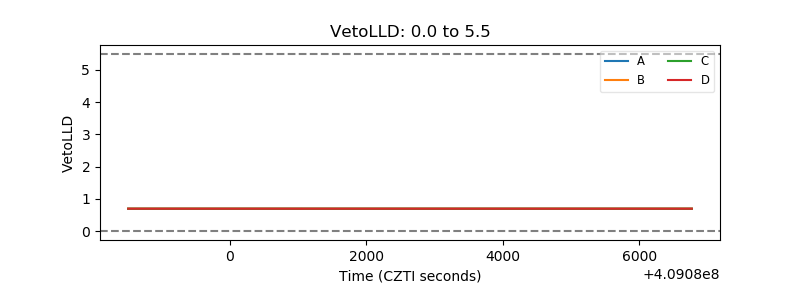 |
| Alpha Counter | 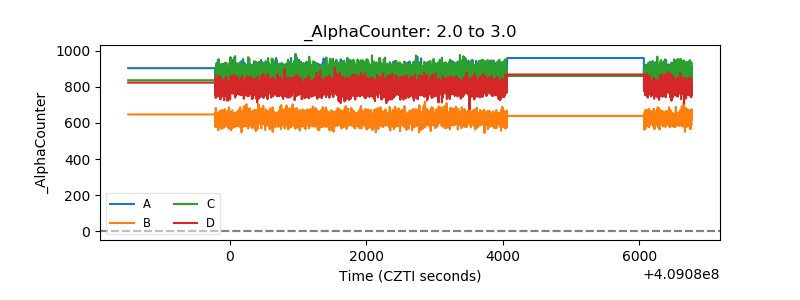 |
| _CPM_Rate | 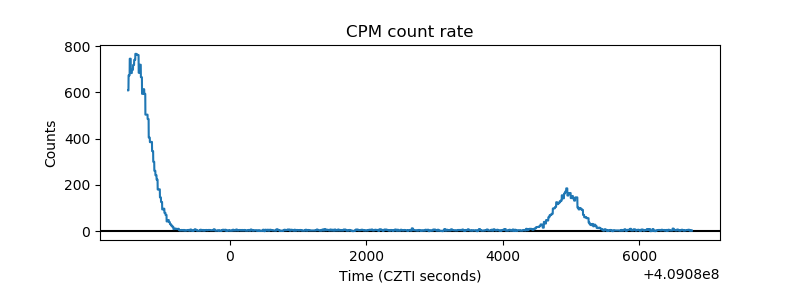 |
| CZT Counter | 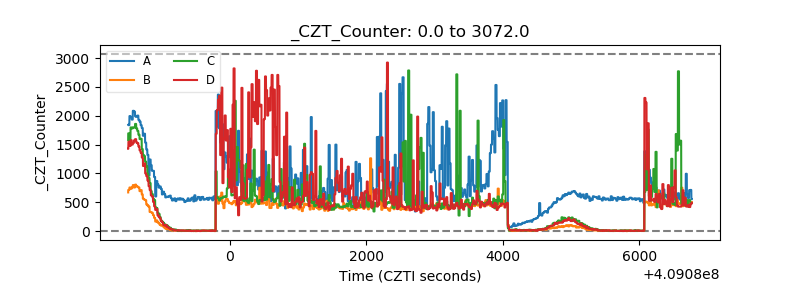 |
| +2.5 Volts monitor | 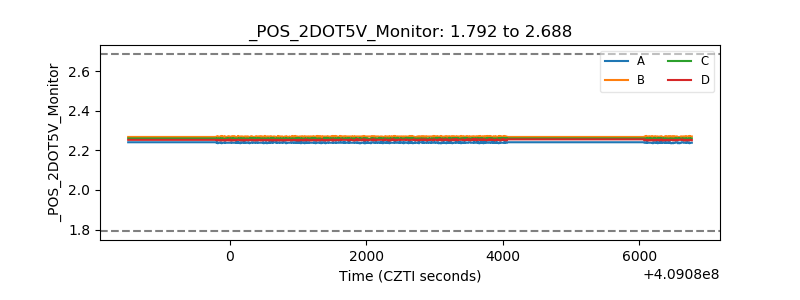 |
| +5 Volts monitor | 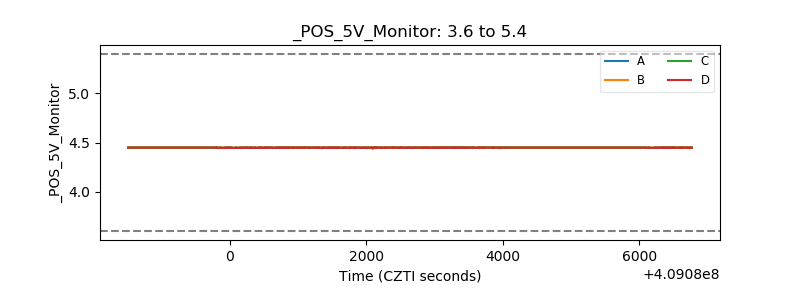 |
| _ROLL_ROT | 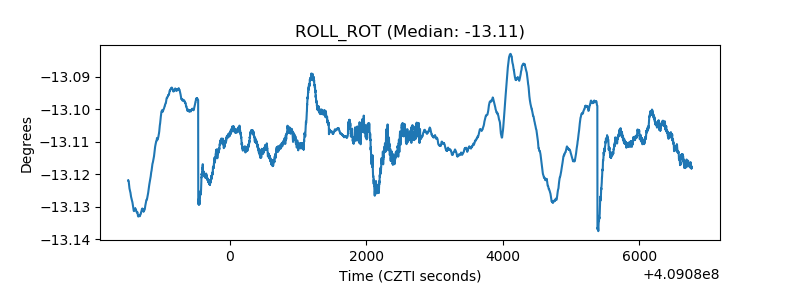 |
| _Roll_DEC | 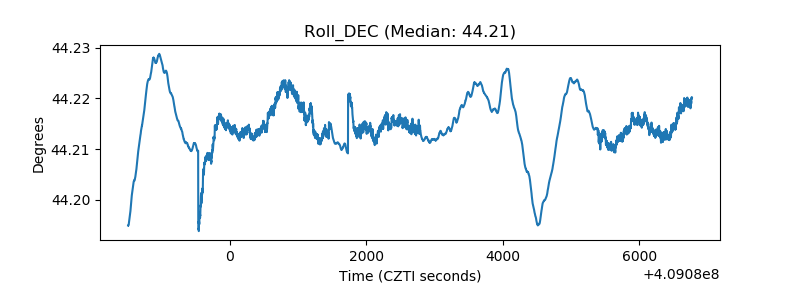 |
| _Roll_RA | 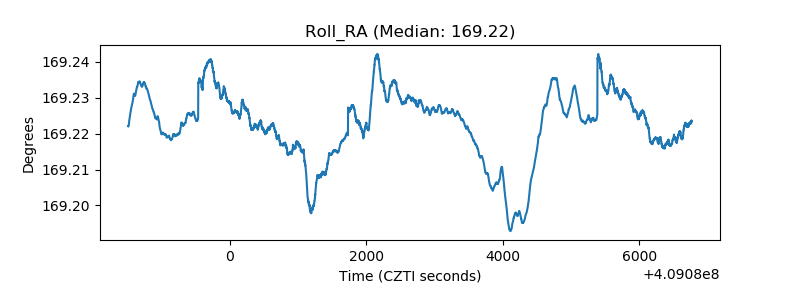 |
| Veto Counter | 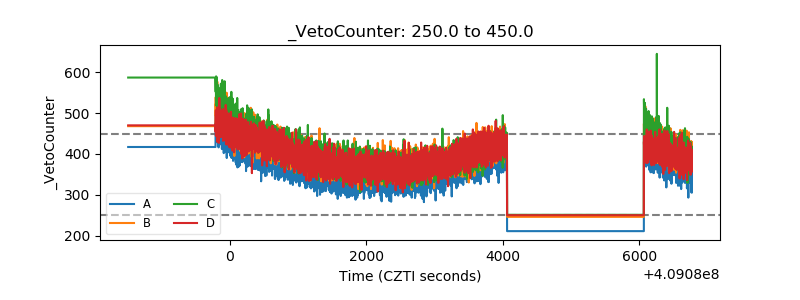 |