| Param | Original file | Final file |
|---|---|---|
| Filename | modeM0/AS1A12_077T06_9000005430_39059cztM0_level2.fits | modeM0/AS1A12_077T06_9000005430_39059cztM0_level2_quad_clean.evt |
| Size (bytes) | 388,702,080 | 90,374,400 |
| Size | 370.7 MB | 86.2 MB |
| Events in quadrant A | 4,138,028 | 609,598 |
| Events in quadrant B | 2,388,144 | 634,243 |
| Events in quadrant C | 4,311,378 | 564,830 |
| Events in quadrant D | 3,132,799 | 551,458 |
| Mode M9 | |||
|---|---|---|---|
| Quadrant | BADHDUFLAG | Total packets | Discarded packets |
| A | 0 | 34 | 0 |
| B | 0 | 34 | 0 |
| C | 0 | 34 | 0 |
| D | 0 | 35 | 0 |
| Mode M0 | |||
|---|---|---|---|
| Quadrant | BADHDUFLAG | Total packets | Discarded packets |
| A | 0 | 16040 | 3 |
| B | 0 | 10807 | 2 |
| C | 0 | 16266 | 2 |
| D | 0 | 13169 | 2 |
| Mode SS | |||
|---|---|---|---|
| Quadrant | BADHDUFLAG | Total packets | Discarded packets |
| A | 0 | 110 | 0 |
| B | 0 | 110 | 0 |
| C | 0 | 110 | 0 |
| D | 0 | 110 | 0 |
| Quadrant | Total seconds | Saturated seconds | Saturation percentage |
|---|---|---|---|
| A | 5373 | 127 | 2.363670% |
| B | 5373 | 8 | 0.148893% |
| C | 5373 | 500 | 9.305788% |
| D | 5373 | 150 | 2.791736% |
Noise dominated data is calculated using 1-second bins in cleaned event files. If a bin has >2000 counts, and if more than 50% of those come from <1% of pixels, then it is considered to be noise-dominated and hence unusable.
| Quadrant | # 1 sec bins | Bins with >0 counts | Bins with >2000 counts | High rate bins dominated by noise | Noise dominated (total time) | Noise dominated (detector-on time) | Marked lightcurve |
|---|---|---|---|---|---|---|---|
| A | 7076 | 5374 | 107 | 107 | 1.51% | 1.99% | 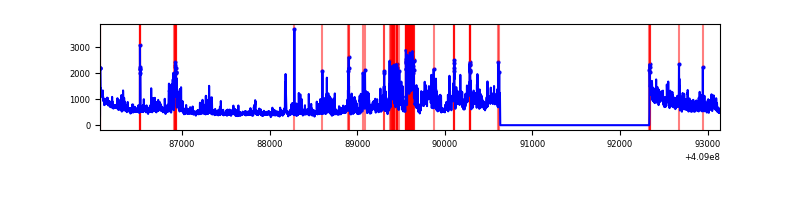 |
| B | 7076 | 5374 | 0 | 0 | 0.00% | 0.00% |  |
| C | 7076 | 5374 | 392 | 392 | 5.54% | 7.29% | 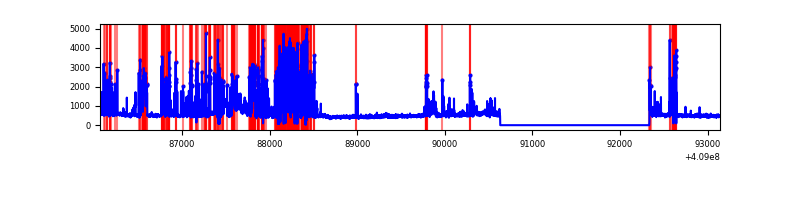 |
| D | 7076 | 5374 | 125 | 125 | 1.77% | 2.33% | 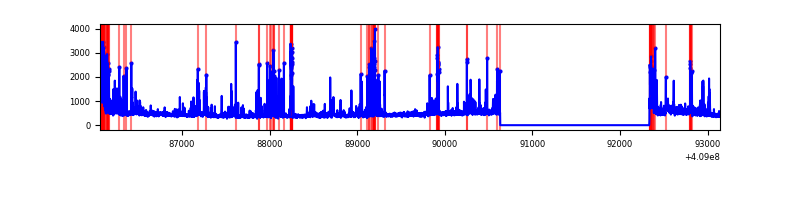 |
Top three noisy pixels from each quadrant. If the there are fewer than three noisy pixels in the level2.evt file, extra rows are filled as -1
| Pixel properties | Quadrant properties | ||||||
|---|---|---|---|---|---|---|---|
| Quadrant | DetID | PixID | Counts | Sigma | Mean | Median | Sigma |
| A | 15 | 222 | 1110683 | 9251.24 | 589 | 577 | 120.0 |
| A | 10 | 83 | 417039 | 3470.65 | 589 | 577 | 120.0 |
| A | 13 | 248 | 300587 | 2500.18 | 589 | 577 | 120.0 |
| B | 0 | 230 | 27009 | 231.17 | 593 | 577 | 114.3 |
| B | 12 | 111 | 14204 | 119.18 | 593 | 577 | 114.3 |
| B | 11 | 111 | 13315 | 111.4 | 593 | 577 | 114.3 |
| C | 15 | 208 | 1890957 | 14446.15 | 561 | 565 | 130.9 |
| C | 15 | 214 | 216993 | 1653.92 | 561 | 565 | 130.9 |
| C | 0 | 10 | 8411 | 59.96 | 561 | 565 | 130.9 |
| D | 1 | 47 | 425640 | 3035.39 | 573 | 557 | 140.0 |
| D | 2 | 249 | 228333 | 1626.48 | 573 | 557 | 140.0 |
| D | 13 | 249 | 68626 | 486.06 | 573 | 557 | 140.0 |
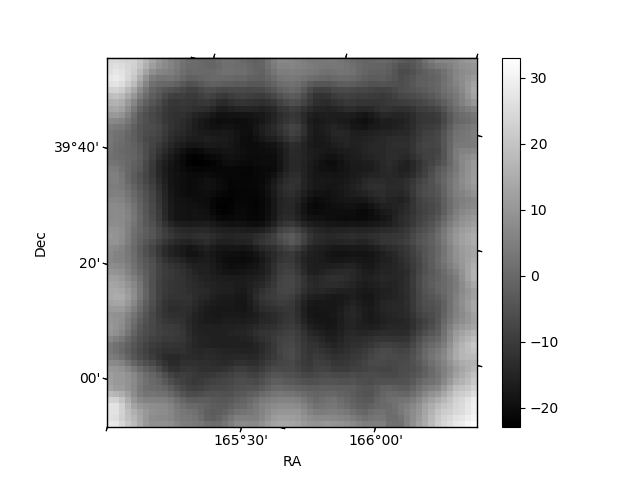
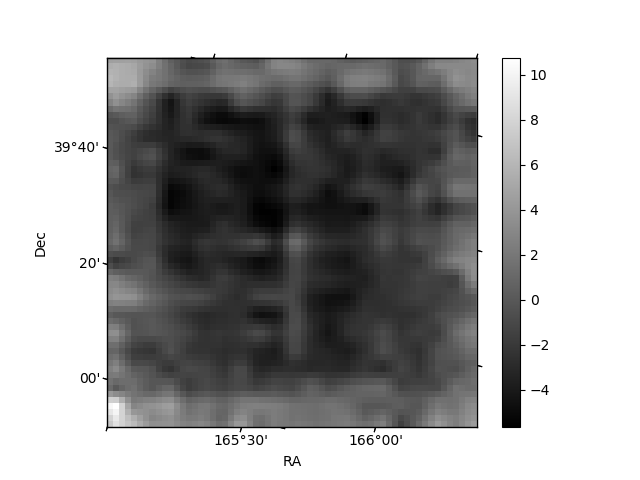
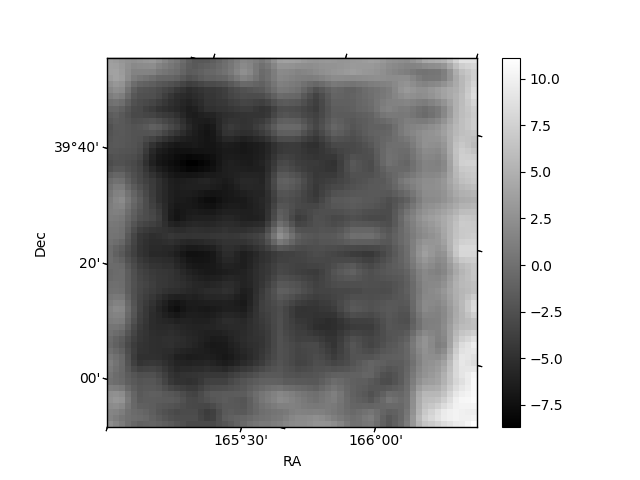
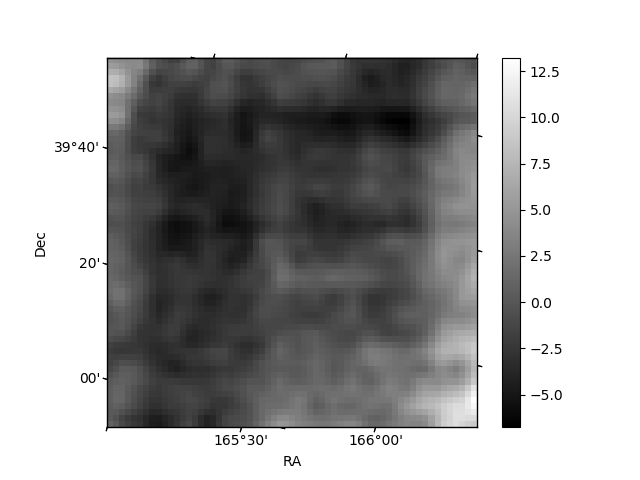
Histogram calculated using DETX and DETY for each event in the final _common_clean file
| Quadrant A | 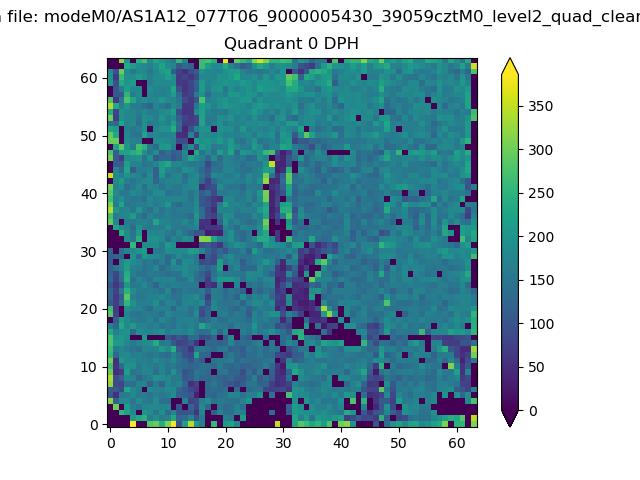 |
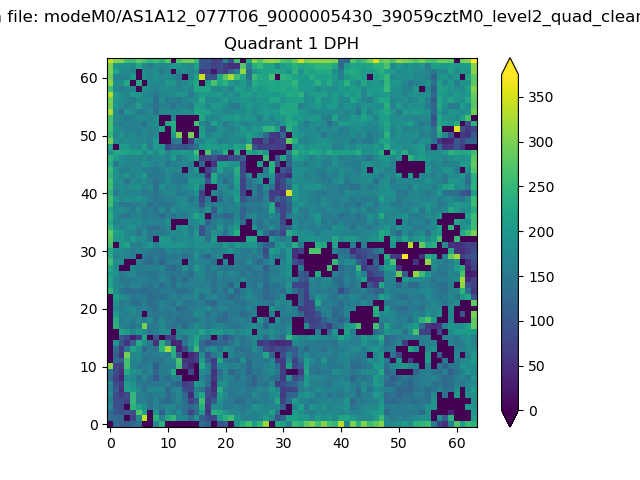 |
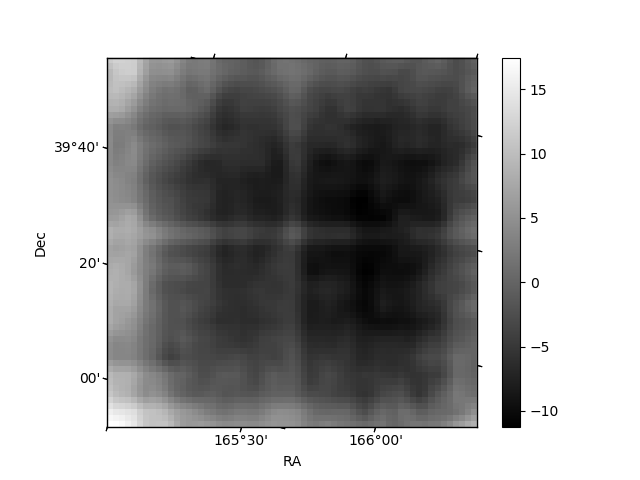
Quadrant B |
|---|---|---|---|
| Quadrant D | 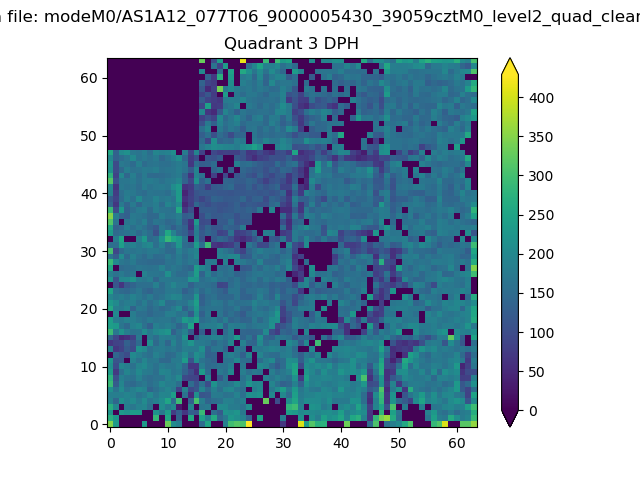 |
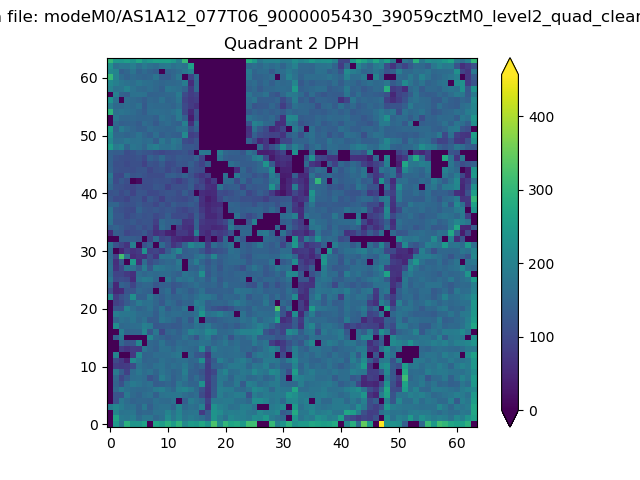 |
Quadrant C |
| Plot type | Count rate plots | Images |
|---|---|---|
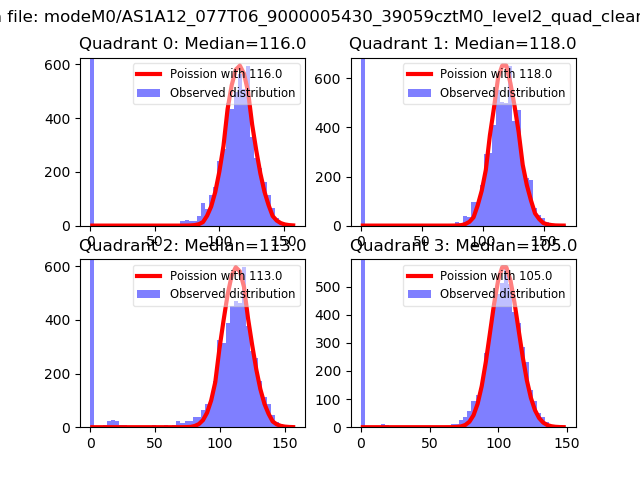
| Comparison with Poisson distribution Blue bars denote a histogram of data divided into 1 sec bins. Red curve is a Poisson curve with rate = median count rate of data. |
 |
 |
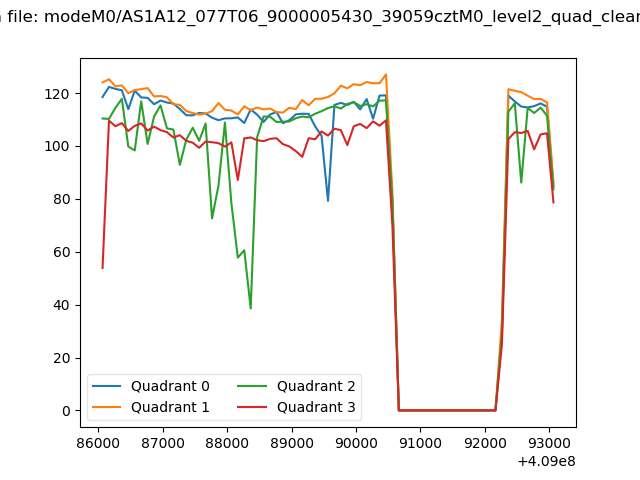
| Quadrant-wise count rates Data is divided into 100 sec bins |
 |
|
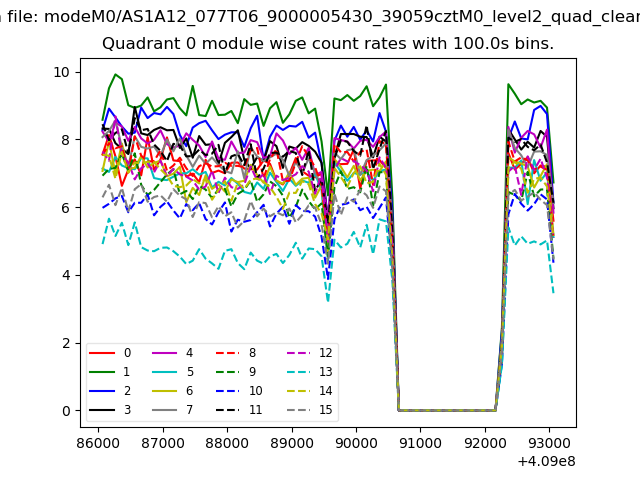
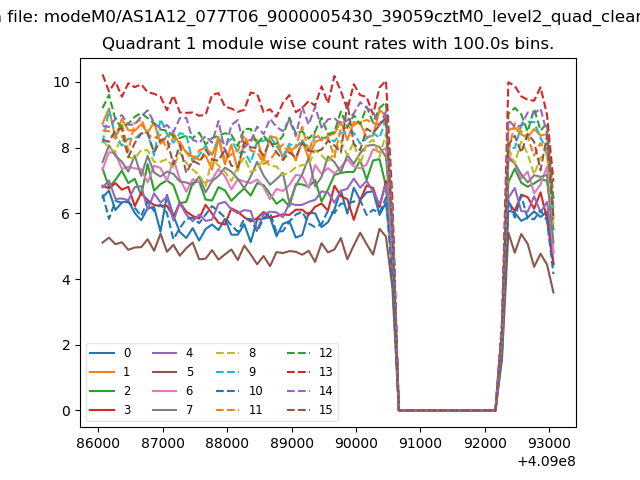
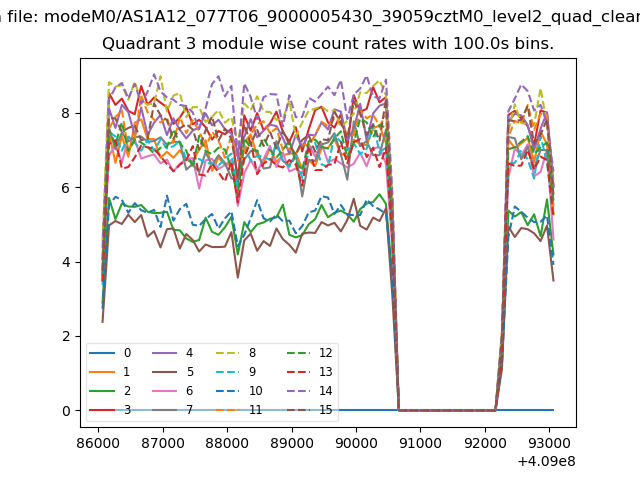
| Module-wise count rates for Quadrant A Data is divided into 100 sec bins |
 |
 |
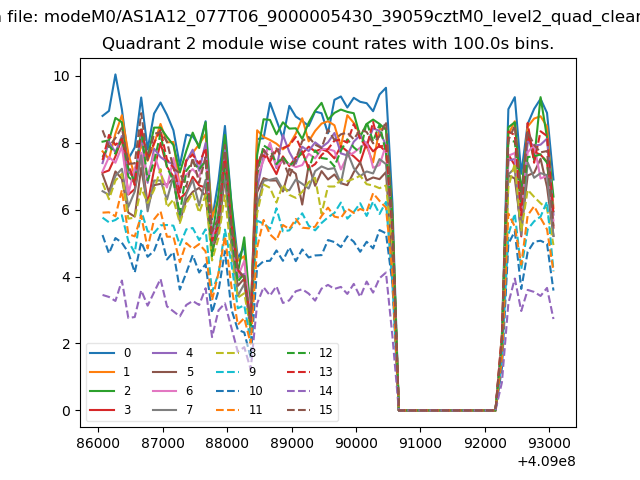
| Module-wise count rates for Quadrant B Data is divided into 100 sec bins |
 |
 |
| Module-wise count rates for Quadrant C Data is divided into 100 sec bins |
 |
 |
| Module-wise count rates for Quadrant D Data is divided into 100 sec bins |
 |
 |
| Parameter | Plot |
|---|---|
| CZT HV Monitor | 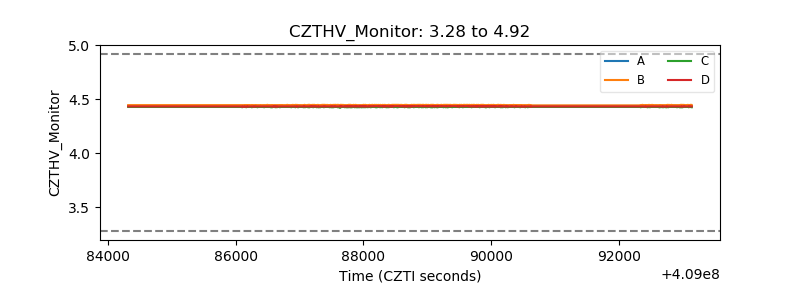 |
| D_VDD | 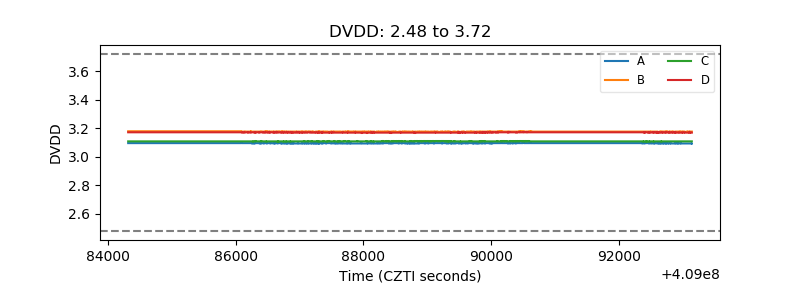 |
| Temperature 1 | 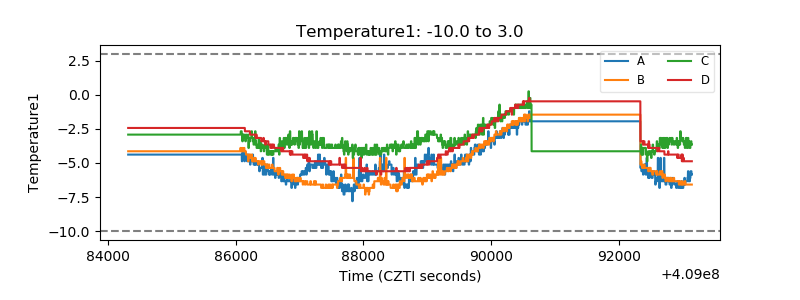 |
| Veto HV Monitor | 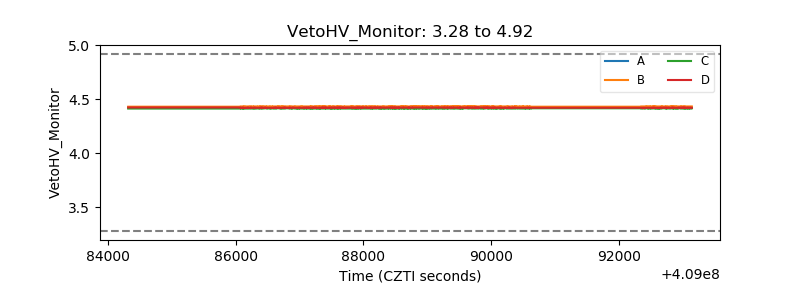 |
| Veto LLD | 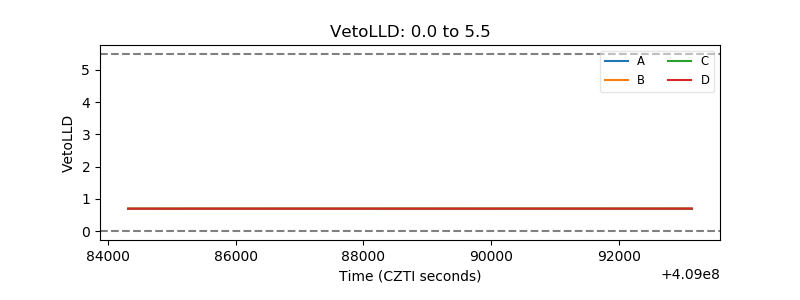 |
| Alpha Counter | 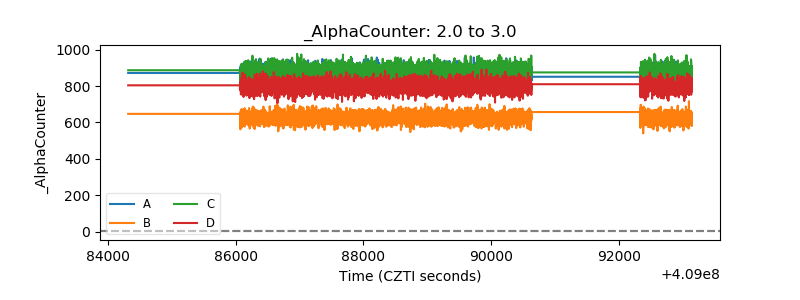 |
| _CPM_Rate | 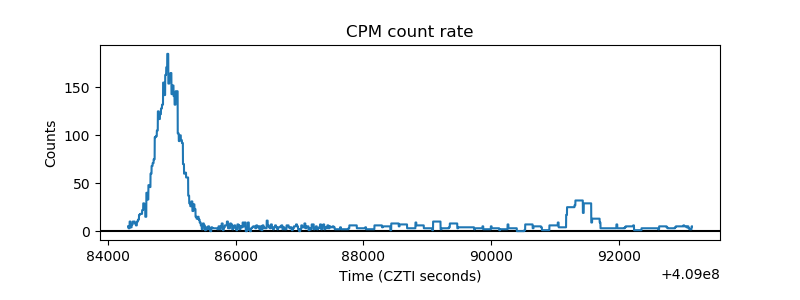 |
| CZT Counter | 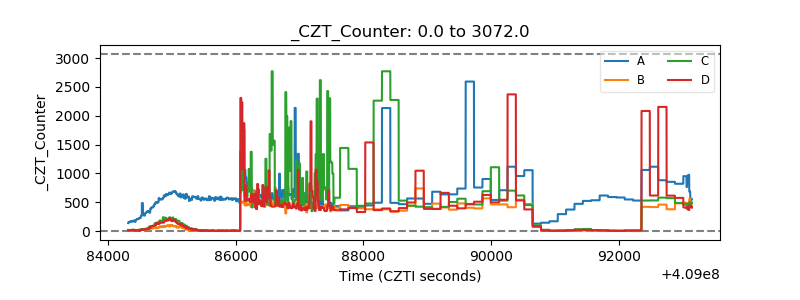 |
| +2.5 Volts monitor | 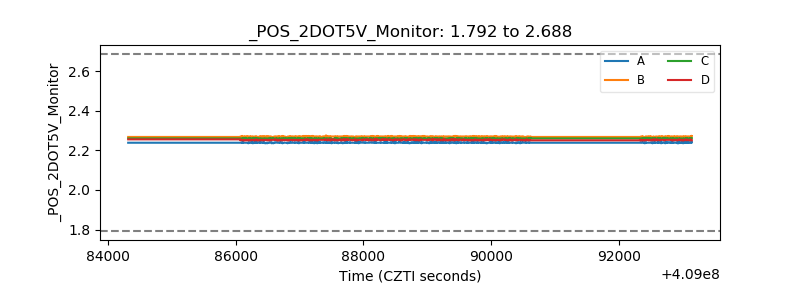 |
| +5 Volts monitor | 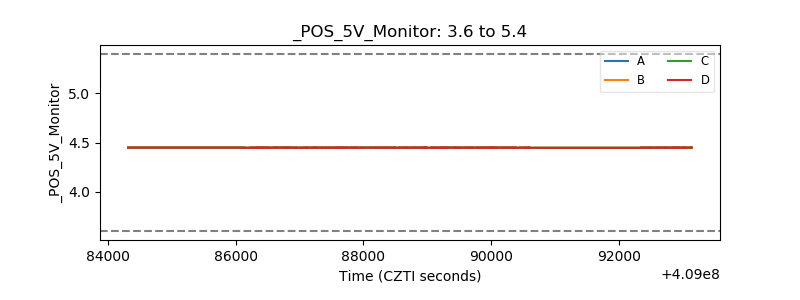 |
| _ROLL_ROT | 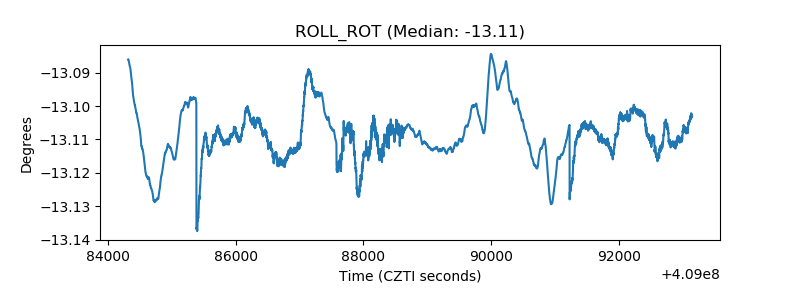 |
| _Roll_DEC | 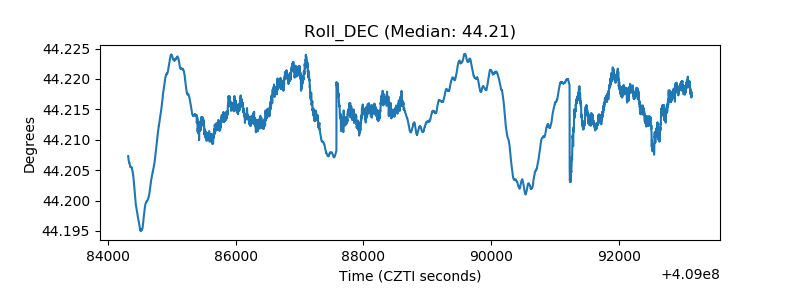 |
| _Roll_RA | 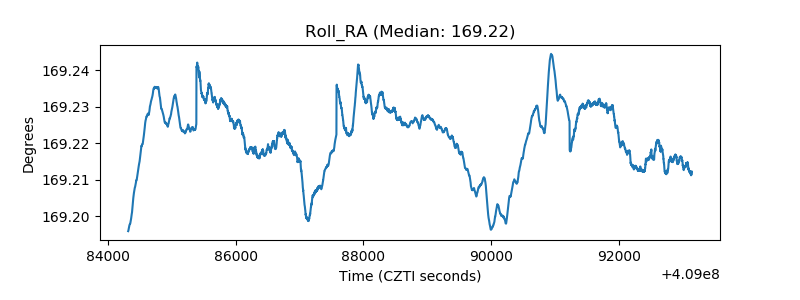 |
| Veto Counter | 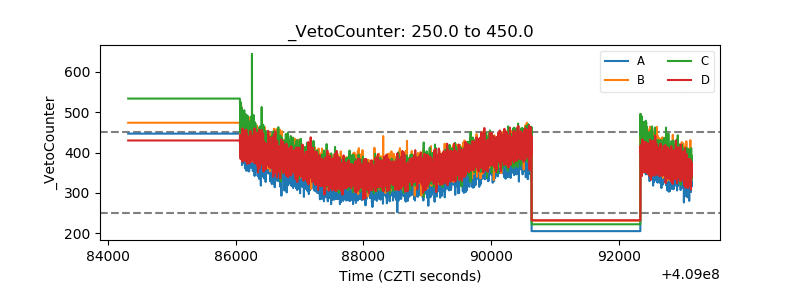 |