| Param | Original file | Final file |
|---|---|---|
| Filename | modeM0/AS1A12_077T06_9000005430_39060cztM0_level2.fits | modeM0/AS1A12_077T06_9000005430_39060cztM0_level2_quad_clean.evt |
| Size (bytes) | 418,887,360 | 103,901,760 |
| Size | 399.5 MB | 99.1 MB |
| Events in quadrant A | 4,821,875 | 700,788 |
| Events in quadrant B | 2,784,884 | 718,206 |
| Events in quadrant C | 4,128,466 | 663,368 |
| Events in quadrant D | 3,288,329 | 630,583 |
| Mode M9 | |||
|---|---|---|---|
| Quadrant | BADHDUFLAG | Total packets | Discarded packets |
| A | 0 | 31 | 0 |
| B | 0 | 31 | 0 |
| C | 0 | 31 | 0 |
| D | 0 | 31 | 0 |
| Mode M0 | |||
|---|---|---|---|
| Quadrant | BADHDUFLAG | Total packets | Discarded packets |
| A | 0 | 18768 | 3 |
| B | 0 | 12554 | 2 |
| C | 0 | 16413 | 2 |
| D | 0 | 14356 | 2 |
| Mode SS | |||
|---|---|---|---|
| Quadrant | BADHDUFLAG | Total packets | Discarded packets |
| A | 0 | 128 | 0 |
| B | 0 | 128 | 0 |
| C | 0 | 128 | 0 |
| D | 0 | 128 | 0 |
| Quadrant | Total seconds | Saturated seconds | Saturation percentage |
|---|---|---|---|
| A | 6204 | 42 | 0.676983% |
| B | 6204 | 8 | 0.128949% |
| C | 6204 | 308 | 4.964539% |
| D | 6204 | 113 | 1.821406% |
Noise dominated data is calculated using 1-second bins in cleaned event files. If a bin has >2000 counts, and if more than 50% of those come from <1% of pixels, then it is considered to be noise-dominated and hence unusable.
| Quadrant | # 1 sec bins | Bins with >0 counts | Bins with >2000 counts | High rate bins dominated by noise | Noise dominated (total time) | Noise dominated (detector-on time) | Marked lightcurve |
|---|---|---|---|---|---|---|---|
| A | 9310 | 6206 | 22 | 22 | 0.24% | 0.35% | 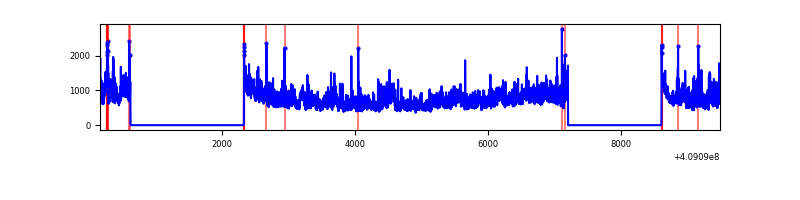 |
| B | 9310 | 6206 | 0 | 0 | 0.00% | 0.00% | 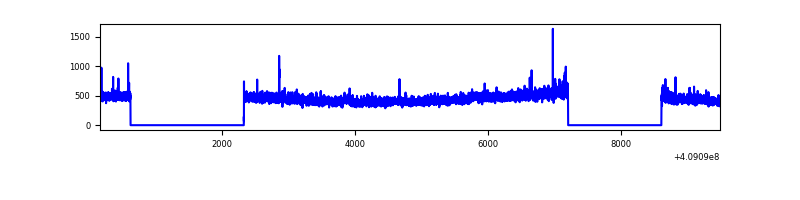 |
| C | 9310 | 6206 | 211 | 211 | 2.27% | 3.40% | 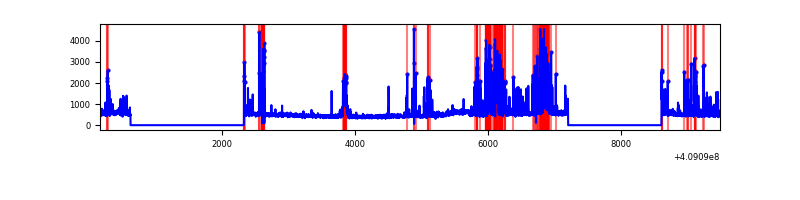 |
| D | 9310 | 6206 | 93 | 93 | 1.00% | 1.50% | 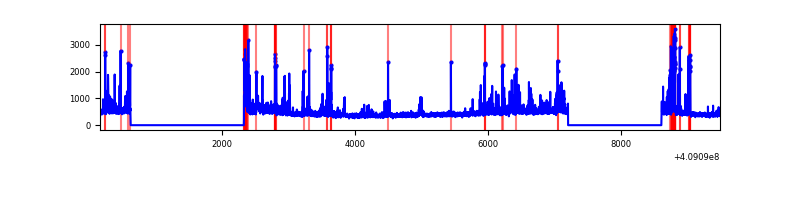 |
Top three noisy pixels from each quadrant. If the there are fewer than three noisy pixels in the level2.evt file, extra rows are filled as -1
| Pixel properties | Quadrant properties | ||||||
|---|---|---|---|---|---|---|---|
| Quadrant | DetID | PixID | Counts | Sigma | Mean | Median | Sigma |
| A | 15 | 222 | 1582515 | 11327.24 | 687 | 671 | 139.6 |
| A | 10 | 83 | 463119 | 3311.49 | 687 | 671 | 139.6 |
| A | 13 | 248 | 84384 | 599.45 | 687 | 671 | 139.6 |
| B | 0 | 190 | 20351 | 147.5 | 687 | 666 | 133.5 |
| B | 0 | 230 | 19870 | 143.89 | 687 | 666 | 133.5 |
| B | 12 | 111 | 16671 | 119.92 | 687 | 666 | 133.5 |
| C | 15 | 208 | 1208251 | 7909.91 | 658 | 662 | 152.7 |
| C | 15 | 214 | 251995 | 1646.27 | 658 | 662 | 152.7 |
| C | 1 | 23 | 78138 | 507.48 | 658 | 662 | 152.7 |
| D | 2 | 249 | 306707 | 1865.08 | 668 | 648 | 164.1 |
| D | 1 | 47 | 253813 | 1542.75 | 668 | 648 | 164.1 |
| D | 2 | 250 | 37744 | 226.06 | 668 | 648 | 164.1 |
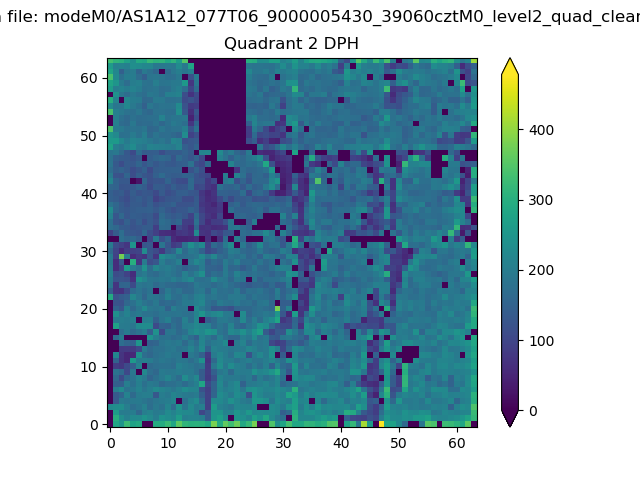
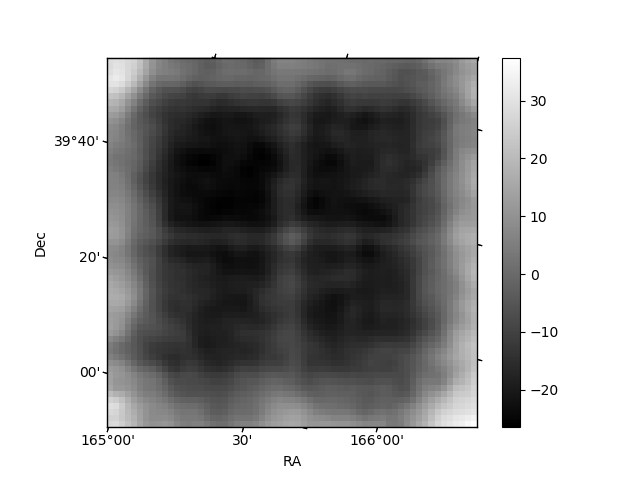
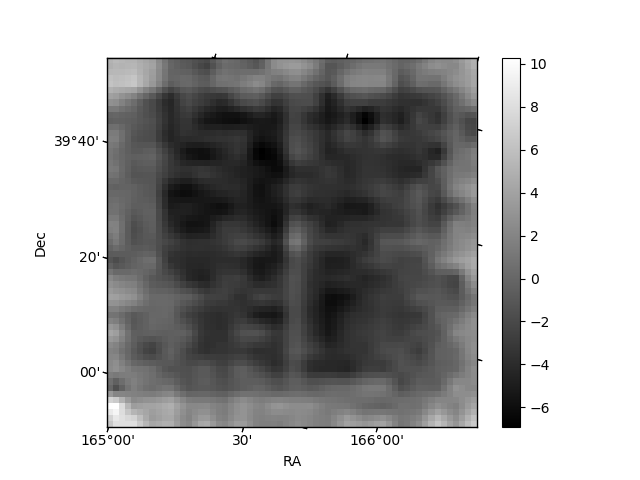
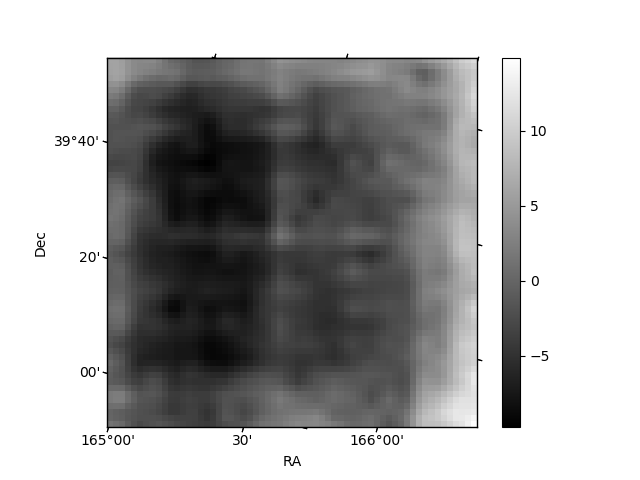
Histogram calculated using DETX and DETY for each event in the final _common_clean file
| Quadrant A | 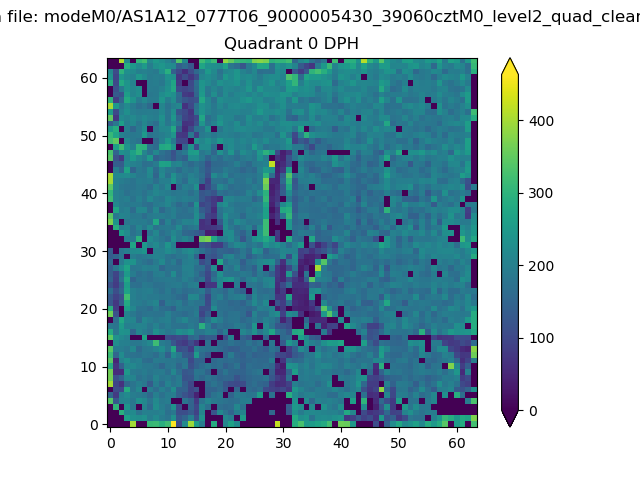 |
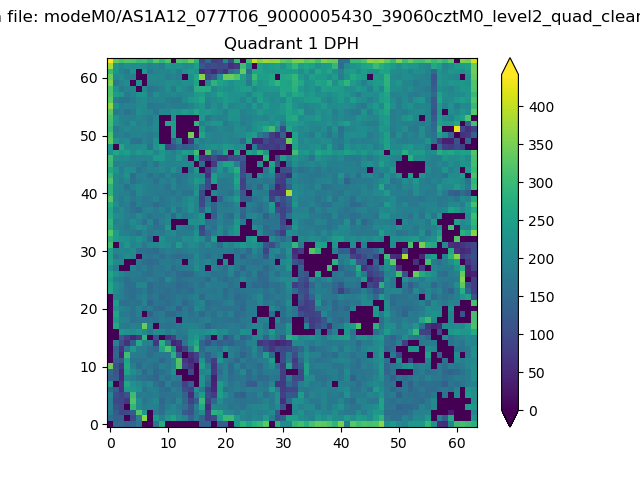 |
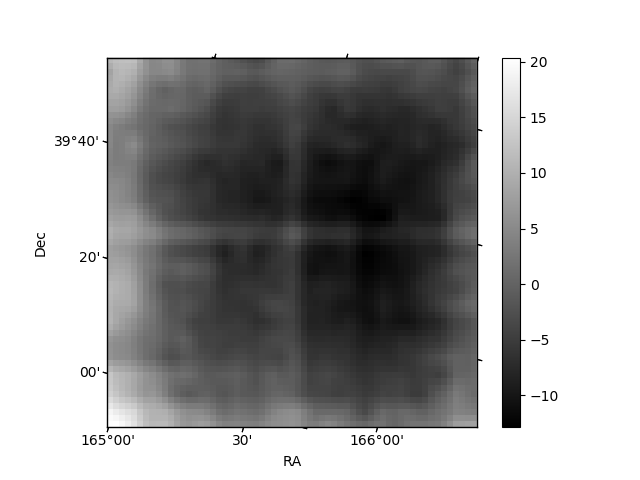
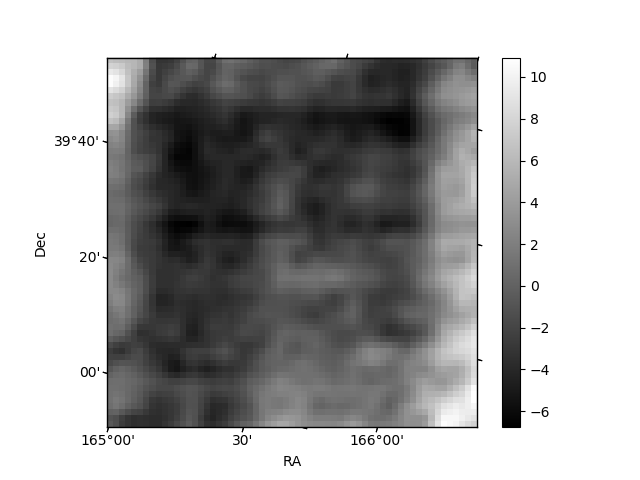
Quadrant B |
|---|---|---|---|
| Quadrant D | 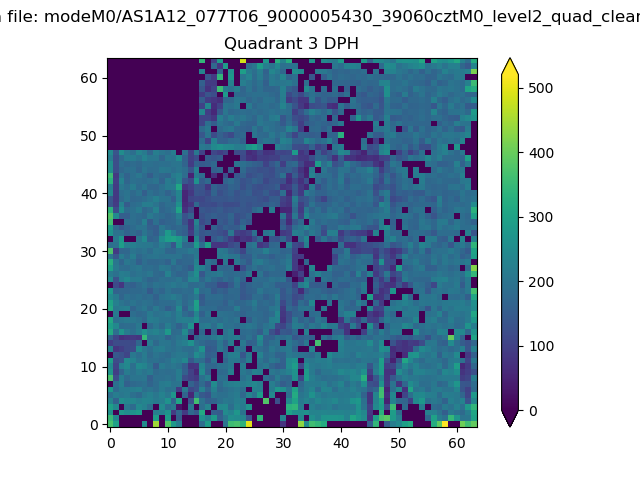 |
 |
Quadrant C |
| Plot type | Count rate plots | Images |
|---|---|---|
| Comparison with Poisson distribution Blue bars denote a histogram of data divided into 1 sec bins. Red curve is a Poisson curve with rate = median count rate of data. |
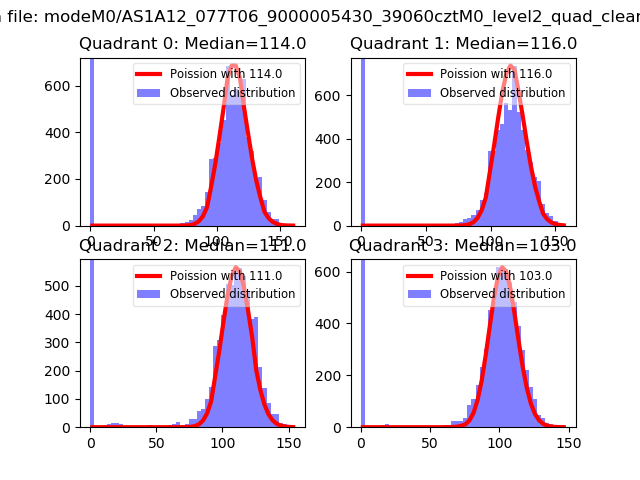 |
 |
| Quadrant-wise count rates Data is divided into 100 sec bins |
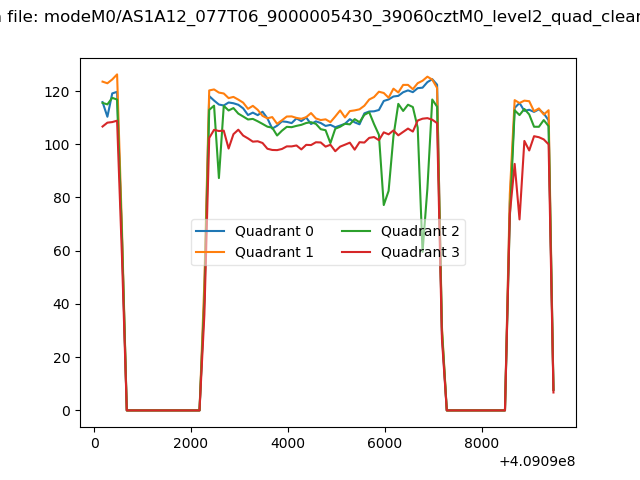 |
|
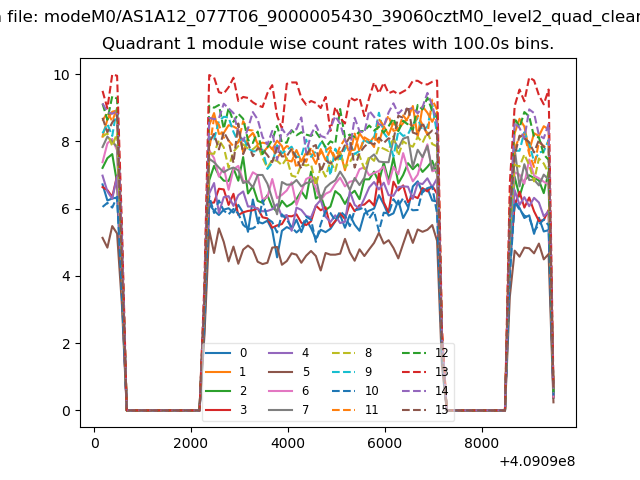
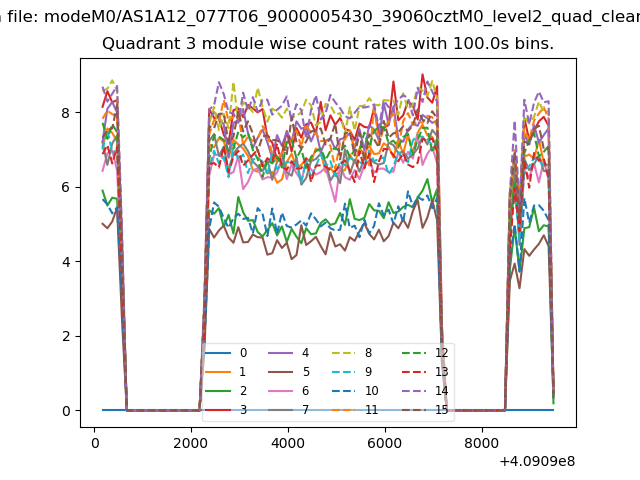
| Module-wise count rates for Quadrant A Data is divided into 100 sec bins |
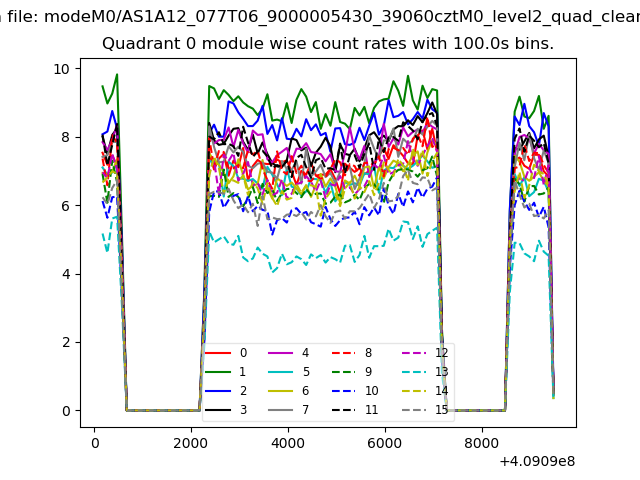 |
 |
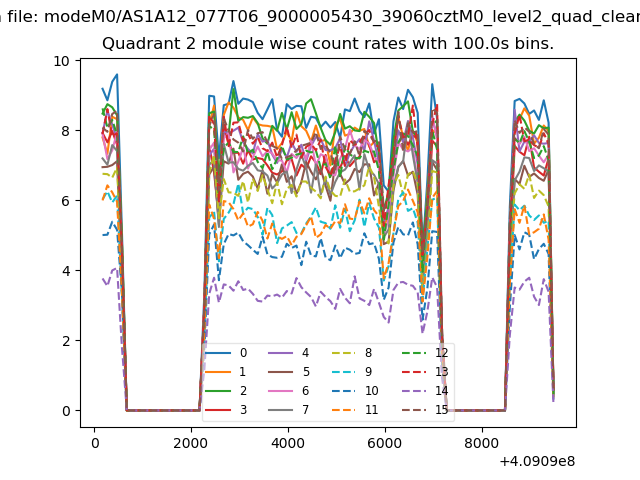
| Module-wise count rates for Quadrant B Data is divided into 100 sec bins |
 |
 |
| Module-wise count rates for Quadrant C Data is divided into 100 sec bins |
 |
 |
| Module-wise count rates for Quadrant D Data is divided into 100 sec bins |
 |
 |
| Parameter | Plot |
|---|---|
| CZT HV Monitor | 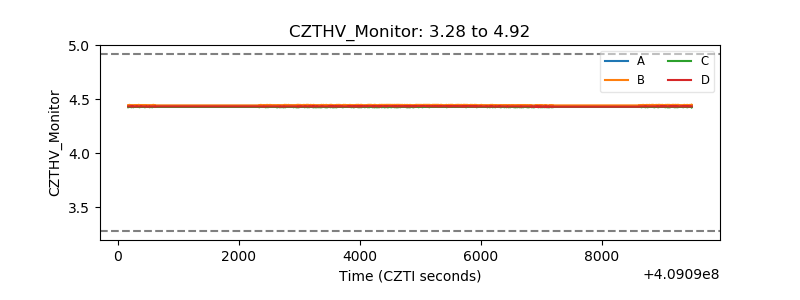 |
| D_VDD | 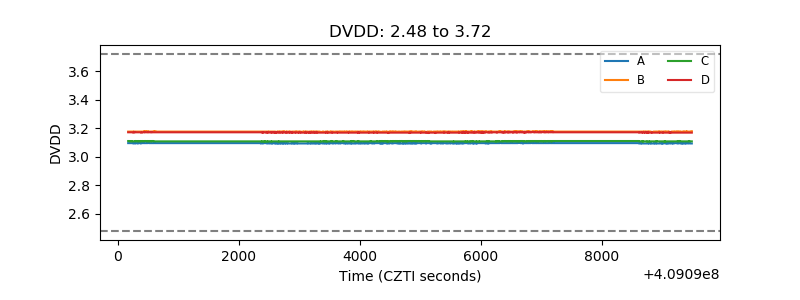 |
| Temperature 1 | 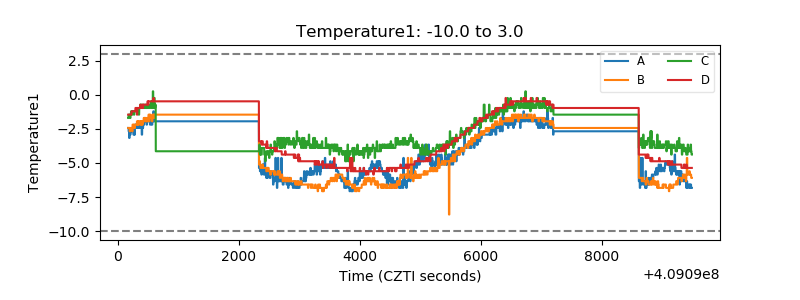 |
| Veto HV Monitor | 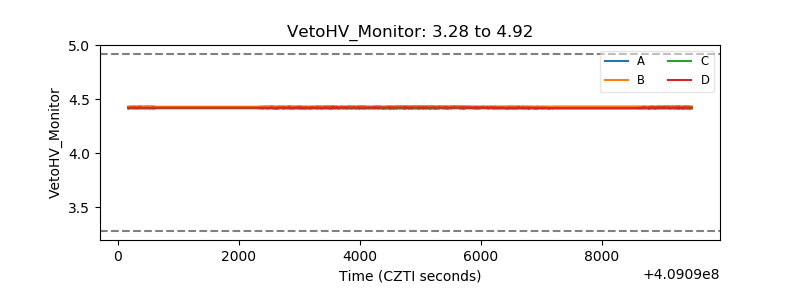 |
| Veto LLD | 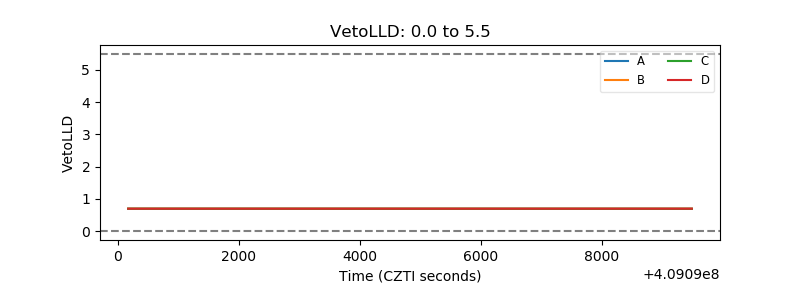 |
| Alpha Counter | 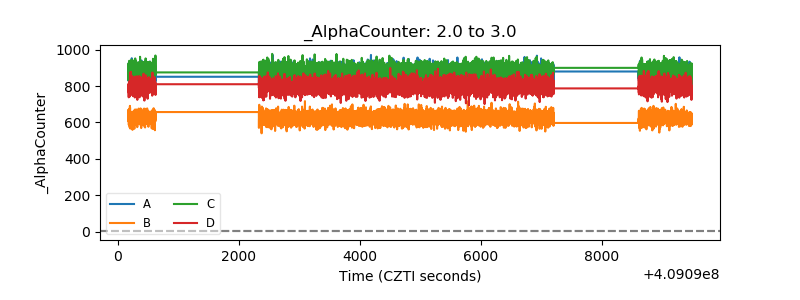 |
| _CPM_Rate | 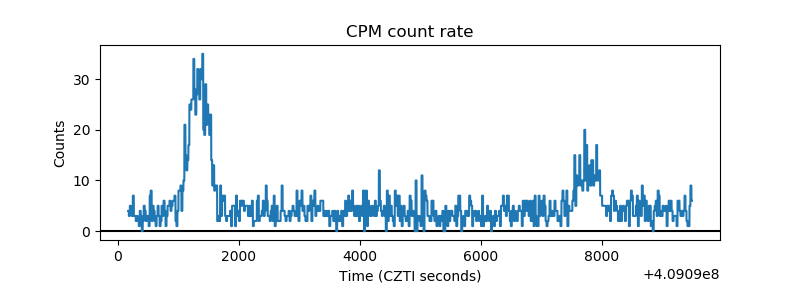 |
| CZT Counter | 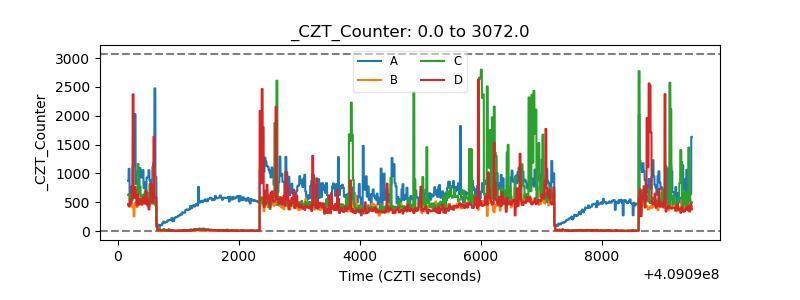 |
| +2.5 Volts monitor | 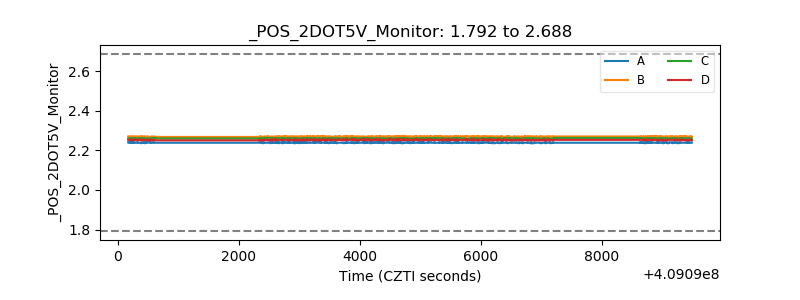 |
| +5 Volts monitor |  |
| _ROLL_ROT | 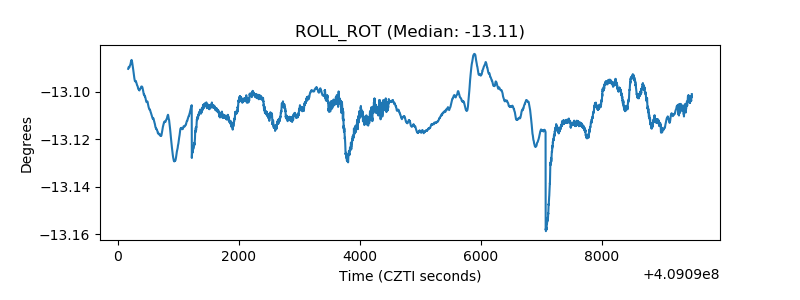 |
| _Roll_DEC | 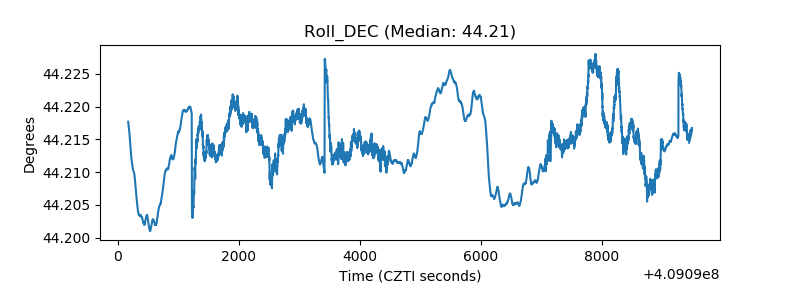 |
| _Roll_RA | 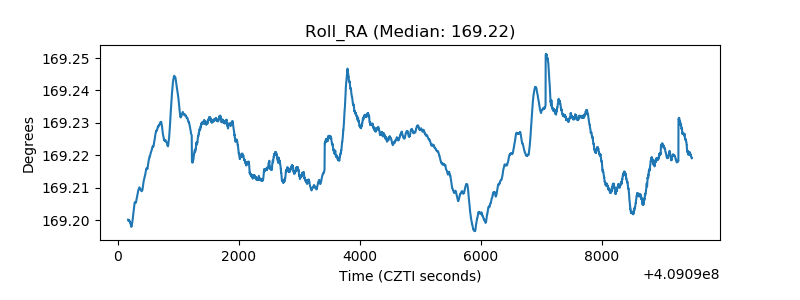 |
| Veto Counter | 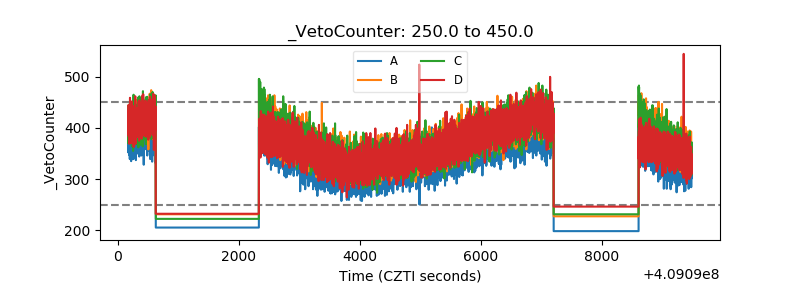 |