| Param | Original file | Final file |
|---|---|---|
| Filename | modeM0/AS1A12_077T06_9000005430_39061cztM0_level2.fits | modeM0/AS1A12_077T06_9000005430_39061cztM0_level2_quad_clean.evt |
| Size (bytes) | 439,349,760 | 97,519,680 |
| Size | 419.0 MB | 93.0 MB |
| Events in quadrant A | 4,641,955 | 644,424 |
| Events in quadrant B | 2,675,257 | 684,950 |
| Events in quadrant C | 5,396,144 | 600,698 |
| Events in quadrant D | 3,082,962 | 602,461 |
| Mode M9 | |||
|---|---|---|---|
| Quadrant | BADHDUFLAG | Total packets | Discarded packets |
| A | 0 | 22 | 0 |
| B | 0 | 22 | 0 |
| C | 0 | 22 | 0 |
| D | 0 | 23 | 0 |
| Mode M0 | |||
|---|---|---|---|
| Quadrant | BADHDUFLAG | Total packets | Discarded packets |
| A | 0 | 17856 | 3 |
| B | 0 | 12253 | 2 |
| C | 0 | 20121 | 2 |
| D | 0 | 13573 | 2 |
| Mode SS | |||
|---|---|---|---|
| Quadrant | BADHDUFLAG | Total packets | Discarded packets |
| A | 0 | 124 | 0 |
| B | 0 | 124 | 0 |
| C | 0 | 124 | 0 |
| D | 0 | 124 | 0 |
| Quadrant | Total seconds | Saturated seconds | Saturation percentage |
|---|---|---|---|
| A | 6009 | 336 | 5.591613% |
| B | 6009 | 12 | 0.199700% |
| C | 6009 | 606 | 10.084873% |
| D | 6009 | 85 | 1.414545% |
Noise dominated data is calculated using 1-second bins in cleaned event files. If a bin has >2000 counts, and if more than 50% of those come from <1% of pixels, then it is considered to be noise-dominated and hence unusable.
| Quadrant | # 1 sec bins | Bins with >0 counts | Bins with >2000 counts | High rate bins dominated by noise | Noise dominated (total time) | Noise dominated (detector-on time) | Marked lightcurve |
|---|---|---|---|---|---|---|---|
| A | 7322 | 6010 | 222 | 222 | 3.03% | 3.69% | 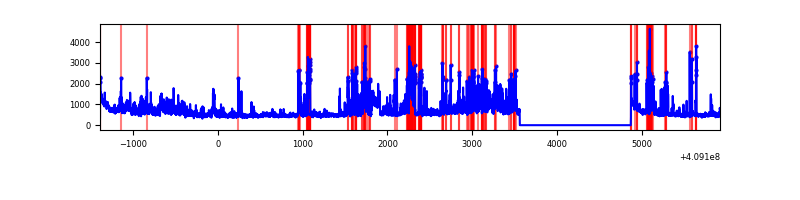 |
| B | 7322 | 6010 | 5 | 5 | 0.07% | 0.08% | 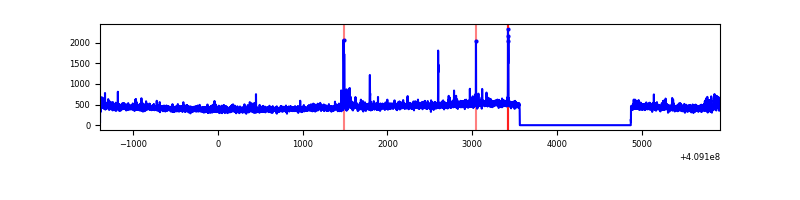 |
| C | 7322 | 6010 | 495 | 495 | 6.76% | 8.24% | 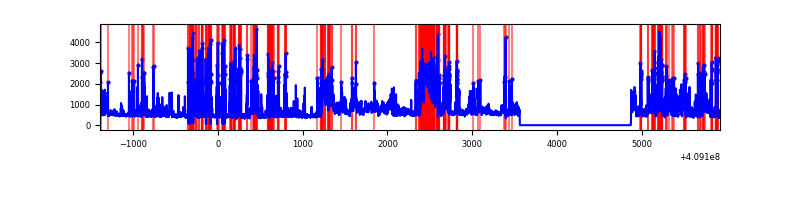 |
| D | 7322 | 6010 | 64 | 64 | 0.87% | 1.06% | 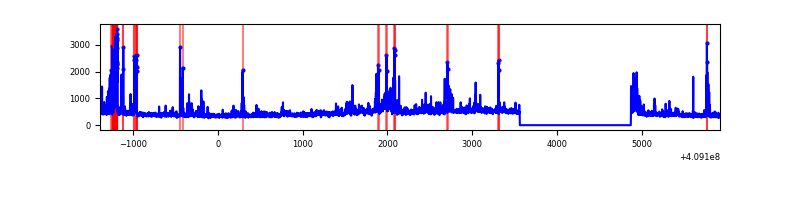 |
Top three noisy pixels from each quadrant. If the there are fewer than three noisy pixels in the level2.evt file, extra rows are filled as -1
| Pixel properties | Quadrant properties | ||||||
|---|---|---|---|---|---|---|---|
| Quadrant | DetID | PixID | Counts | Sigma | Mean | Median | Sigma |
| A | 15 | 222 | 1614740 | 12447.55 | 642 | 628 | 129.7 |
| A | 10 | 83 | 440969 | 3395.78 | 642 | 628 | 129.7 |
| A | 13 | 248 | 53261 | 405.89 | 642 | 628 | 129.7 |
| B | 5 | 184 | 35872 | 279.27 | 653 | 635 | 126.2 |
| B | 0 | 213 | 30455 | 236.34 | 653 | 635 | 126.2 |
| B | 15 | 85 | 21195 | 162.95 | 653 | 635 | 126.2 |
| C | 15 | 208 | 2776795 | 19601.87 | 603 | 608 | 141.6 |
| C | 15 | 214 | 239617 | 1687.58 | 603 | 608 | 141.6 |
| C | 3 | 233 | 16659 | 113.33 | 603 | 608 | 141.6 |
| D | 2 | 249 | 272506 | 1754.24 | 635 | 617 | 155.0 |
| D | 1 | 47 | 144452 | 928.03 | 635 | 617 | 155.0 |
| D | 12 | 227 | 123479 | 792.71 | 635 | 617 | 155.0 |
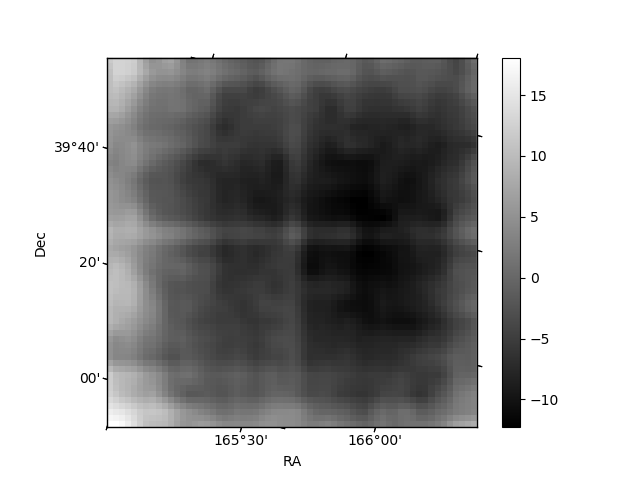
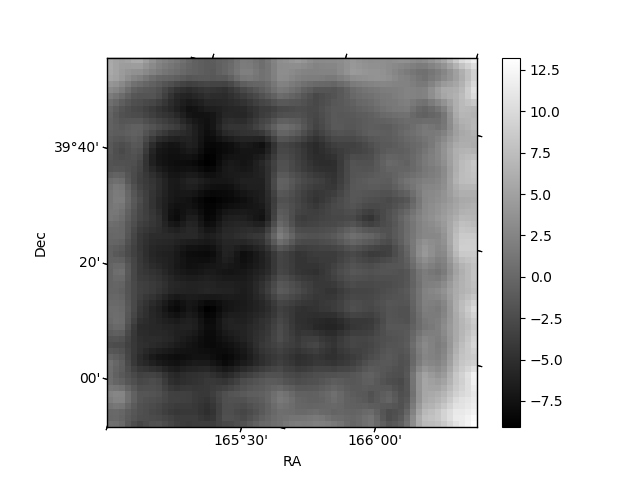
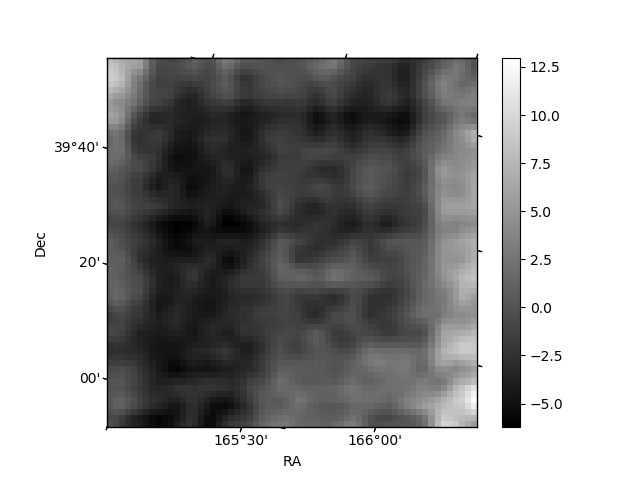
Histogram calculated using DETX and DETY for each event in the final _common_clean file
| Quadrant A | 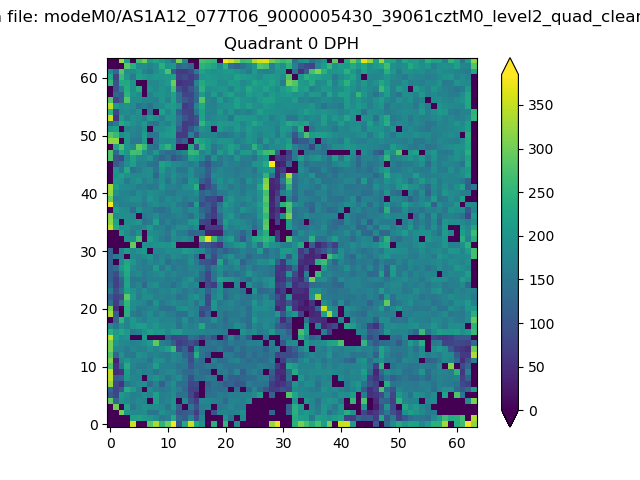 |
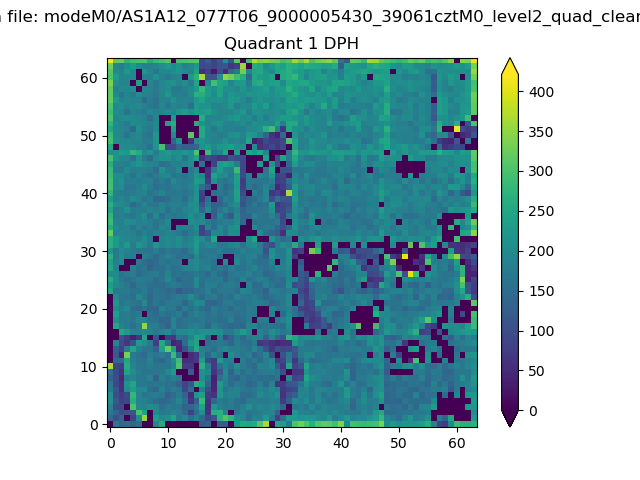 |
Quadrant B |
|---|---|---|---|
| Quadrant D | 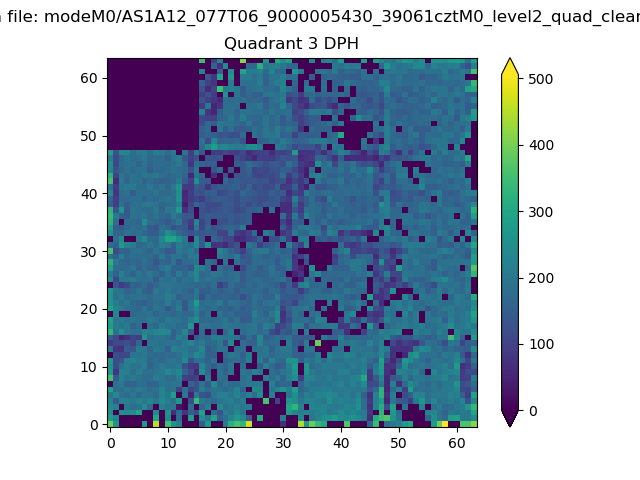 |
 |
Quadrant C |
| Plot type | Count rate plots | Images |
|---|---|---|
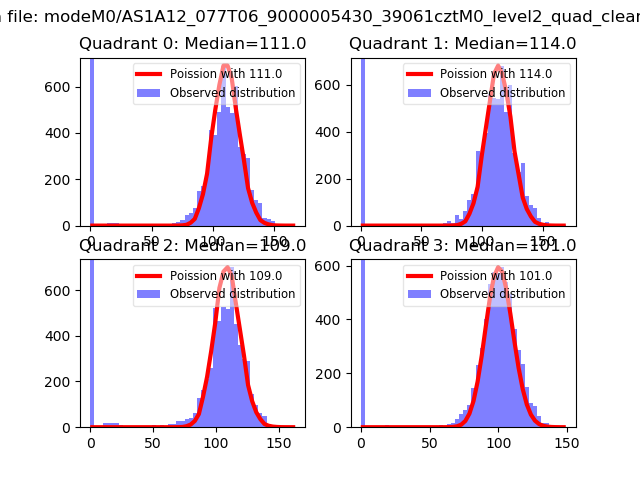
| Comparison with Poisson distribution Blue bars denote a histogram of data divided into 1 sec bins. Red curve is a Poisson curve with rate = median count rate of data. |
 |
 |
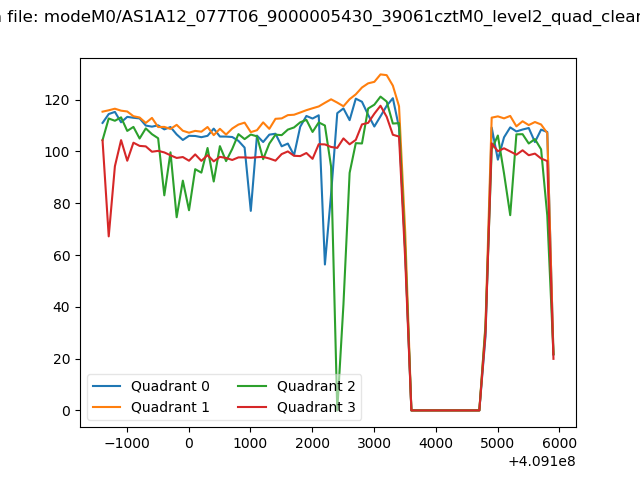
| Quadrant-wise count rates Data is divided into 100 sec bins |
 |
|
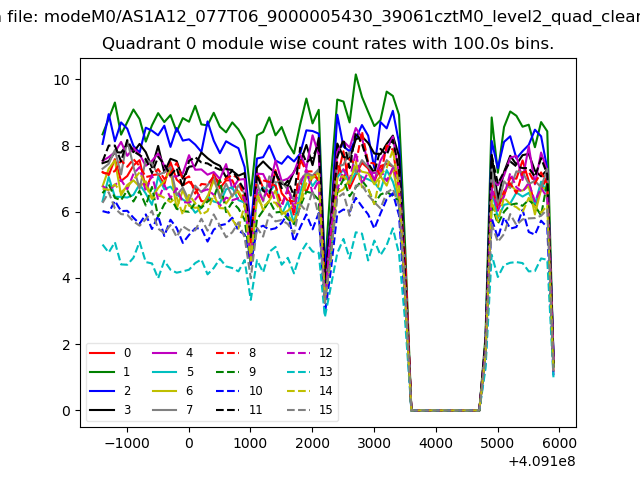
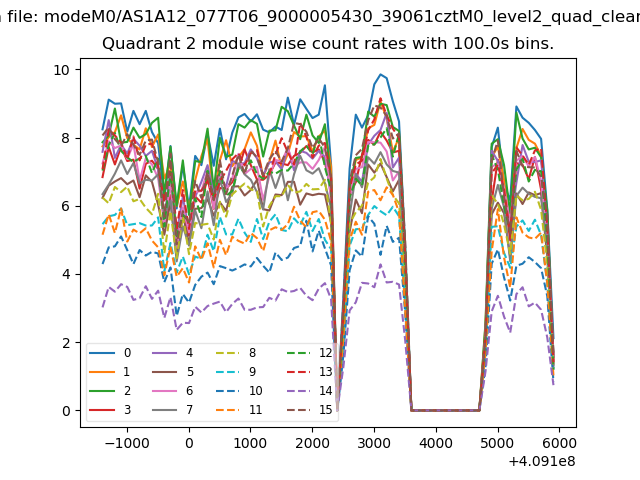
| Module-wise count rates for Quadrant A Data is divided into 100 sec bins |
 |
 |
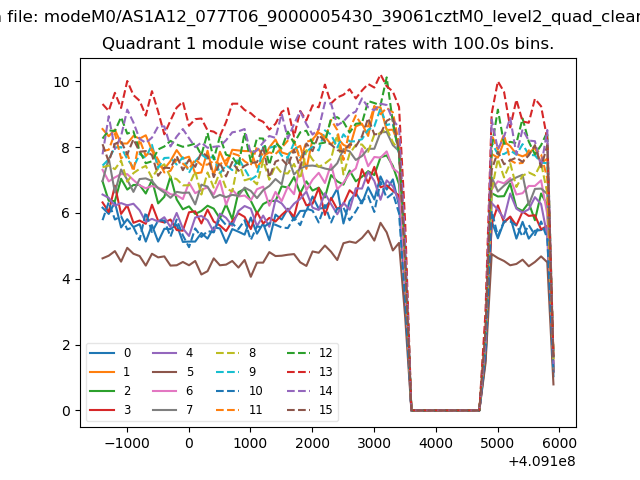
| Module-wise count rates for Quadrant B Data is divided into 100 sec bins |
 |
 |
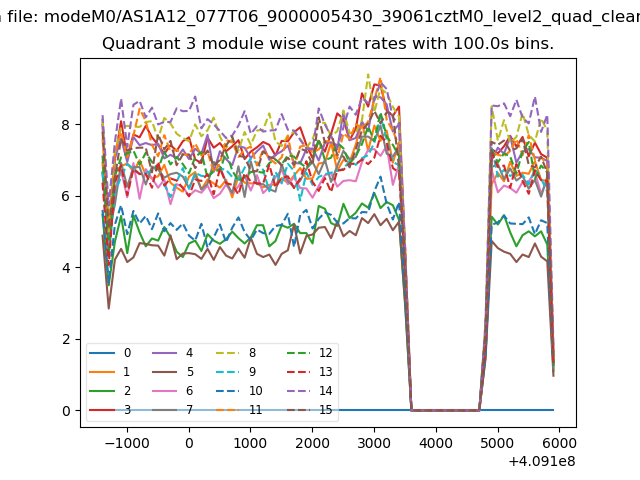
| Module-wise count rates for Quadrant C Data is divided into 100 sec bins |
 |
 |
| Module-wise count rates for Quadrant D Data is divided into 100 sec bins |
 |
 |
| Parameter | Plot |
|---|---|
| CZT HV Monitor | 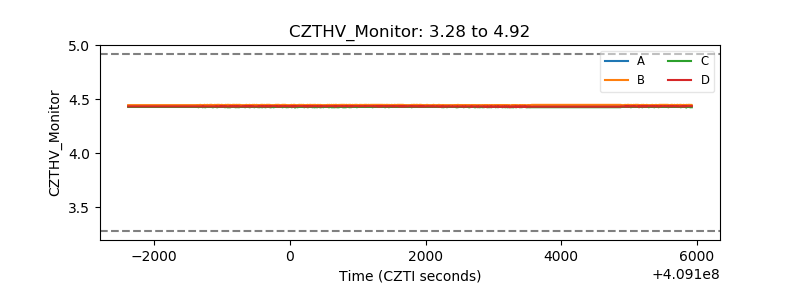 |
| D_VDD | 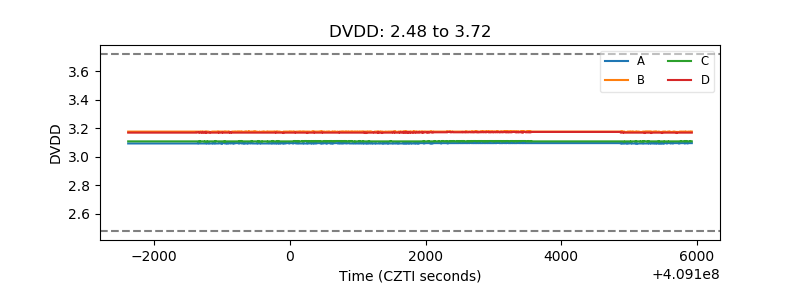 |
| Temperature 1 | 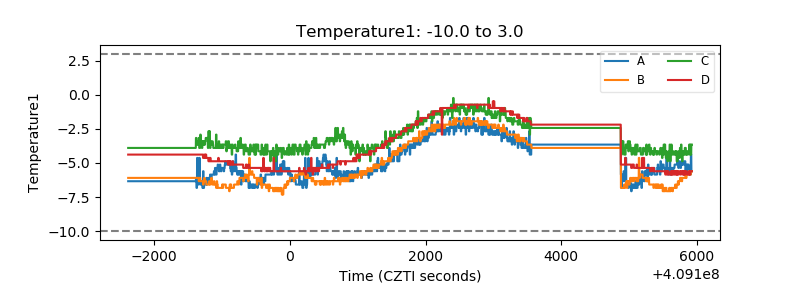 |
| Veto HV Monitor | 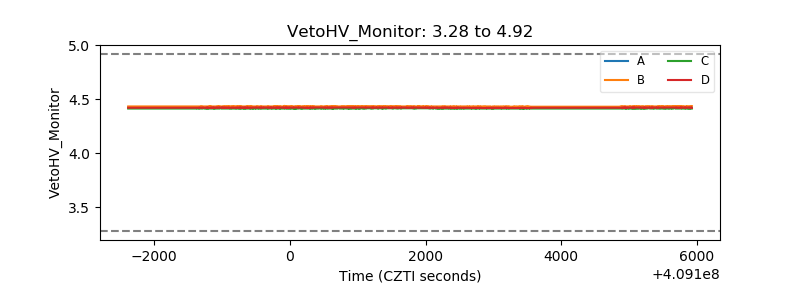 |
| Veto LLD | 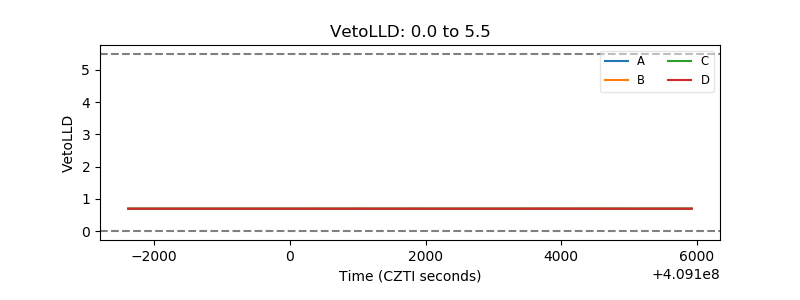 |
| Alpha Counter | 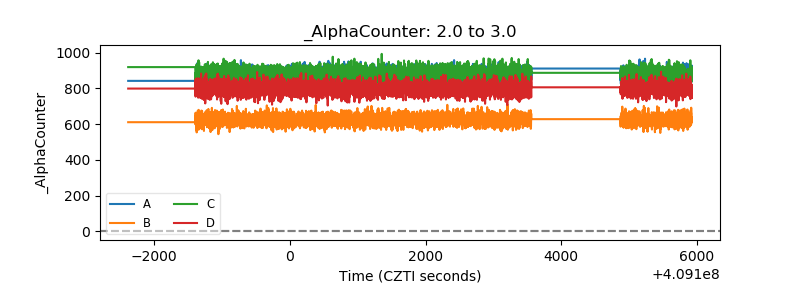 |
| _CPM_Rate | 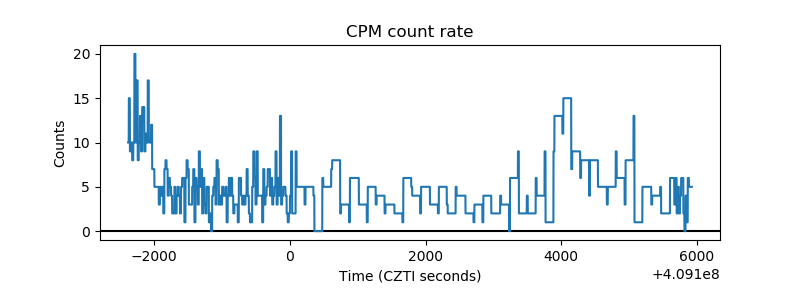 |
| CZT Counter |  |
| +2.5 Volts monitor | 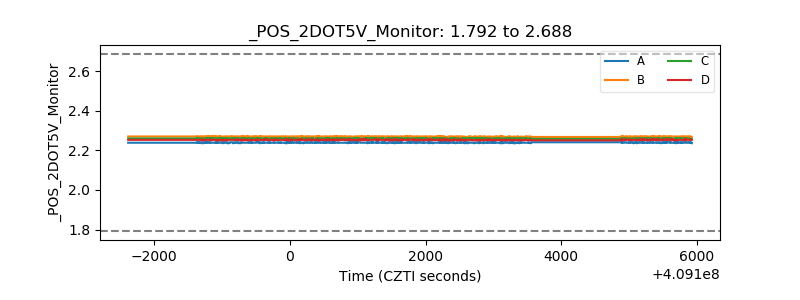 |
| +5 Volts monitor | 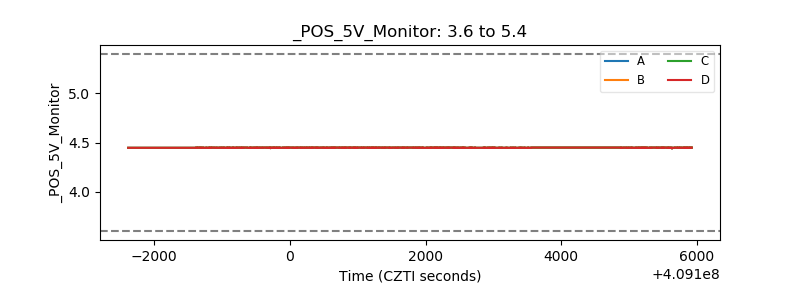 |
| _ROLL_ROT | 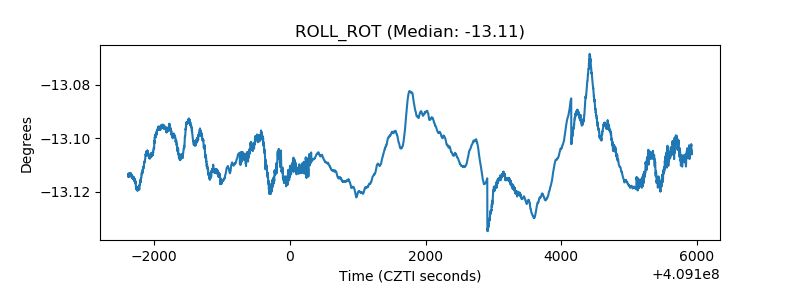 |
| _Roll_DEC | 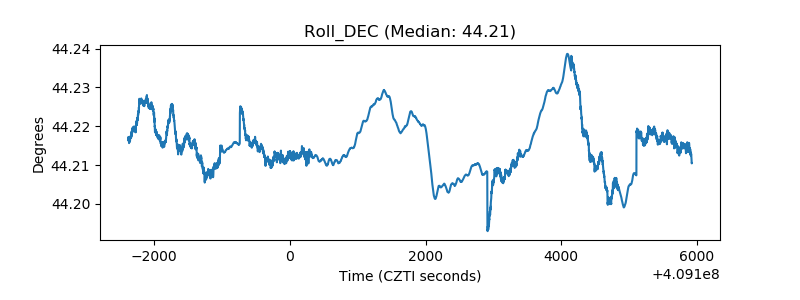 |
| _Roll_RA | 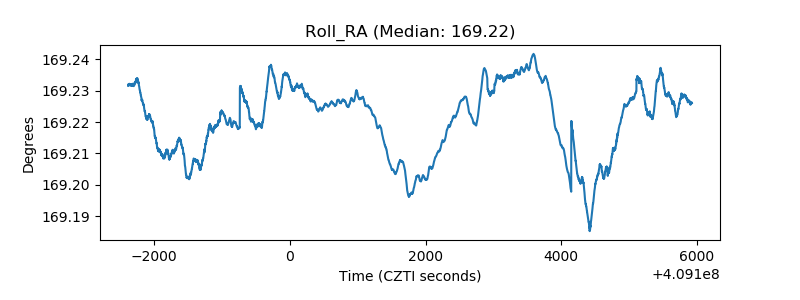 |
| Veto Counter | 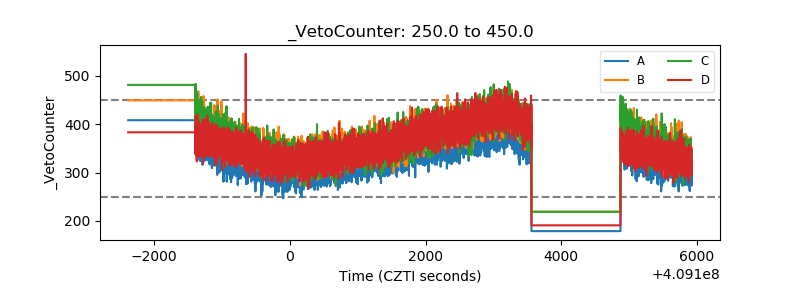 |