| Param | Original file | Final file |
|---|---|---|
| Filename | modeM0/AS1A12_077T06_9000005430_39064cztM0_level2.fits | modeM0/AS1A12_077T06_9000005430_39064cztM0_level2_quad_clean.evt |
| Size (bytes) | 1,461,245,760 | 329,008,320 |
| Size | 1.4 GB | 313.8 MB |
| Events in quadrant A | 13,598,689 | 2,173,588 |
| Events in quadrant B | 9,201,880 | 2,342,667 |
| Events in quadrant C | 15,937,735 | 2,084,701 |
| Events in quadrant D | 13,764,313 | 1,945,613 |
| Mode M9 | |||
|---|---|---|---|
| Quadrant | BADHDUFLAG | Total packets | Discarded packets |
| A | 0 | 65 | 0 |
| B | 0 | 65 | 0 |
| C | 0 | 65 | 0 |
| D | 0 | 66 | 0 |
| Mode M0 | |||
|---|---|---|---|
| Quadrant | BADHDUFLAG | Total packets | Discarded packets |
| A | 0 | 53783 | 5 |
| B | 0 | 41689 | 4 |
| C | 0 | 61122 | 4 |
| D | 0 | 55971 | 4 |
| Mode SS | |||
|---|---|---|---|
| Quadrant | BADHDUFLAG | Total packets | Discarded packets |
| A | 0 | 418 | 0 |
| B | 0 | 418 | 0 |
| C | 0 | 418 | 0 |
| D | 0 | 418 | 0 |
| Quadrant | Total seconds | Saturated seconds | Saturation percentage |
|---|---|---|---|
| A | 20544 | 593 | 2.886488% |
| B | 20544 | 30 | 0.146028% |
| C | 20544 | 1254 | 6.103972% |
| D | 20544 | 827 | 4.025506% |
Noise dominated data is calculated using 1-second bins in cleaned event files. If a bin has >2000 counts, and if more than 50% of those come from <1% of pixels, then it is considered to be noise-dominated and hence unusable.
| Quadrant | # 1 sec bins | Bins with >0 counts | Bins with >2000 counts | High rate bins dominated by noise | Noise dominated (total time) | Noise dominated (detector-on time) | Marked lightcurve |
|---|---|---|---|---|---|---|---|
| A | 26066 | 20548 | 381 | 381 | 1.46% | 1.85% | 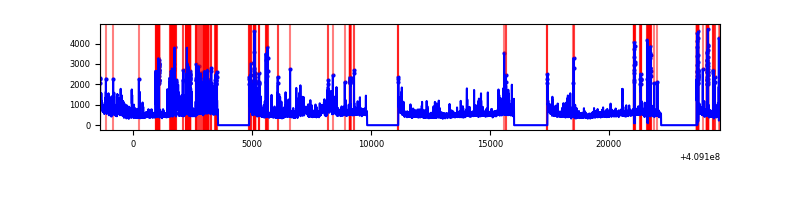 |
| B | 26066 | 20548 | 8 | 8 | 0.03% | 0.04% | 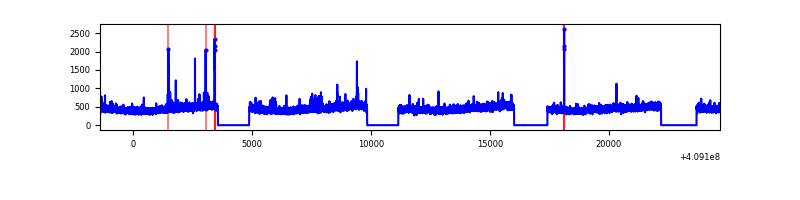 |
| C | 26066 | 20548 | 1032 | 1032 | 3.96% | 5.02% | 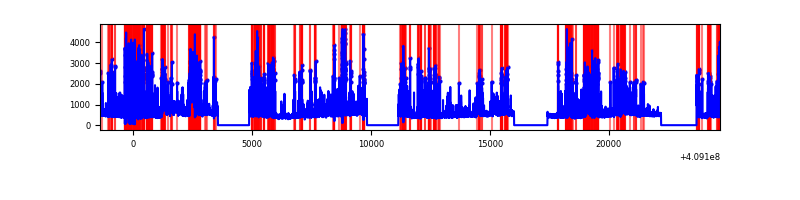 |
| D | 26066 | 20548 | 699 | 699 | 2.68% | 3.40% | 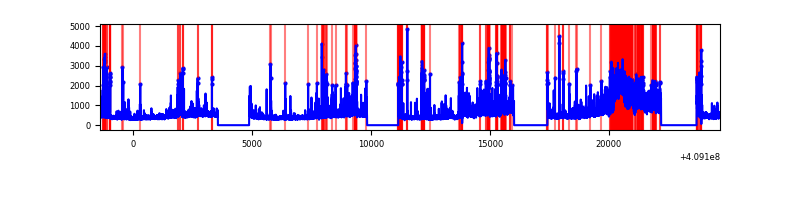 |
Top three noisy pixels from each quadrant. If the there are fewer than three noisy pixels in the level2.evt file, extra rows are filled as -1
| Pixel properties | Quadrant properties | ||||||
|---|---|---|---|---|---|---|---|
| Quadrant | DetID | PixID | Counts | Sigma | Mean | Median | Sigma |
| A | 15 | 222 | 3318611 | 7399.18 | 2237 | 2194 | 448.2 |
| A | 10 | 83 | 1358549 | 3026.13 | 2237 | 2194 | 448.2 |
| A | 13 | 248 | 170450 | 375.39 | 2237 | 2194 | 448.2 |
| B | 0 | 230 | 116567 | 266.39 | 2251 | 2188 | 429.4 |
| B | 0 | 213 | 80573 | 182.56 | 2251 | 2188 | 429.4 |
| B | 12 | 111 | 55357 | 123.83 | 2251 | 2188 | 429.4 |
| C | 15 | 208 | 6611303 | 13345.89 | 2137 | 2149 | 495.2 |
| C | 15 | 214 | 830729 | 1673.15 | 2137 | 2149 | 495.2 |
| C | 15 | 159 | 107853 | 213.45 | 2137 | 2149 | 495.2 |
| D | 12 | 235 | 3242522 | 6140.4 | 2182 | 2125 | 527.7 |
| D | 2 | 249 | 813113 | 1536.78 | 2182 | 2125 | 527.7 |
| D | 12 | 227 | 334664 | 630.15 | 2182 | 2125 | 527.7 |
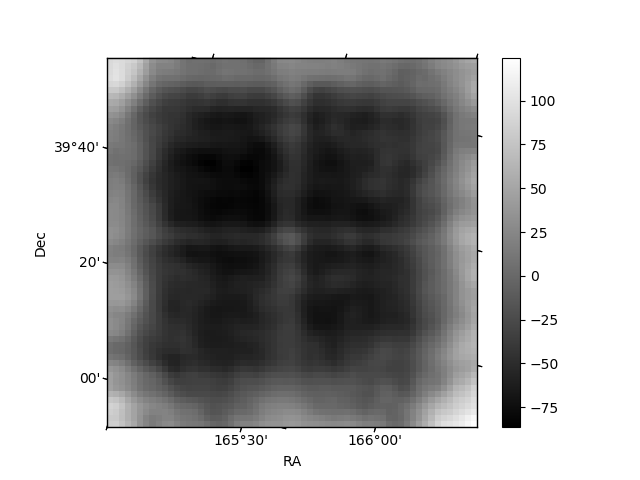
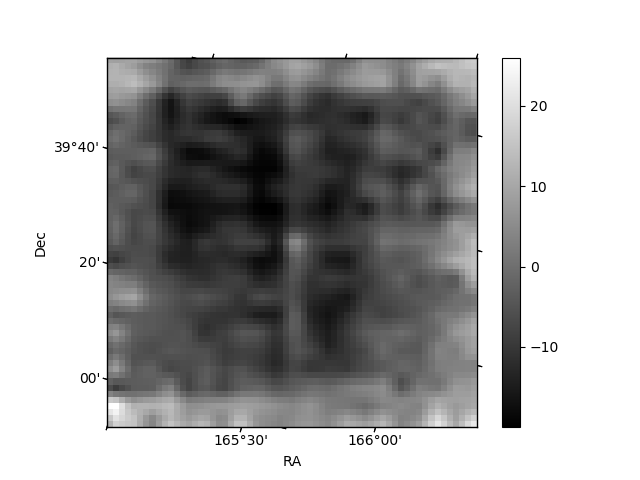
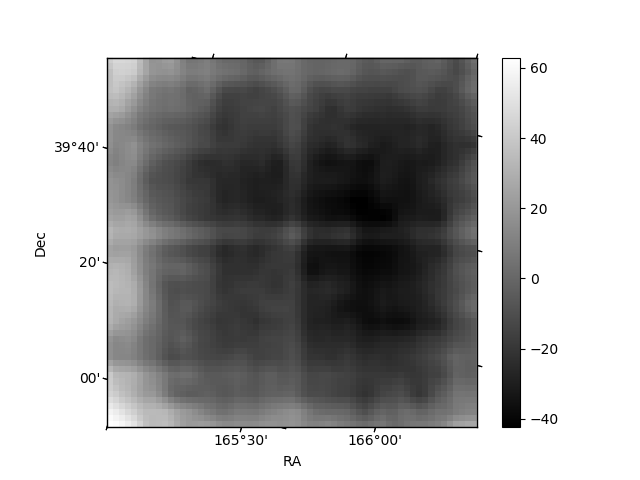
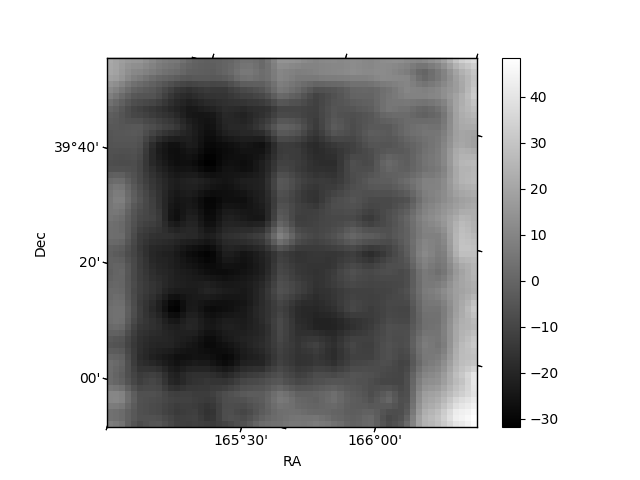
Histogram calculated using DETX and DETY for each event in the final _common_clean file
| Quadrant A | 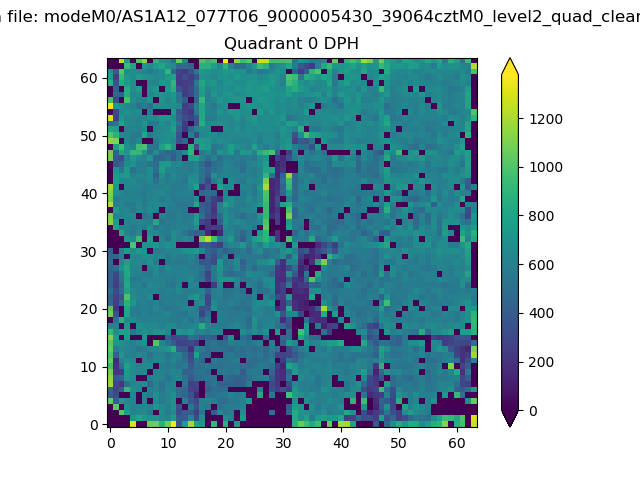 |
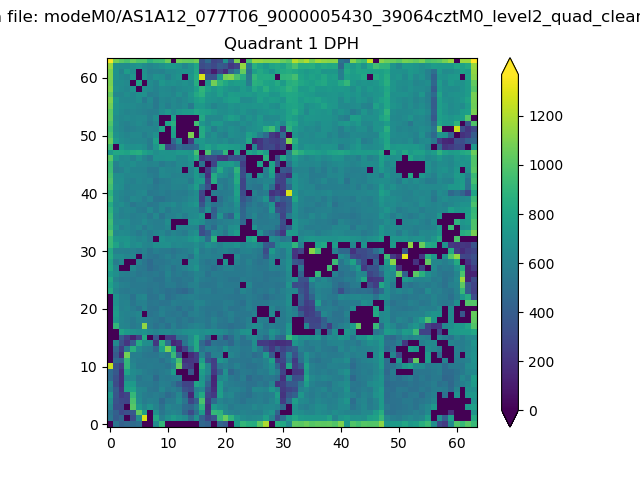 |
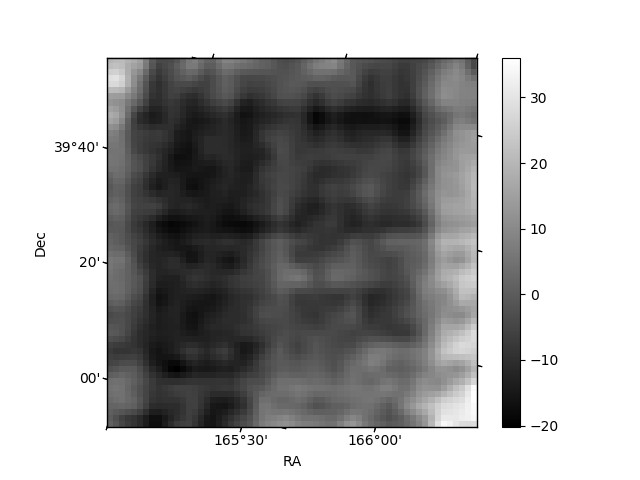
Quadrant B |
|---|---|---|---|
| Quadrant D | 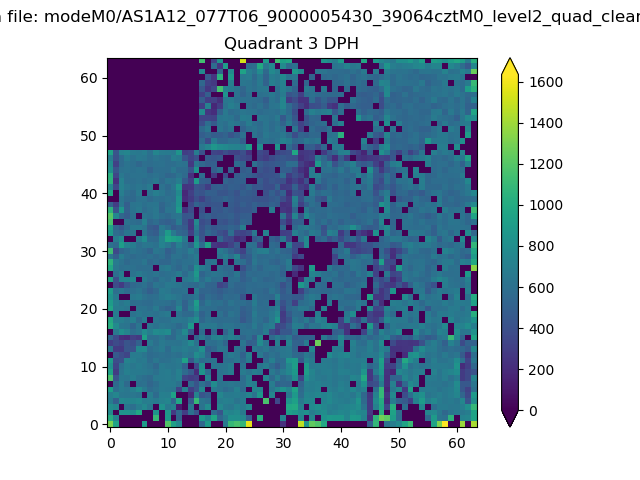 |
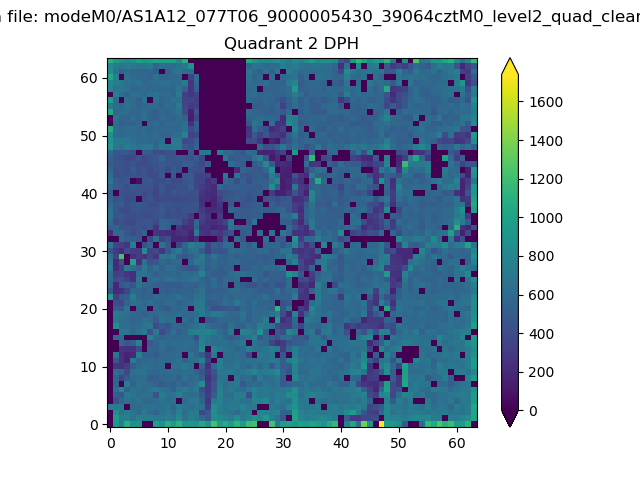 |
Quadrant C |
| Plot type | Count rate plots | Images |
|---|---|---|
| Comparison with Poisson distribution Blue bars denote a histogram of data divided into 1 sec bins. Red curve is a Poisson curve with rate = median count rate of data. |
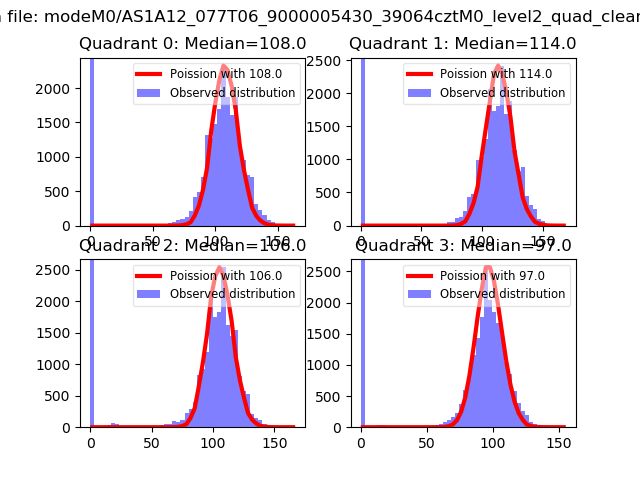 |
 |
| Quadrant-wise count rates Data is divided into 100 sec bins |
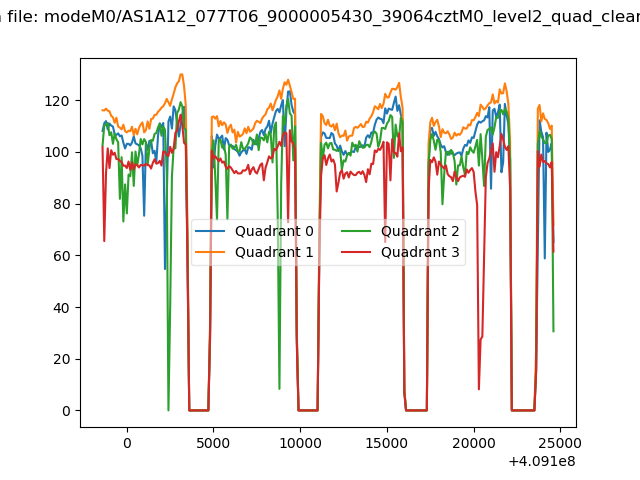 |
|
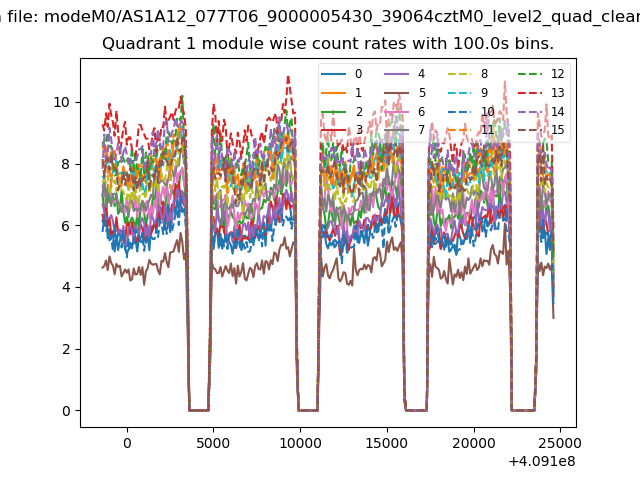
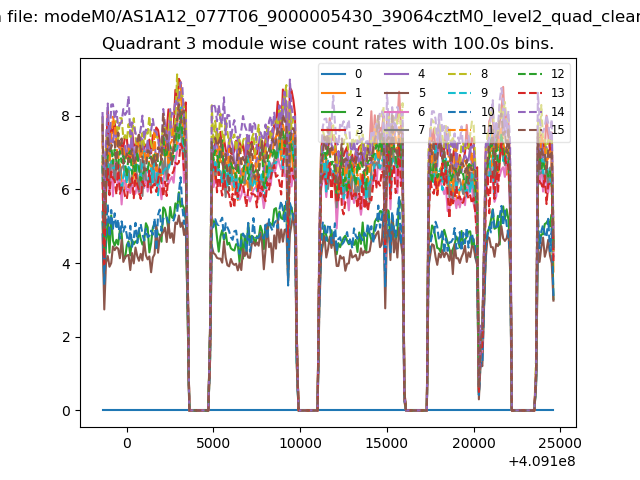
| Module-wise count rates for Quadrant A Data is divided into 100 sec bins |
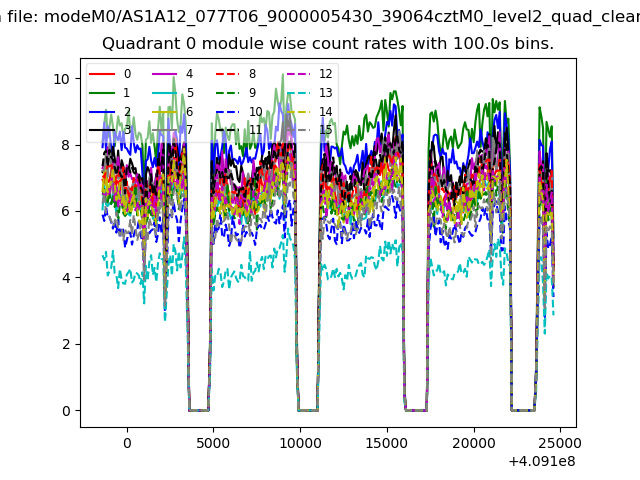 |
 |
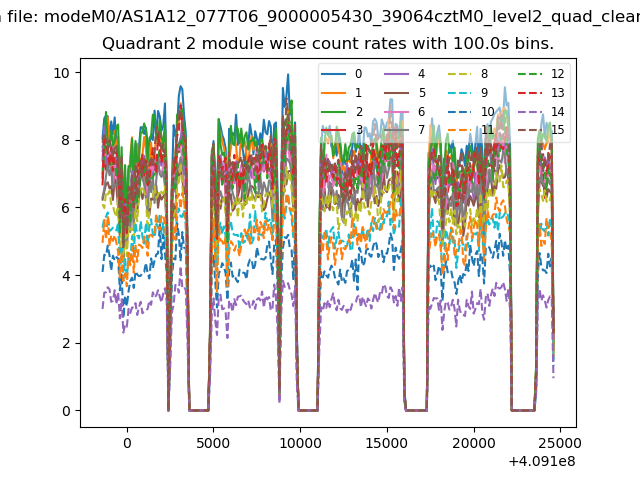
| Module-wise count rates for Quadrant B Data is divided into 100 sec bins |
 |
 |
| Module-wise count rates for Quadrant C Data is divided into 100 sec bins |
 |
 |
| Module-wise count rates for Quadrant D Data is divided into 100 sec bins |
 |
 |
| Parameter | Plot |
|---|---|
| CZT HV Monitor | 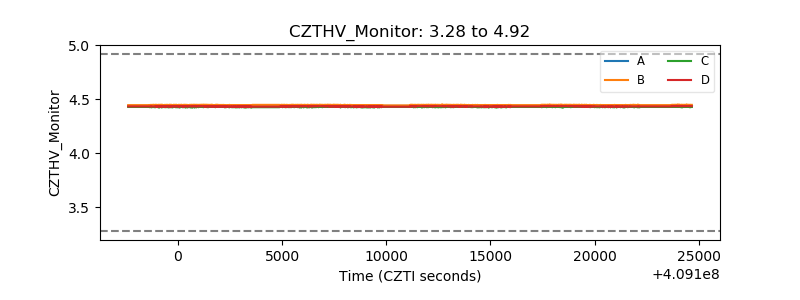 |
| D_VDD | 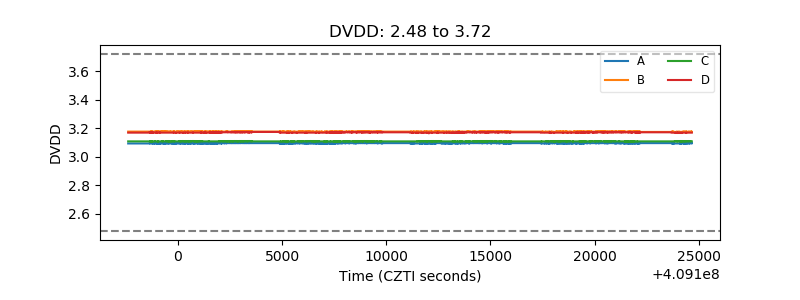 |
| Temperature 1 | 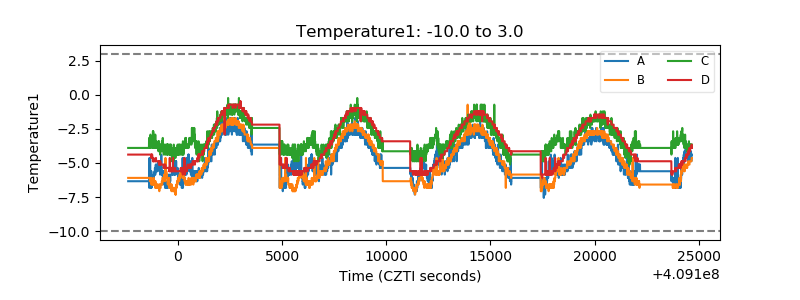 |
| Veto HV Monitor | 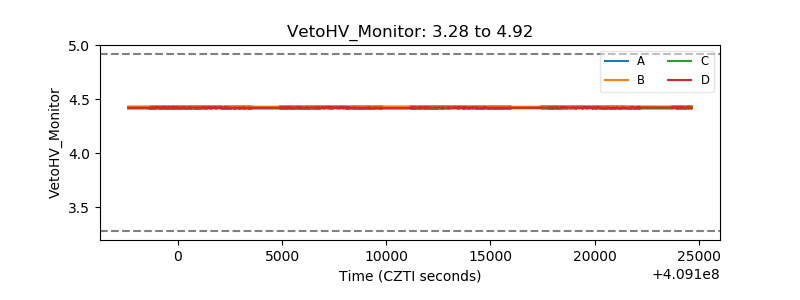 |
| Veto LLD | 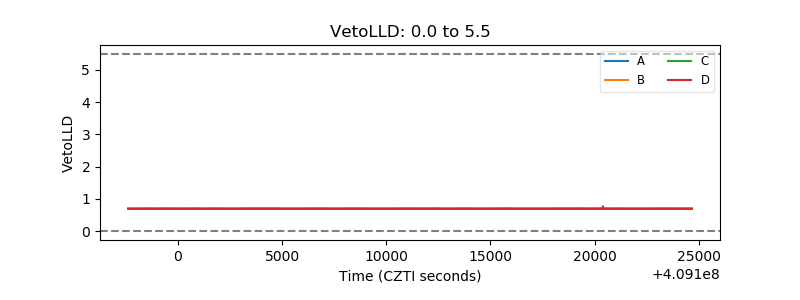 |
| Alpha Counter | 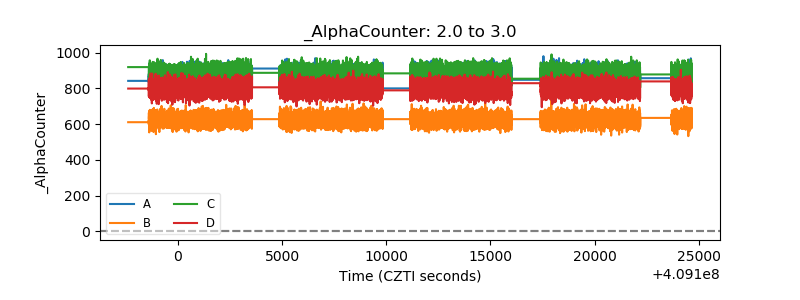 |
| _CPM_Rate | 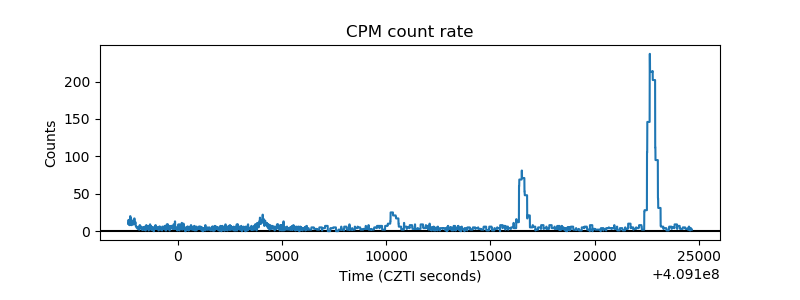 |
| CZT Counter | 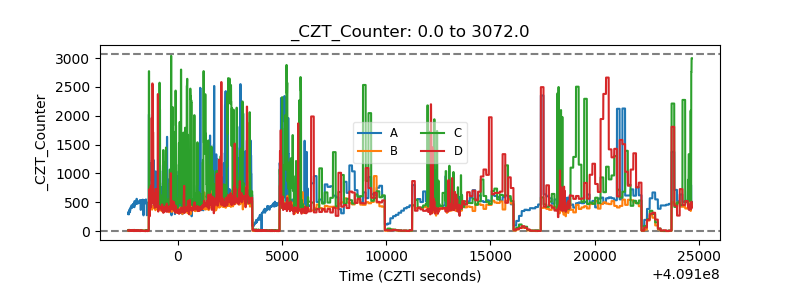 |
| +2.5 Volts monitor | 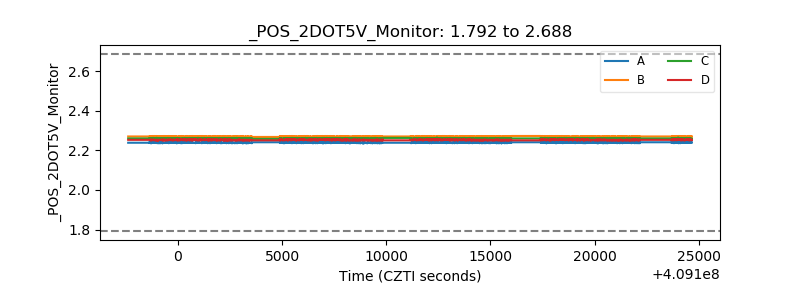 |
| +5 Volts monitor | 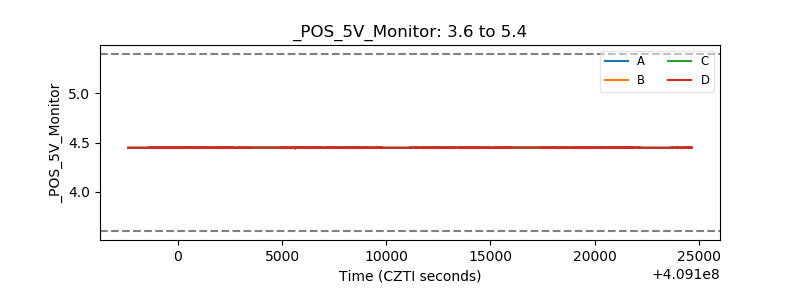 |
| _ROLL_ROT | 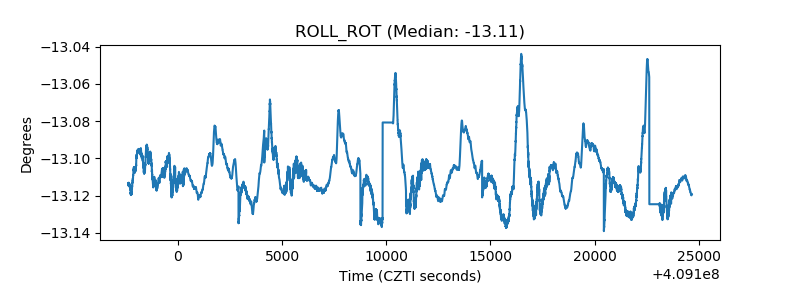 |
| _Roll_DEC | 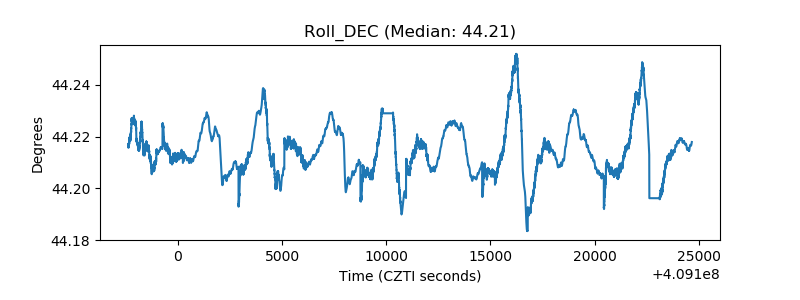 |
| _Roll_RA | 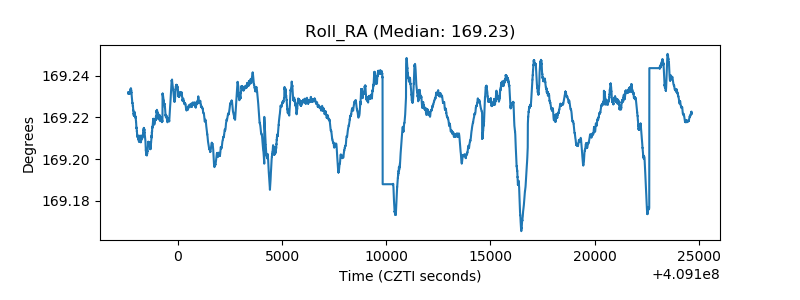 |
| Veto Counter | 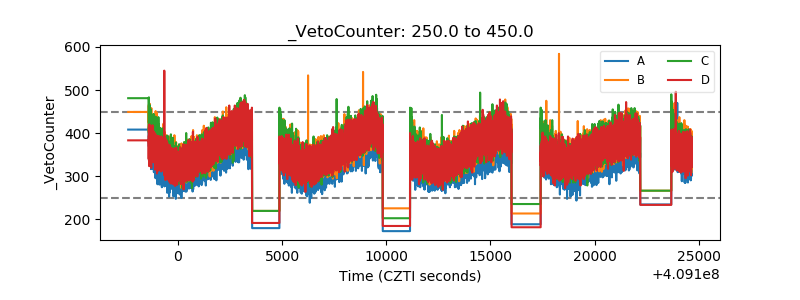 |