| Param | Original file | Final file |
|---|---|---|
| Filename | modeM0/AS1A12_077T06_9000005430_39065cztM0_level2.fits | modeM0/AS1A12_077T06_9000005430_39065cztM0_level2_quad_clean.evt |
| Size (bytes) | 408,360,960 | 88,027,200 |
| Size | 389.4 MB | 83.9 MB |
| Events in quadrant A | 3,711,370 | 578,840 |
| Events in quadrant B | 2,440,591 | 617,118 |
| Events in quadrant C | 3,416,489 | 573,468 |
| Events in quadrant D | 5,130,843 | 520,479 |
| Mode M9 | |||
|---|---|---|---|
| Quadrant | BADHDUFLAG | Total packets | Discarded packets |
| A | 0 | 17 | 0 |
| B | 0 | 17 | 0 |
| C | 0 | 17 | 0 |
| D | 0 | 17 | 0 |
| Mode M0 | |||
|---|---|---|---|
| Quadrant | BADHDUFLAG | Total packets | Discarded packets |
| A | 0 | 14365 | 2 |
| B | 0 | 10808 | 1 |
| C | 0 | 13572 | 1 |
| D | 0 | 19007 | 1 |
| Mode SS | |||
|---|---|---|---|
| Quadrant | BADHDUFLAG | Total packets | Discarded packets |
| A | 0 | 108 | 0 |
| B | 0 | 108 | 0 |
| C | 0 | 108 | 0 |
| D | 0 | 108 | 0 |
| Quadrant | Total seconds | Saturated seconds | Saturation percentage |
|---|---|---|---|
| A | 5368 | 236 | 4.396423% |
| B | 5368 | 7 | 0.130402% |
| C | 5368 | 124 | 2.309985% |
| D | 5368 | 298 | 5.551416% |
Noise dominated data is calculated using 1-second bins in cleaned event files. If a bin has >2000 counts, and if more than 50% of those come from <1% of pixels, then it is considered to be noise-dominated and hence unusable.
| Quadrant | # 1 sec bins | Bins with >0 counts | Bins with >2000 counts | High rate bins dominated by noise | Noise dominated (total time) | Noise dominated (detector-on time) | Marked lightcurve |
|---|---|---|---|---|---|---|---|
| A | 7011 | 5369 | 162 | 162 | 2.31% | 3.02% | 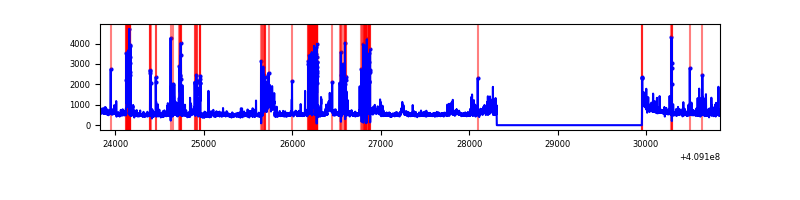 |
| B | 7011 | 5369 | 1 | 1 | 0.01% | 0.02% | 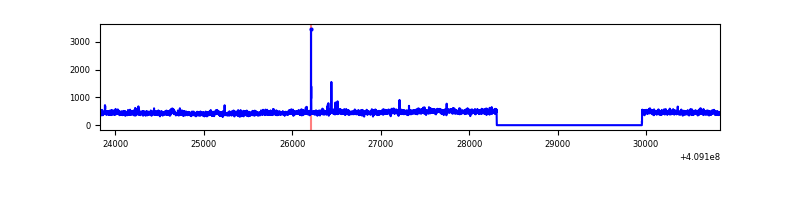 |
| C | 7011 | 5369 | 126 | 126 | 1.80% | 2.35% | 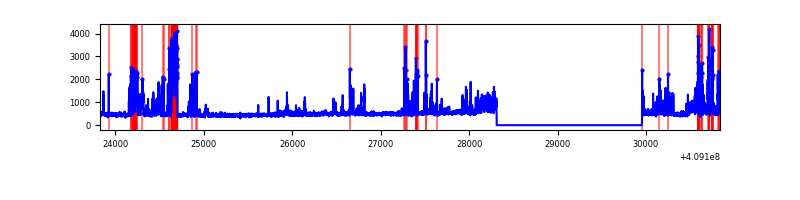 |
| D | 7011 | 5369 | 252 | 252 | 3.59% | 4.69% | 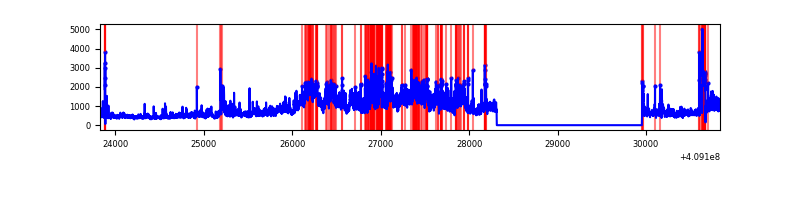 |
Top three noisy pixels from each quadrant. If the there are fewer than three noisy pixels in the level2.evt file, extra rows are filled as -1
| Pixel properties | Quadrant properties | ||||||
|---|---|---|---|---|---|---|---|
| Quadrant | DetID | PixID | Counts | Sigma | Mean | Median | Sigma |
| A | 15 | 222 | 945652 | 7970.1 | 583 | 571 | 118.6 |
| A | 10 | 83 | 360767 | 3037.62 | 583 | 571 | 118.6 |
| A | 13 | 248 | 108191 | 907.59 | 583 | 571 | 118.6 |
| B | 0 | 230 | 57233 | 488.22 | 592 | 576 | 116.0 |
| B | 0 | 190 | 37580 | 318.87 | 592 | 576 | 116.0 |
| B | 12 | 111 | 14292 | 118.19 | 592 | 576 | 116.0 |
| C | 15 | 208 | 948284 | 7071.37 | 573 | 574 | 134.0 |
| C | 15 | 214 | 221894 | 1651.39 | 573 | 574 | 134.0 |
| C | 13 | 61 | 3837 | 24.35 | 573 | 574 | 134.0 |
| D | 12 | 235 | 2091936 | 15247.7 | 568 | 551 | 137.2 |
| D | 2 | 249 | 400752 | 2917.75 | 568 | 551 | 137.2 |
| D | 13 | 249 | 149976 | 1089.42 | 568 | 551 | 137.2 |
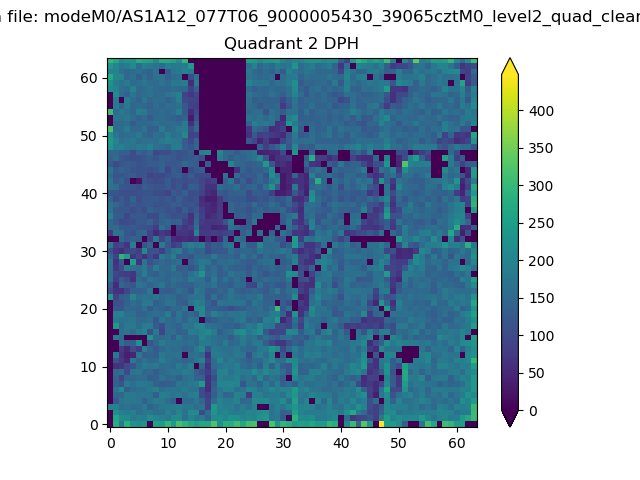
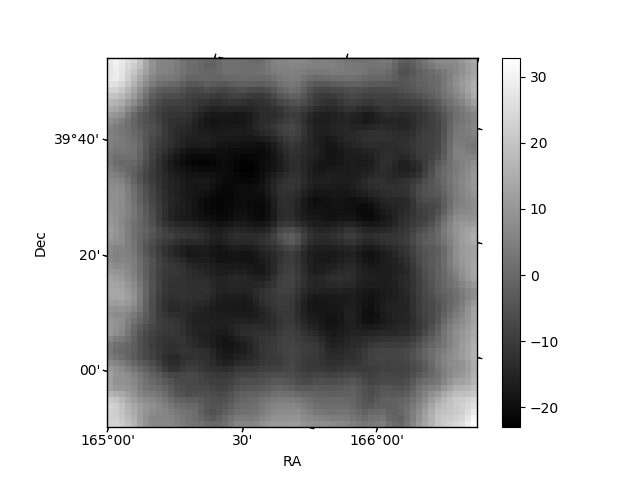
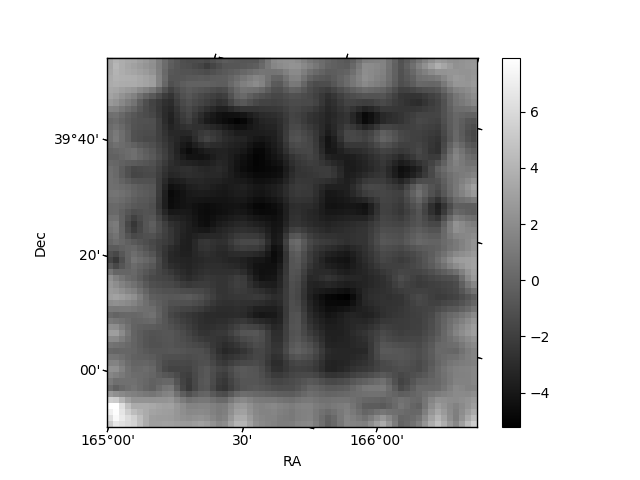
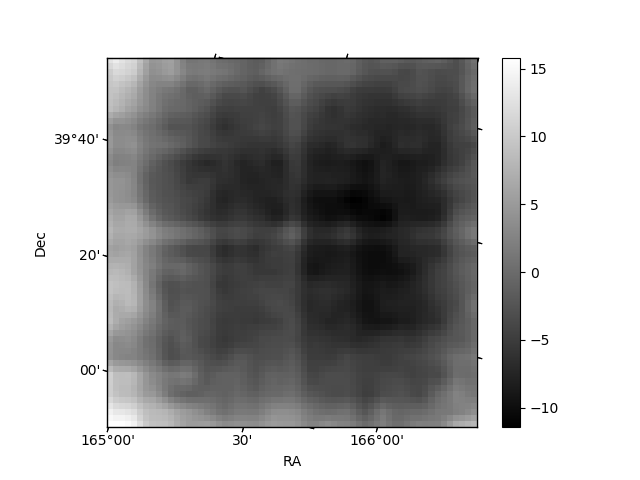
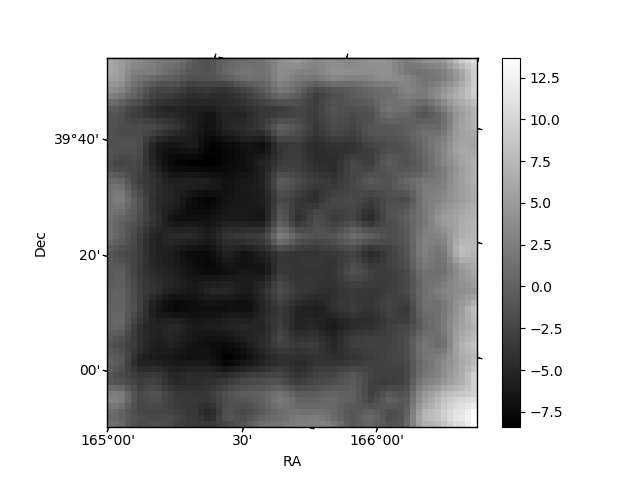
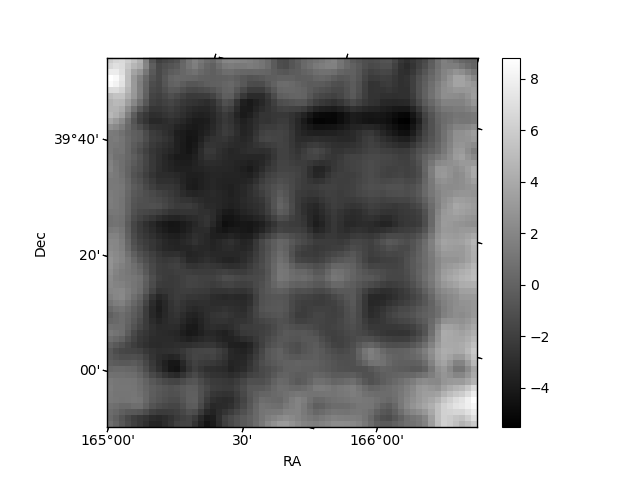
Histogram calculated using DETX and DETY for each event in the final _common_clean file
| Quadrant A | 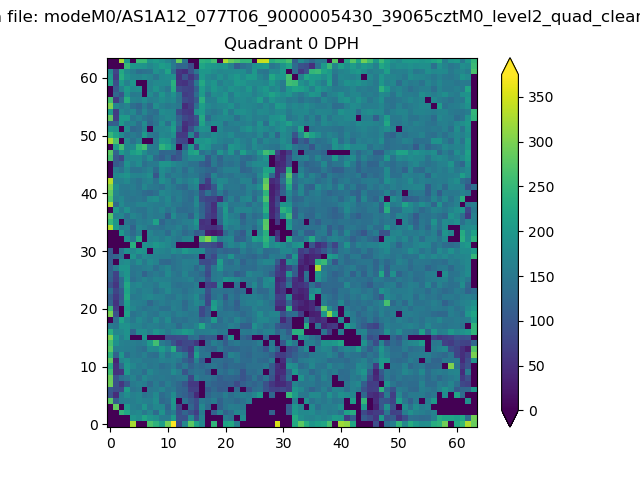 |
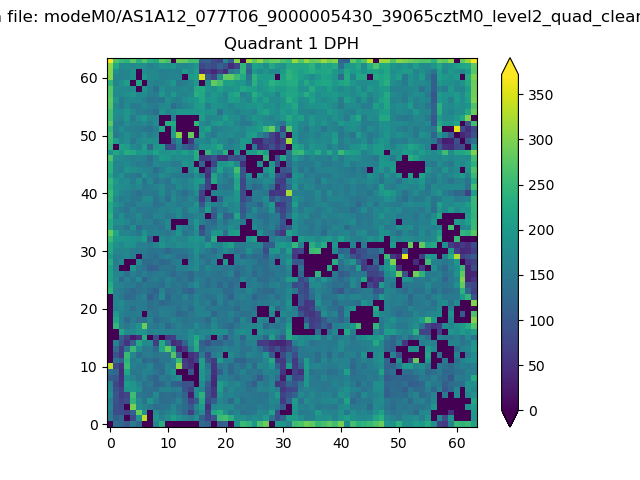 |
Quadrant B |
|---|---|---|---|
| Quadrant D | 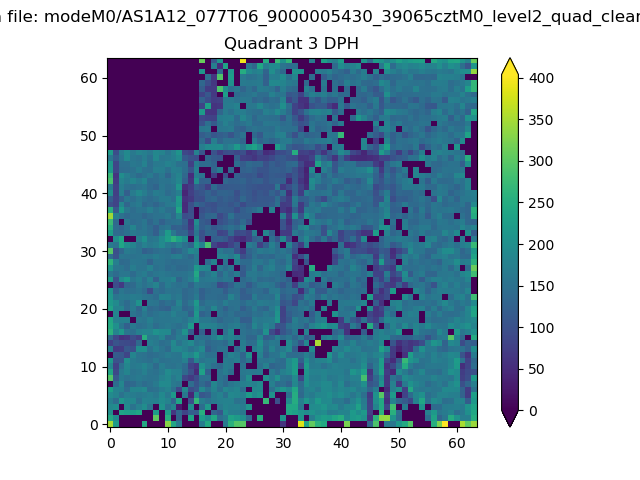 |
 |
Quadrant C |
| Plot type | Count rate plots | Images |
|---|---|---|
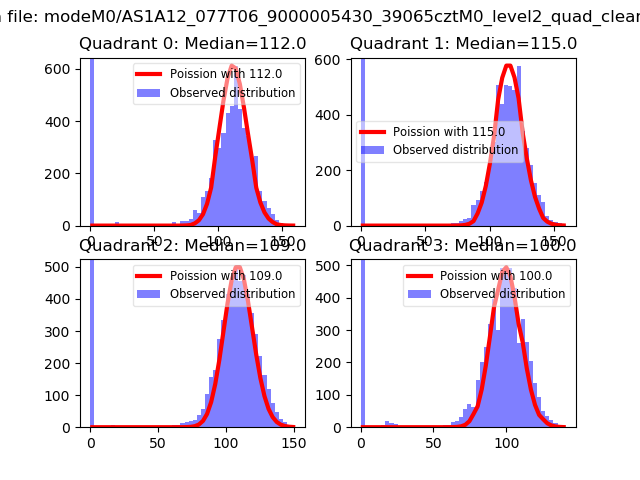
| Comparison with Poisson distribution Blue bars denote a histogram of data divided into 1 sec bins. Red curve is a Poisson curve with rate = median count rate of data. |
 |
 |
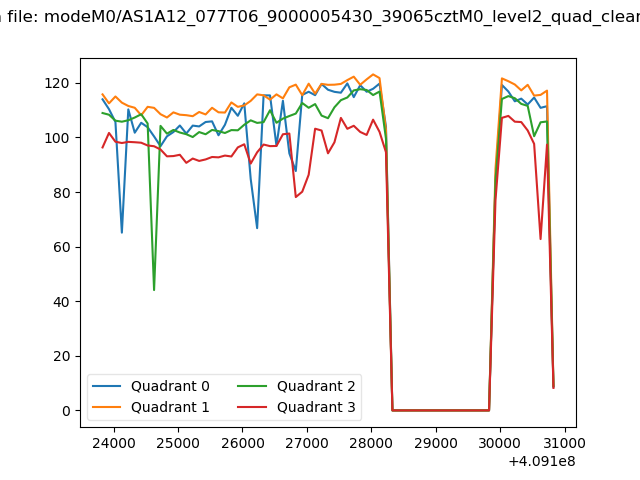
| Quadrant-wise count rates Data is divided into 100 sec bins |
 |
|
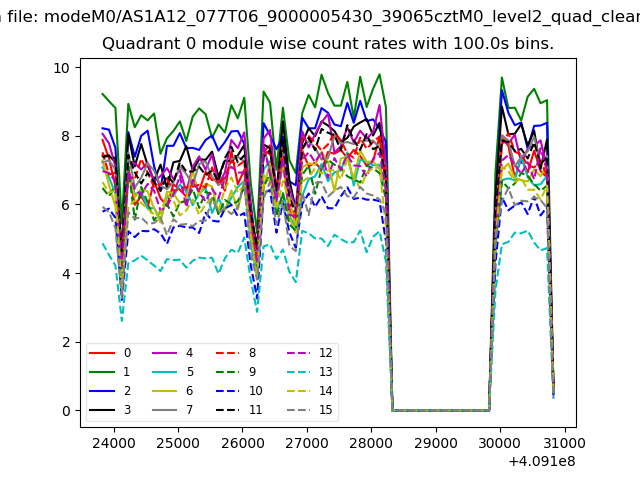
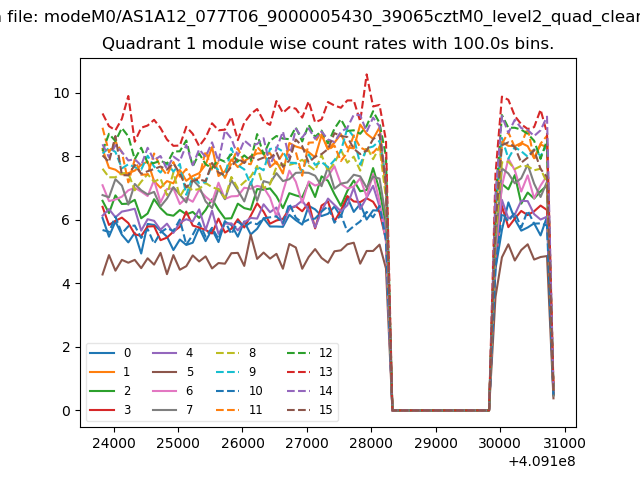
| Module-wise count rates for Quadrant A Data is divided into 100 sec bins |
 |
 |
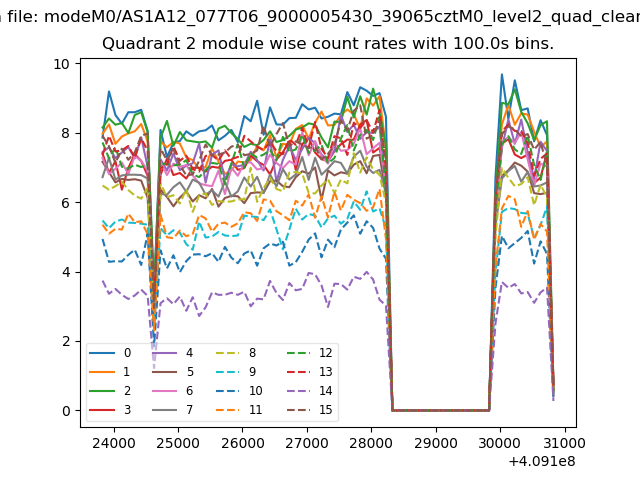
| Module-wise count rates for Quadrant B Data is divided into 100 sec bins |
 |
 |
| Module-wise count rates for Quadrant C Data is divided into 100 sec bins |
 |
 |
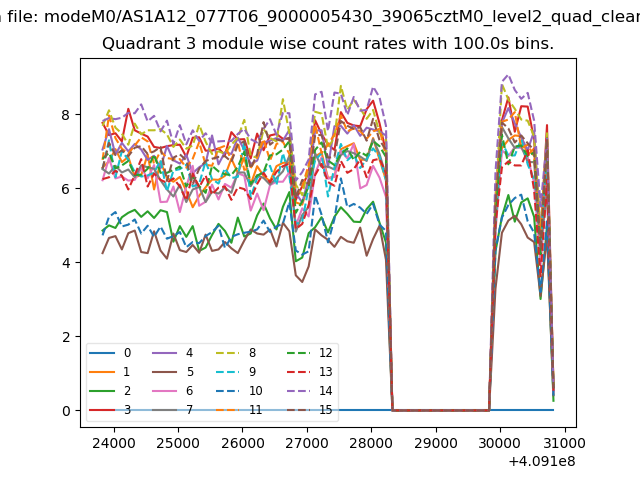
| Module-wise count rates for Quadrant D Data is divided into 100 sec bins |
 |
 |
| Parameter | Plot |
|---|---|
| CZT HV Monitor | 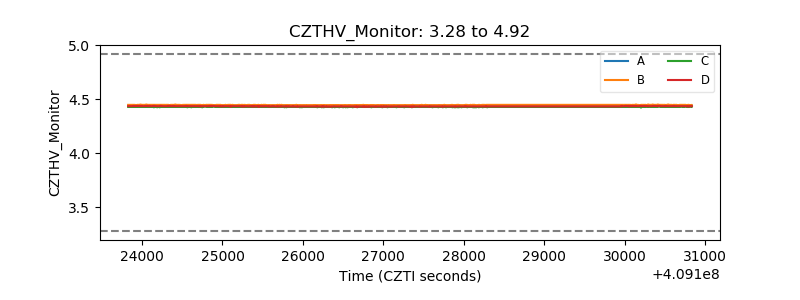 |
| D_VDD | 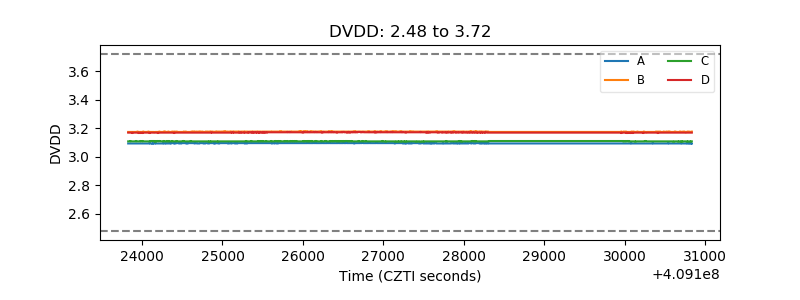 |
| Temperature 1 | 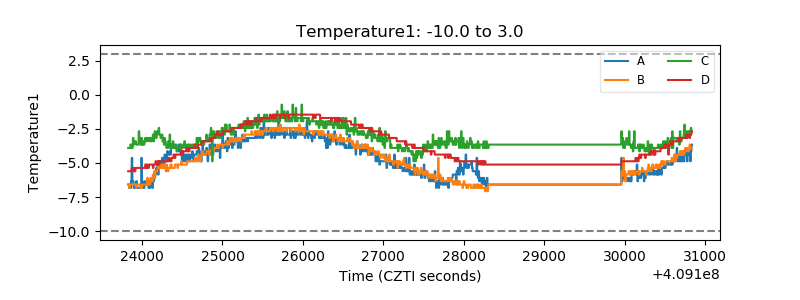 |
| Veto HV Monitor | 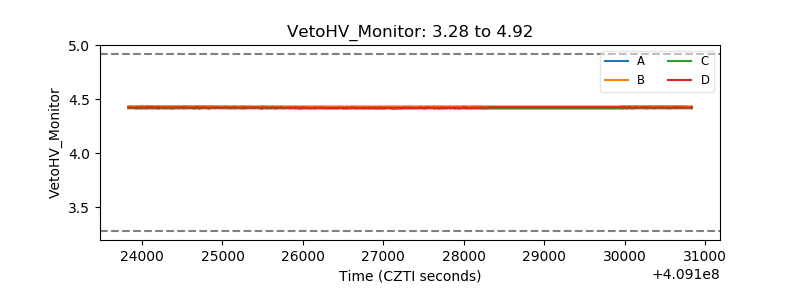 |
| Veto LLD | 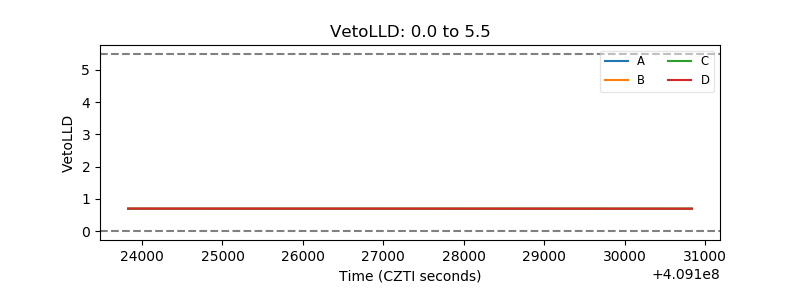 |
| Alpha Counter | 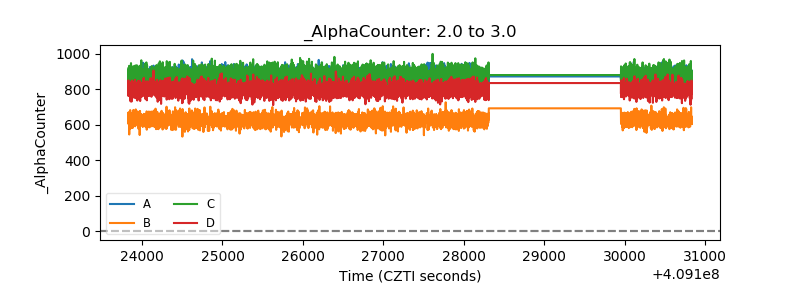 |
| _CPM_Rate | 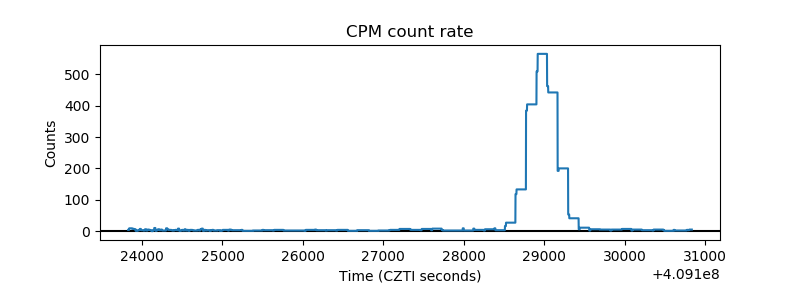 |
| CZT Counter | 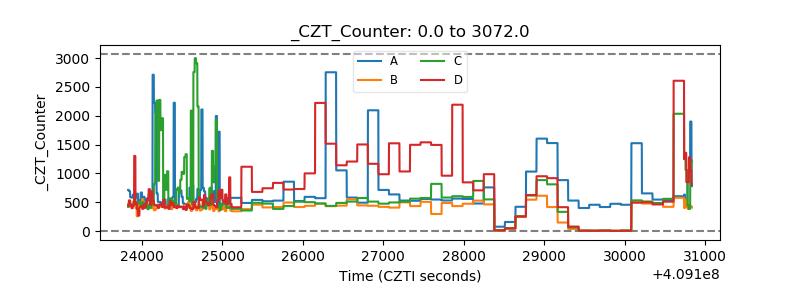 |
| +2.5 Volts monitor | 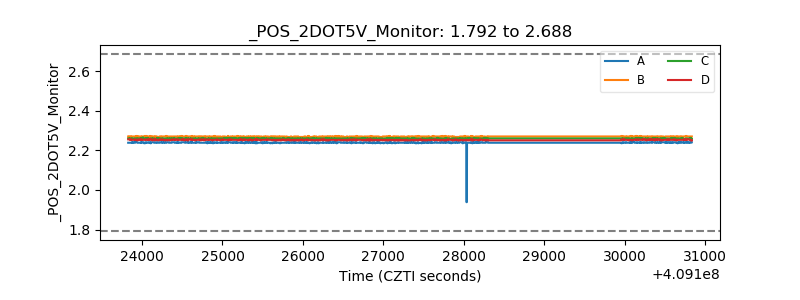 |
| +5 Volts monitor | 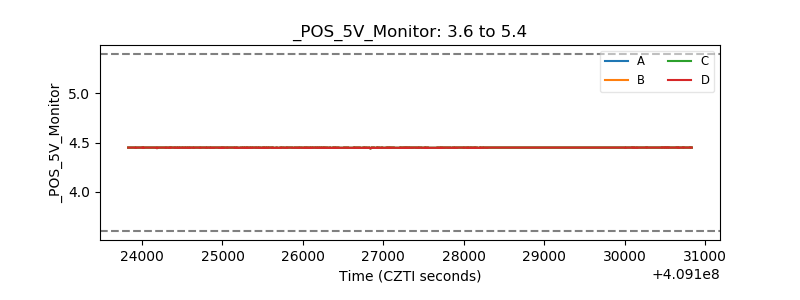 |
| _ROLL_ROT | 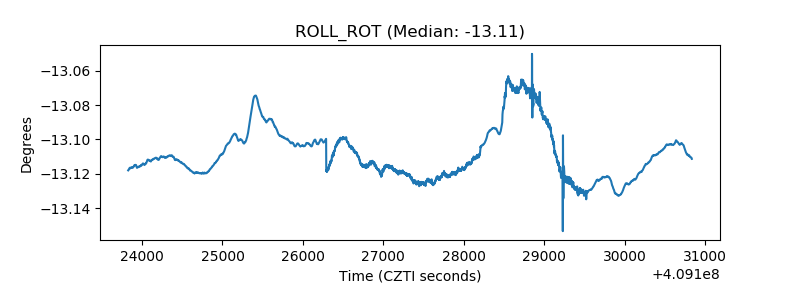 |
| _Roll_DEC | 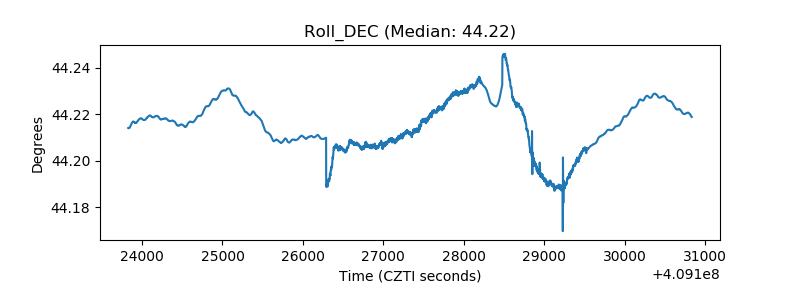 |
| _Roll_RA | 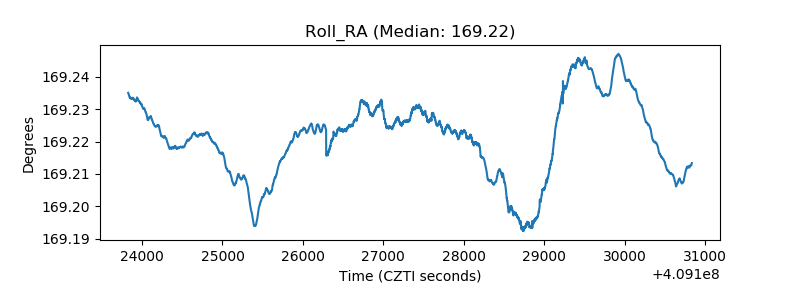 |
| Veto Counter | 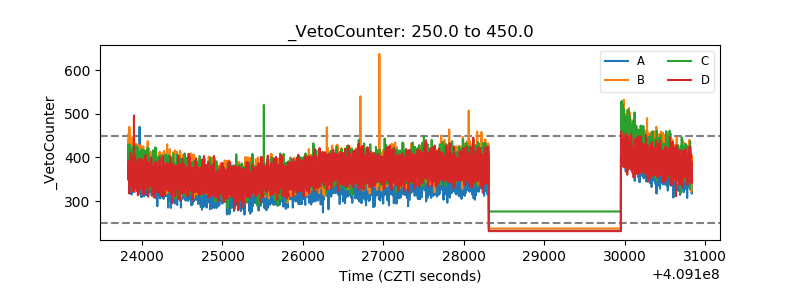 |