| Param | Original file | Final file |
|---|---|---|
| Filename | modeM0/AS1A12_077T06_9000005430_39067cztM0_level2.fits | modeM0/AS1A12_077T06_9000005430_39067cztM0_level2_quad_clean.evt |
| Size (bytes) | 473,443,200 | 89,000,640 |
| Size | 451.5 MB | 84.9 MB |
| Events in quadrant A | 4,108,035 | 571,920 |
| Events in quadrant B | 2,525,792 | 639,414 |
| Events in quadrant C | 4,907,967 | 567,987 |
| Events in quadrant D | 5,565,446 | 538,190 |
| Mode M9 | |||
|---|---|---|---|
| Quadrant | BADHDUFLAG | Total packets | Discarded packets |
| A | 0 | 22 | 0 |
| B | 0 | 22 | 0 |
| C | 0 | 22 | 0 |
| D | 0 | 23 | 0 |
| Mode M0 | |||
|---|---|---|---|
| Quadrant | BADHDUFLAG | Total packets | Discarded packets |
| A | 0 | 15485 | 3 |
| B | 0 | 11015 | 2 |
| C | 0 | 18044 | 2 |
| D | 0 | 20386 | 2 |
| Mode SS | |||
|---|---|---|---|
| Quadrant | BADHDUFLAG | Total packets | Discarded packets |
| A | 0 | 110 | 0 |
| B | 0 | 110 | 0 |
| C | 0 | 110 | 0 |
| D | 0 | 110 | 0 |
| Quadrant | Total seconds | Saturated seconds | Saturation percentage |
|---|---|---|---|
| A | 5388 | 512 | 9.502598% |
| B | 5388 | 2 | 0.037120% |
| C | 5388 | 448 | 8.314774% |
| D | 5388 | 320 | 5.939124% |
Noise dominated data is calculated using 1-second bins in cleaned event files. If a bin has >2000 counts, and if more than 50% of those come from <1% of pixels, then it is considered to be noise-dominated and hence unusable.
| Quadrant | # 1 sec bins | Bins with >0 counts | Bins with >2000 counts | High rate bins dominated by noise | Noise dominated (total time) | Noise dominated (detector-on time) | Marked lightcurve |
|---|---|---|---|---|---|---|---|
| A | 7120 | 5388 | 354 | 354 | 4.97% | 6.57% | 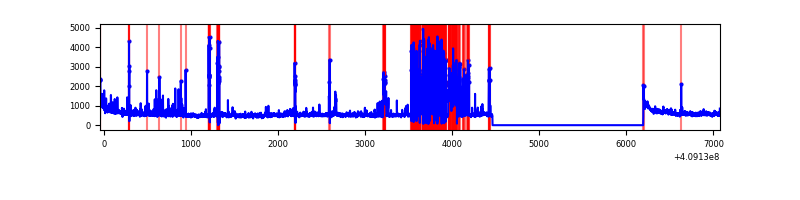 |
| B | 7120 | 5389 | 0 | 0 | 0.00% | 0.00% | 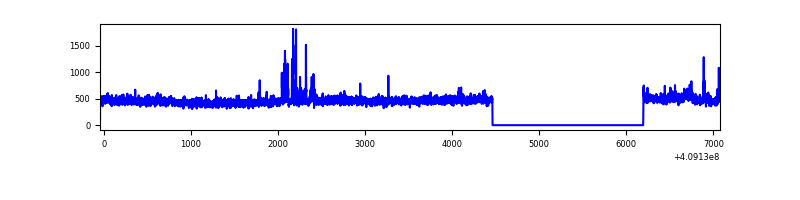 |
| C | 7120 | 5389 | 547 | 547 | 7.68% | 10.15% | 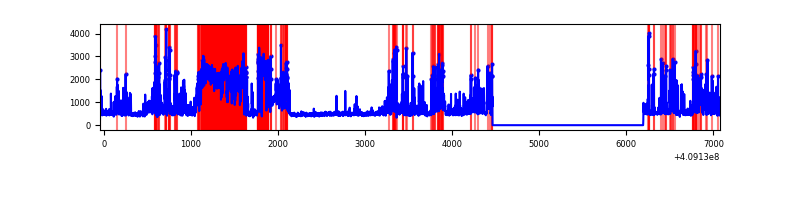 |
| D | 7120 | 5389 | 317 | 317 | 4.45% | 5.88% | 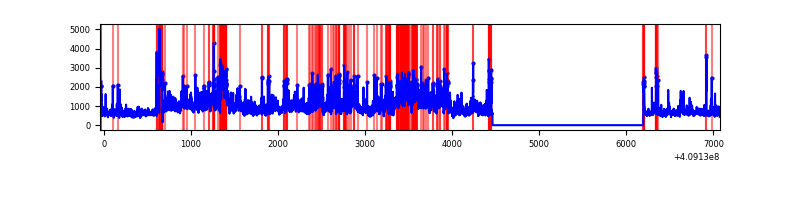 |
Top three noisy pixels from each quadrant. If the there are fewer than three noisy pixels in the level2.evt file, extra rows are filled as -1
| Pixel properties | Quadrant properties | ||||||
|---|---|---|---|---|---|---|---|
| Quadrant | DetID | PixID | Counts | Sigma | Mean | Median | Sigma |
| A | 15 | 222 | 1414394 | 12219.27 | 575 | 562 | 115.7 |
| A | 10 | 83 | 394611 | 3405.63 | 575 | 562 | 115.7 |
| A | 13 | 248 | 36040 | 306.62 | 575 | 562 | 115.7 |
| B | 0 | 230 | 49852 | 422.69 | 607 | 590 | 116.5 |
| B | 15 | 85 | 48184 | 408.38 | 607 | 590 | 116.5 |
| B | 0 | 190 | 19236 | 159.99 | 607 | 590 | 116.5 |
| C | 15 | 208 | 2388300 | 17602.7 | 581 | 585 | 135.6 |
| C | 15 | 214 | 225676 | 1659.41 | 581 | 585 | 135.6 |
| C | 3 | 233 | 15092 | 106.95 | 581 | 585 | 135.6 |
| D | 12 | 235 | 2348020 | 16444.19 | 583 | 566 | 142.8 |
| D | 2 | 249 | 270082 | 1887.99 | 583 | 566 | 142.8 |
| D | 13 | 249 | 242546 | 1695.1 | 583 | 566 | 142.8 |
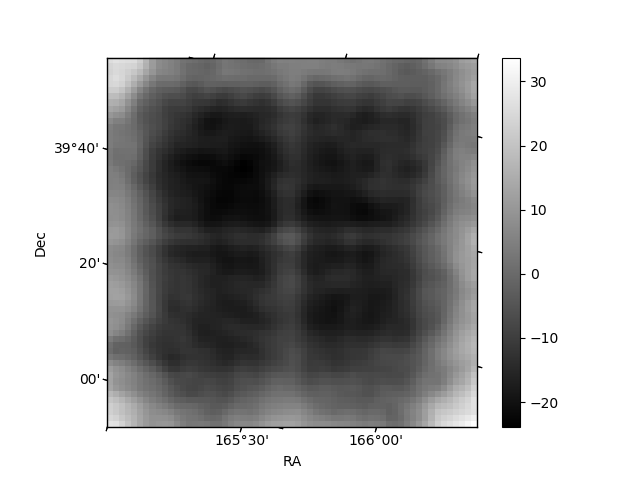
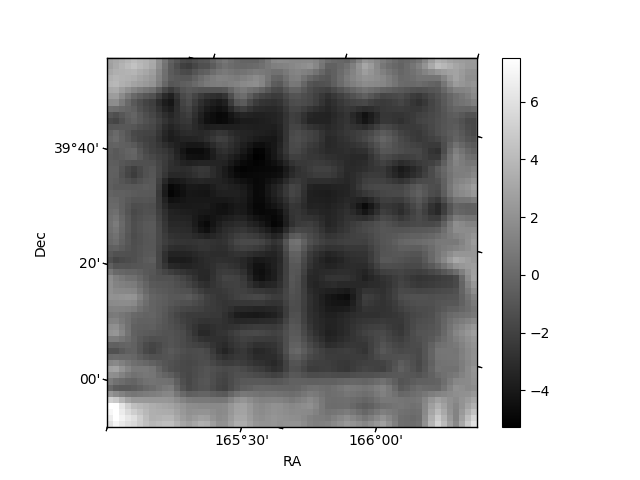
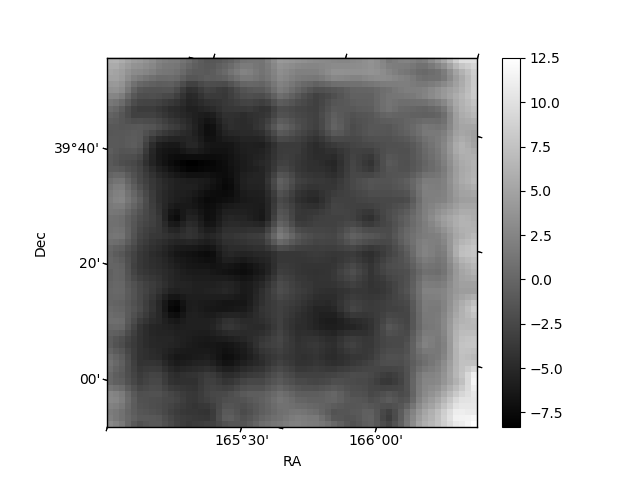
Histogram calculated using DETX and DETY for each event in the final _common_clean file
| Quadrant A | 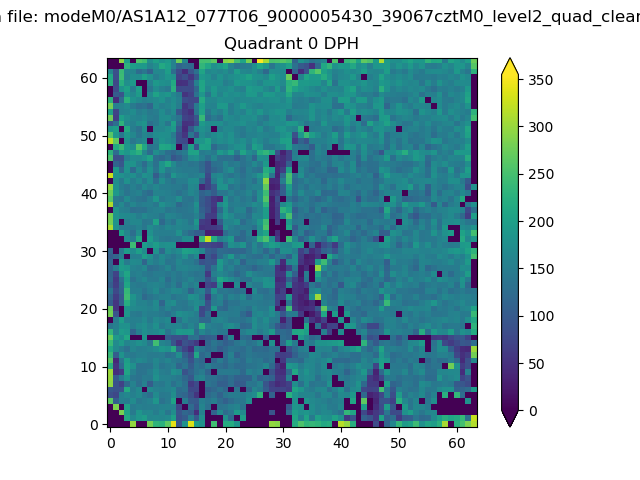 |
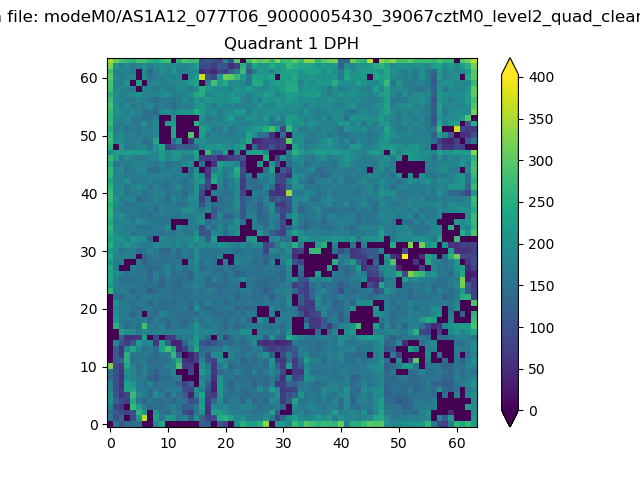 |
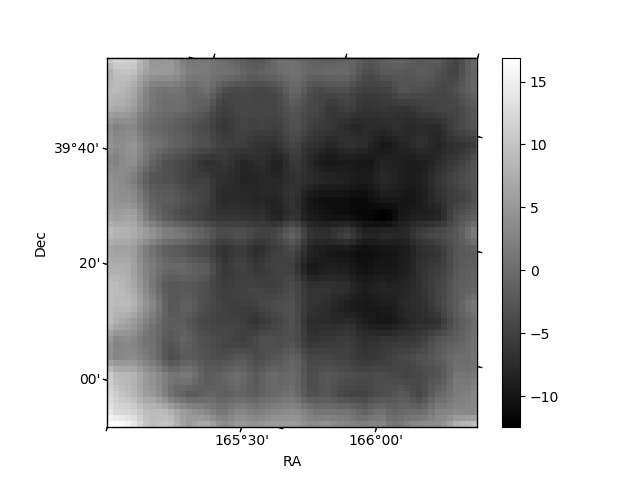
Quadrant B |
|---|---|---|---|
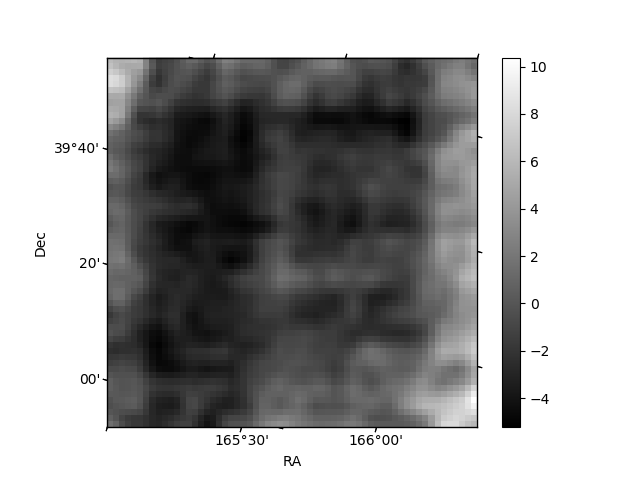
| Quadrant D | 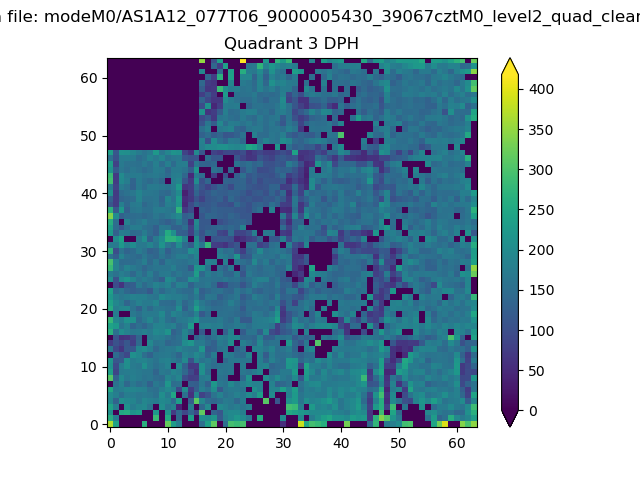 |
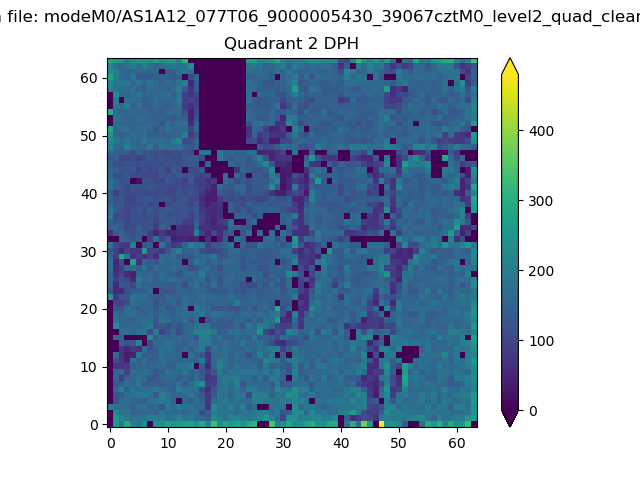 |
Quadrant C |
| Plot type | Count rate plots | Images |
|---|---|---|
| Comparison with Poisson distribution Blue bars denote a histogram of data divided into 1 sec bins. Red curve is a Poisson curve with rate = median count rate of data. |
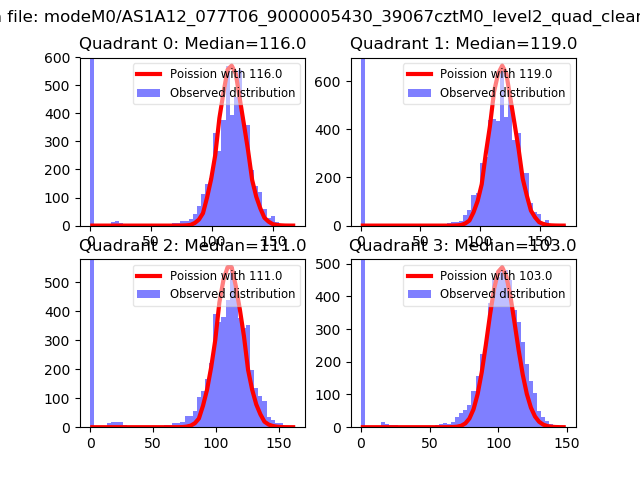 |
 |
| Quadrant-wise count rates Data is divided into 100 sec bins |
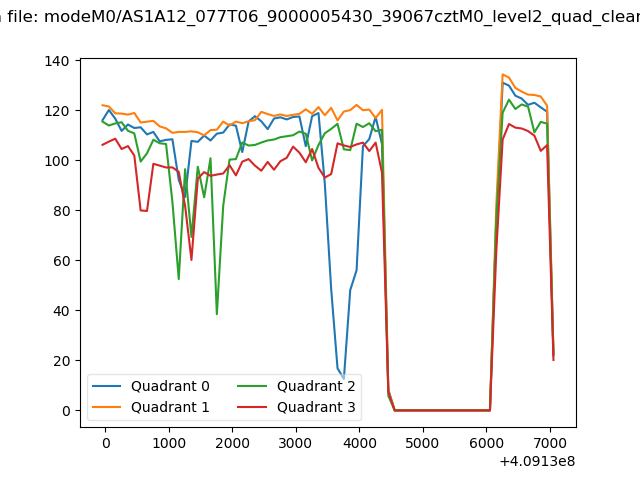 |
|
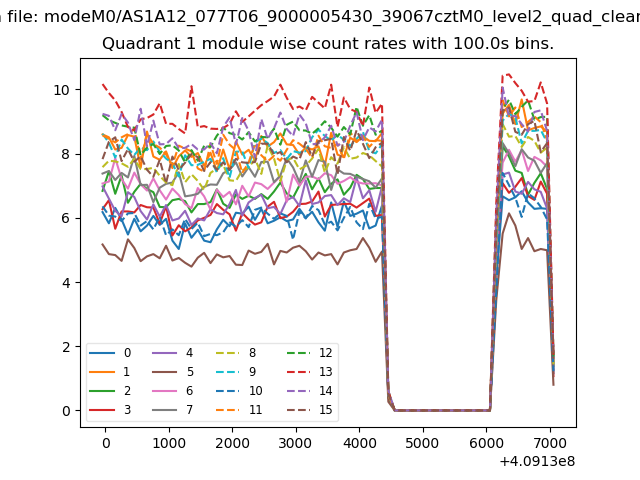
| Module-wise count rates for Quadrant A Data is divided into 100 sec bins |
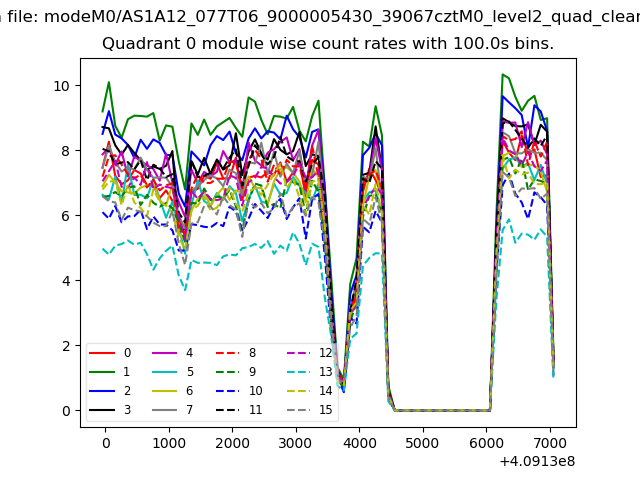 |
 |
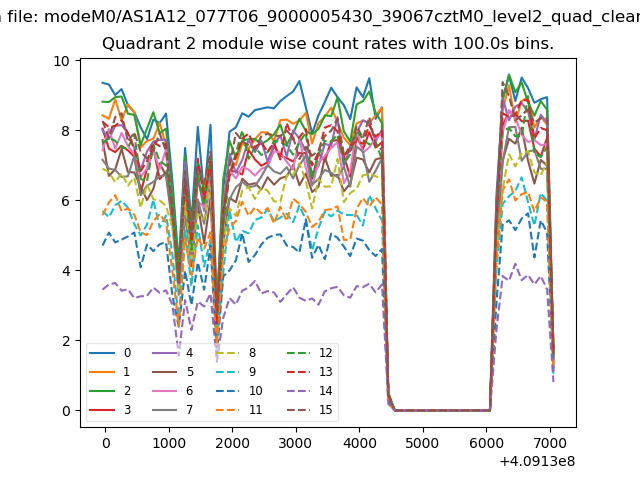
| Module-wise count rates for Quadrant B Data is divided into 100 sec bins |
 |
 |
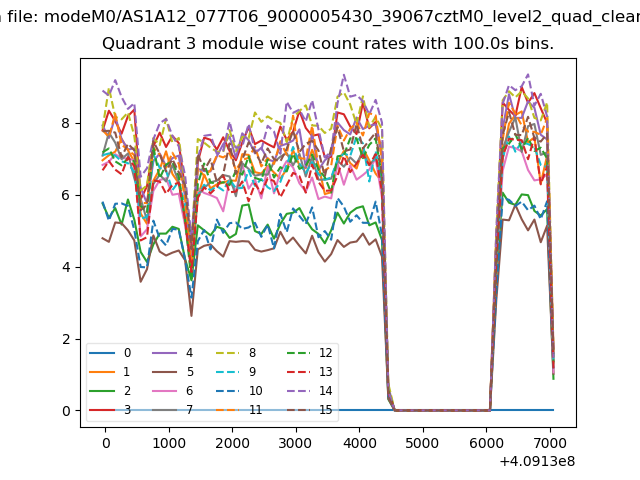
| Module-wise count rates for Quadrant C Data is divided into 100 sec bins |
 |
 |
| Module-wise count rates for Quadrant D Data is divided into 100 sec bins |
 |
 |
| Parameter | Plot |
|---|---|
| CZT HV Monitor | 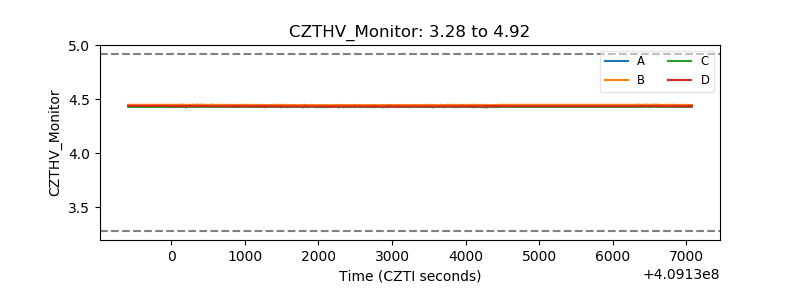 |
| D_VDD | 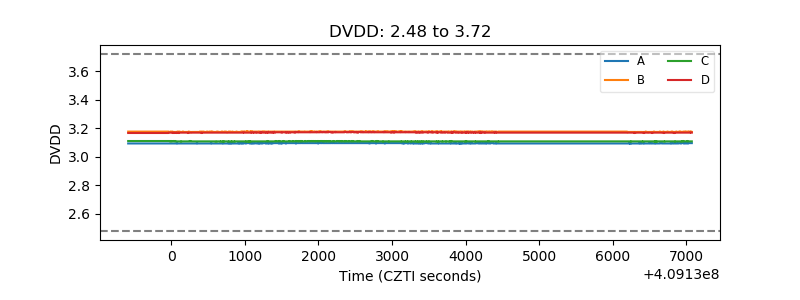 |
| Temperature 1 | 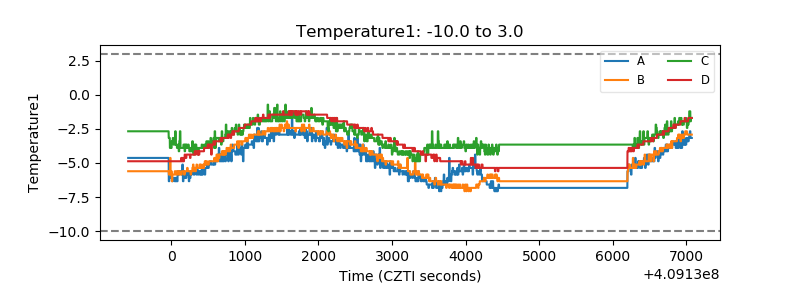 |
| Veto HV Monitor | 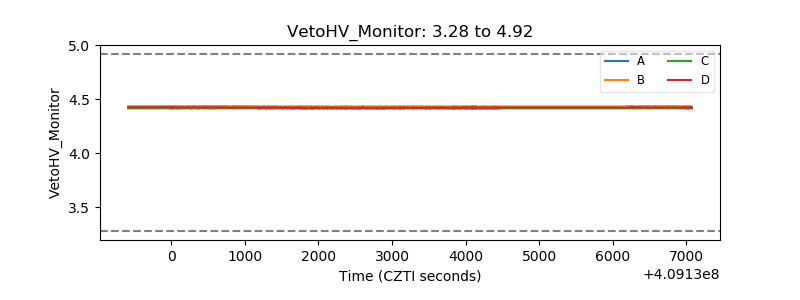 |
| Veto LLD | 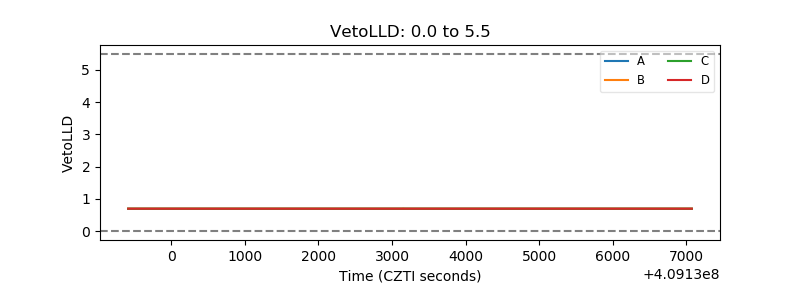 |
| Alpha Counter | 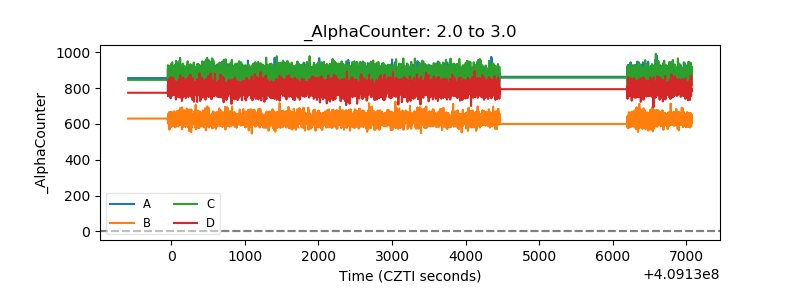 |
| _CPM_Rate | 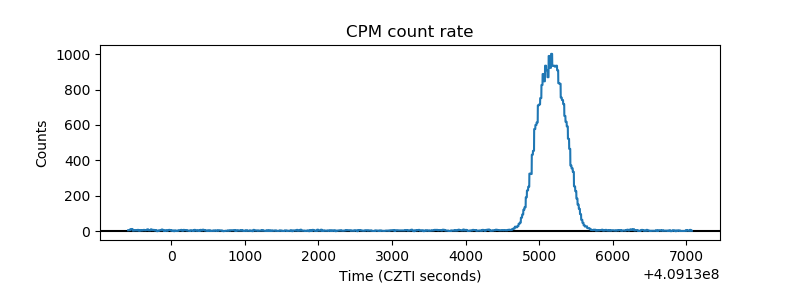 |
| CZT Counter | 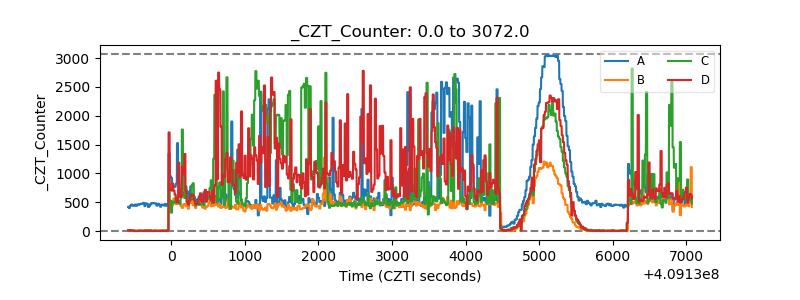 |
| +2.5 Volts monitor |  |
| +5 Volts monitor | 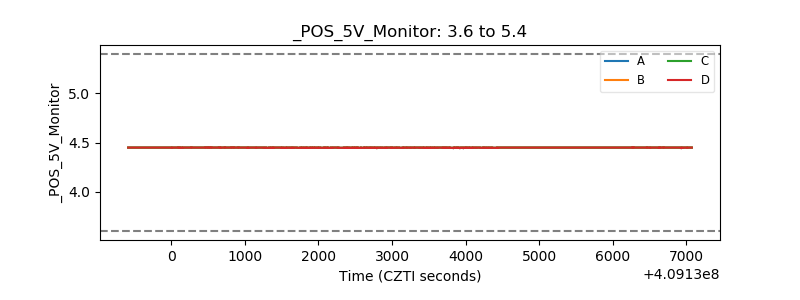 |
| _ROLL_ROT | 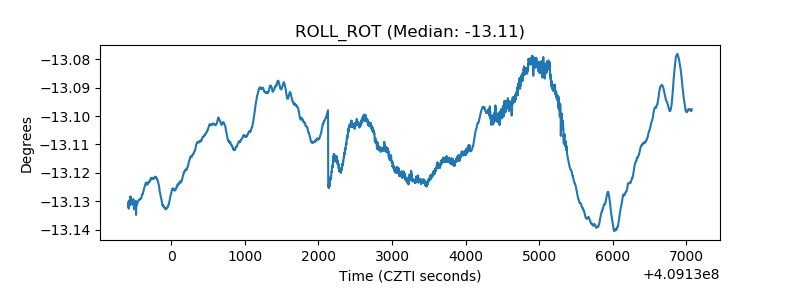 |
| _Roll_DEC | 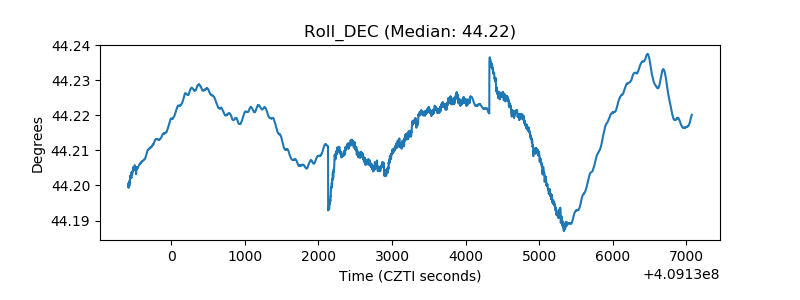 |
| _Roll_RA | 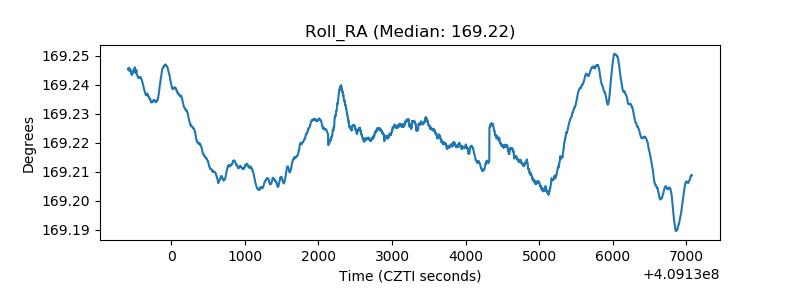 |
| Veto Counter | 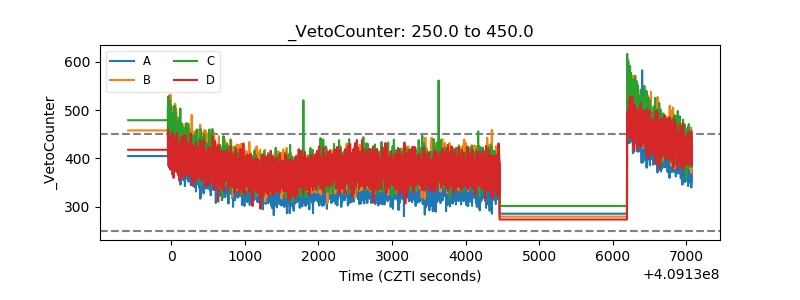 |