| Param | Original file | Final file |
|---|---|---|
| Filename | modeM0/AS1A12_077T06_9000005430_39068cztM0_level2.fits | modeM0/AS1A12_077T06_9000005430_39068cztM0_level2_quad_clean.evt |
| Size (bytes) | 407,851,200 | 90,256,320 |
| Size | 389.0 MB | 86.1 MB |
| Events in quadrant A | 3,387,664 | 608,110 |
| Events in quadrant B | 2,529,572 | 642,542 |
| Events in quadrant C | 3,792,852 | 586,456 |
| Events in quadrant D | 4,986,891 | 534,733 |
| Mode M9 | |||
|---|---|---|---|
| Quadrant | BADHDUFLAG | Total packets | Discarded packets |
| A | 0 | 22 | 0 |
| B | 0 | 22 | 0 |
| C | 0 | 22 | 0 |
| D | 0 | 23 | 0 |
| Mode M0 | |||
|---|---|---|---|
| Quadrant | BADHDUFLAG | Total packets | Discarded packets |
| A | 0 | 13172 | 3 |
| B | 0 | 10647 | 2 |
| C | 0 | 14480 | 2 |
| D | 0 | 18466 | 2 |
| Mode SS | |||
|---|---|---|---|
| Quadrant | BADHDUFLAG | Total packets | Discarded packets |
| A | 0 | 106 | 0 |
| B | 0 | 106 | 0 |
| C | 0 | 106 | 0 |
| D | 0 | 106 | 0 |
| Quadrant | Total seconds | Saturated seconds | Saturation percentage |
|---|---|---|---|
| A | 5152 | 199 | 3.862578% |
| B | 5152 | 8 | 0.155280% |
| C | 5152 | 229 | 4.444876% |
| D | 5152 | 316 | 6.133540% |
Noise dominated data is calculated using 1-second bins in cleaned event files. If a bin has >2000 counts, and if more than 50% of those come from <1% of pixels, then it is considered to be noise-dominated and hence unusable.
| Quadrant | # 1 sec bins | Bins with >0 counts | Bins with >2000 counts | High rate bins dominated by noise | Noise dominated (total time) | Noise dominated (detector-on time) | Marked lightcurve |
|---|---|---|---|---|---|---|---|
| A | 7035 | 5153 | 116 | 116 | 1.65% | 2.25% | 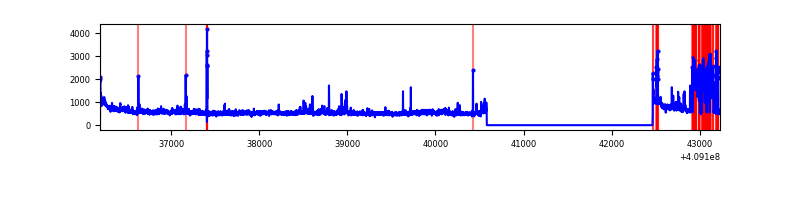 |
| B | 7035 | 5153 | 2 | 2 | 0.03% | 0.04% | 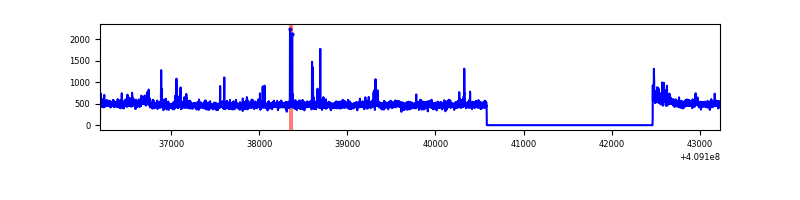 |
| C | 7035 | 5153 | 193 | 193 | 2.74% | 3.75% | 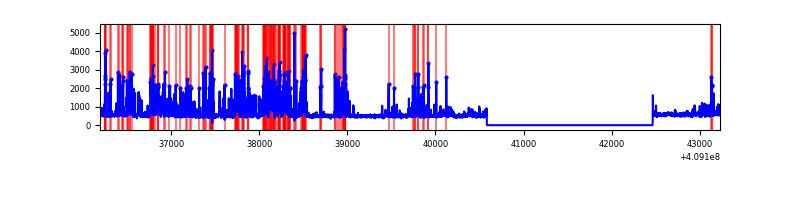 |
| D | 7035 | 5153 | 295 | 295 | 4.19% | 5.72% | 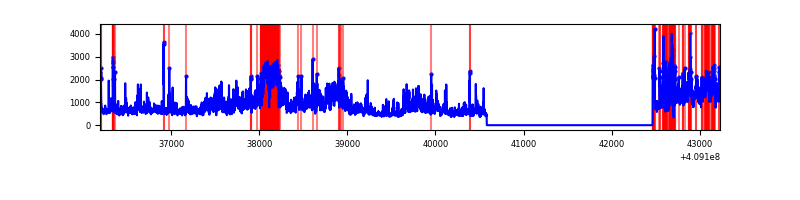 |
Top three noisy pixels from each quadrant. If the there are fewer than three noisy pixels in the level2.evt file, extra rows are filled as -1
| Pixel properties | Quadrant properties | ||||||
|---|---|---|---|---|---|---|---|
| Quadrant | DetID | PixID | Counts | Sigma | Mean | Median | Sigma |
| A | 15 | 222 | 535229 | 4449.47 | 596 | 585 | 120.2 |
| A | 10 | 83 | 399634 | 3321.0 | 596 | 585 | 120.2 |
| A | 15 | 223 | 63890 | 526.84 | 596 | 585 | 120.2 |
| B | 0 | 190 | 67838 | 592.96 | 597 | 582 | 113.4 |
| B | 0 | 230 | 37487 | 325.37 | 597 | 582 | 113.4 |
| B | 0 | 213 | 23199 | 199.4 | 597 | 582 | 113.4 |
| C | 15 | 208 | 1305154 | 9660.92 | 577 | 581 | 135.0 |
| C | 15 | 214 | 216079 | 1595.85 | 577 | 581 | 135.0 |
| C | 3 | 233 | 6871 | 46.58 | 577 | 581 | 135.0 |
| D | 12 | 235 | 2134701 | 15071.88 | 580 | 563 | 141.6 |
| D | 2 | 249 | 361333 | 2547.86 | 580 | 563 | 141.6 |
| D | 1 | 47 | 116697 | 820.17 | 580 | 563 | 141.6 |
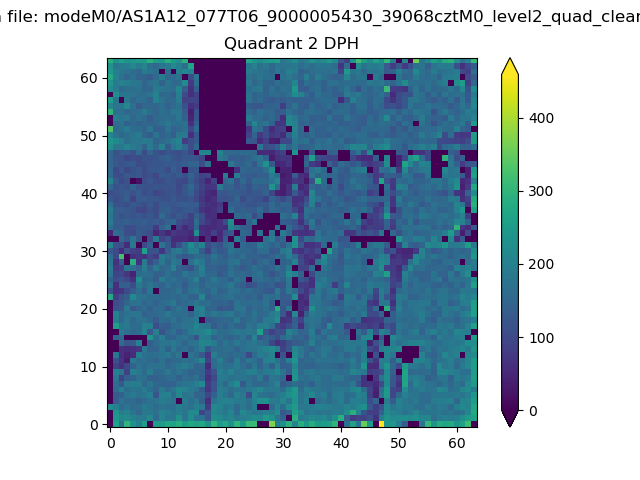
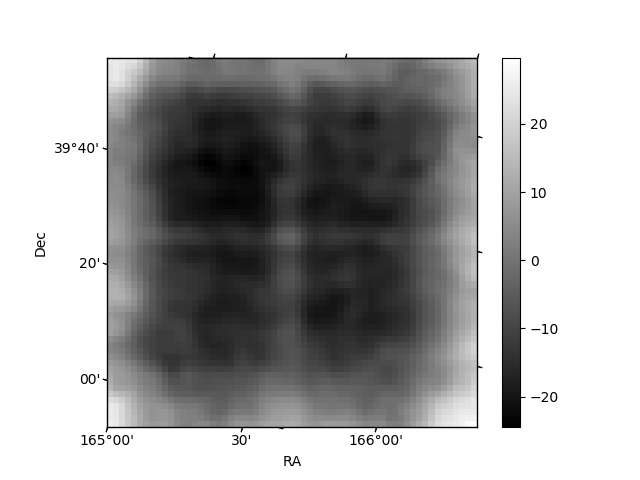
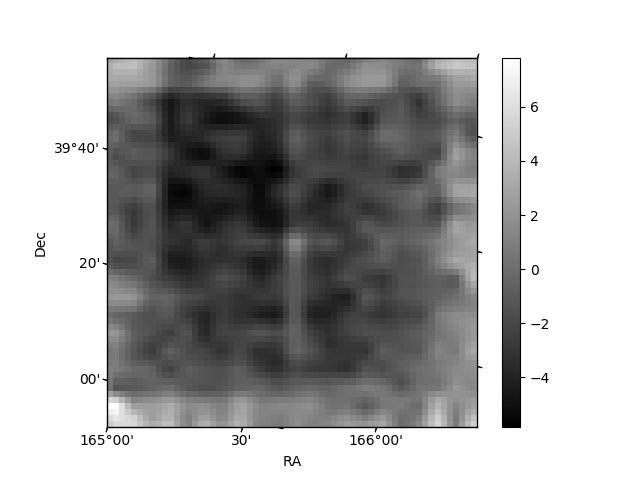
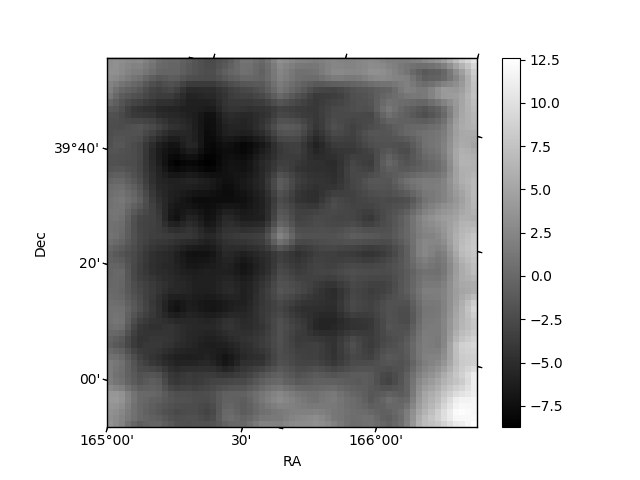
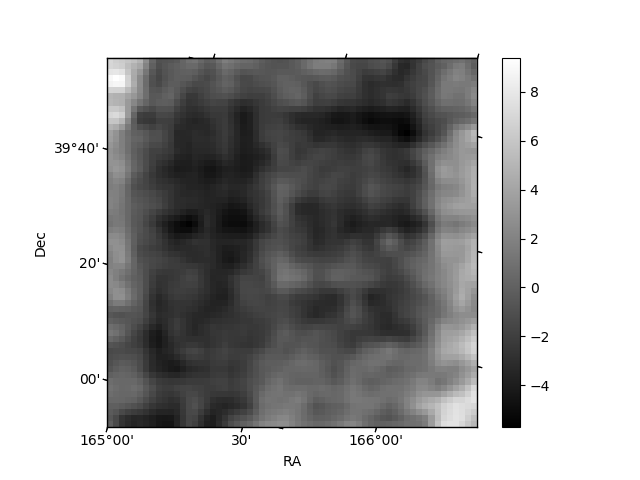
Histogram calculated using DETX and DETY for each event in the final _common_clean file
| Quadrant A | 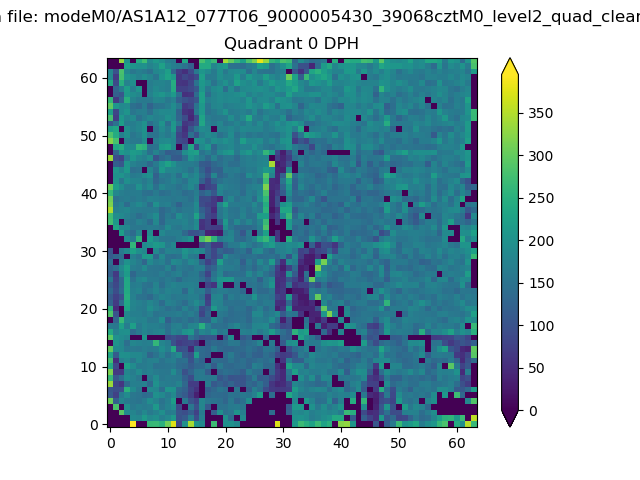 |
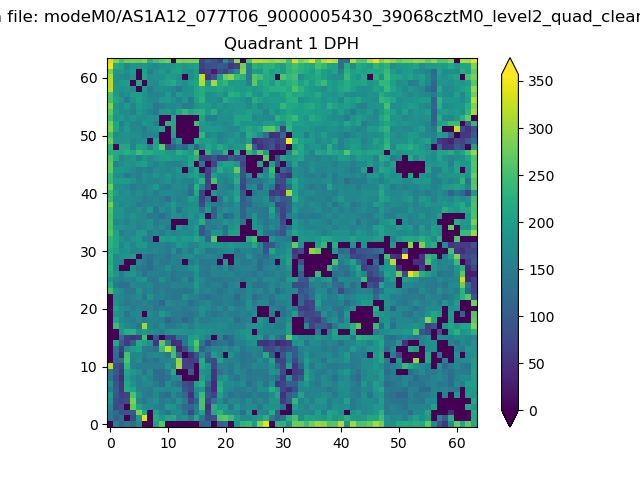 |
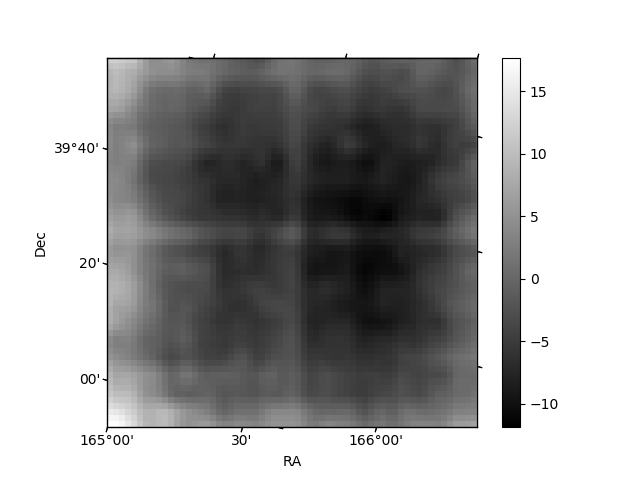
Quadrant B |
|---|---|---|---|
| Quadrant D | 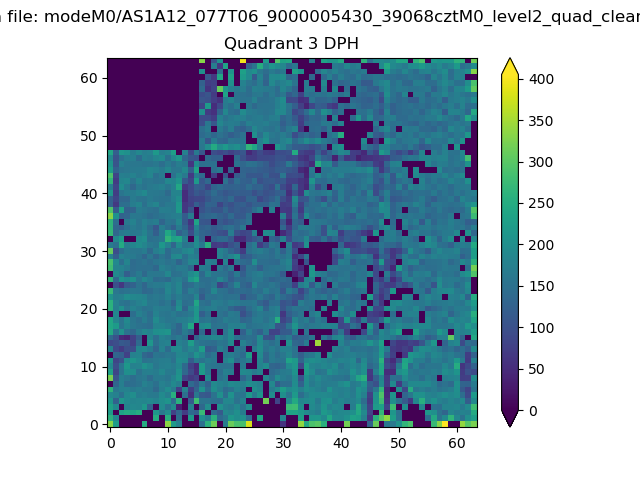 |
 |
Quadrant C |
| Plot type | Count rate plots | Images |
|---|---|---|
| Comparison with Poisson distribution Blue bars denote a histogram of data divided into 1 sec bins. Red curve is a Poisson curve with rate = median count rate of data. |
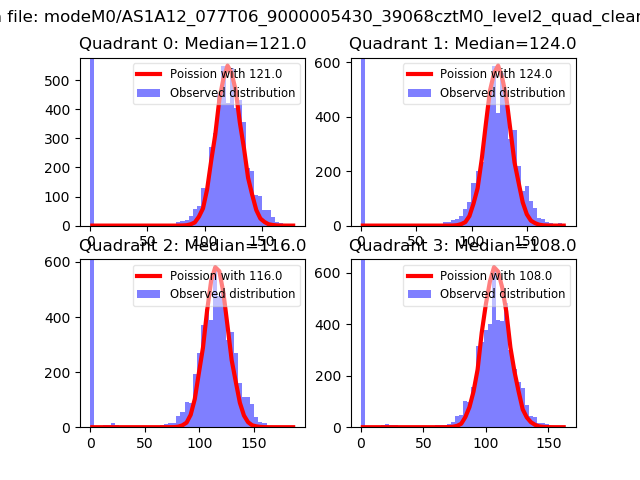 |
 |
| Quadrant-wise count rates Data is divided into 100 sec bins |
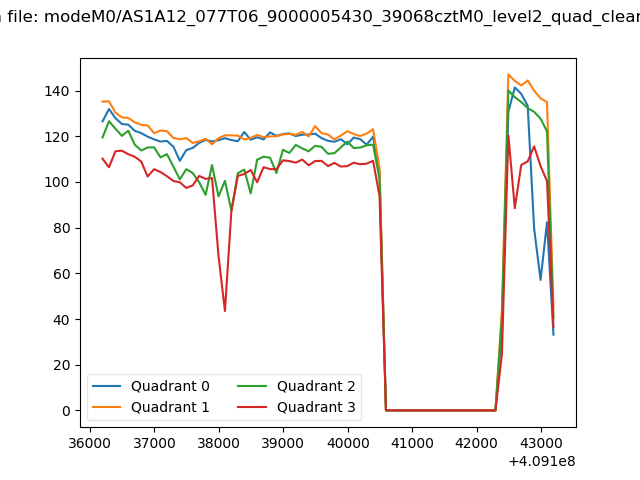 |
|
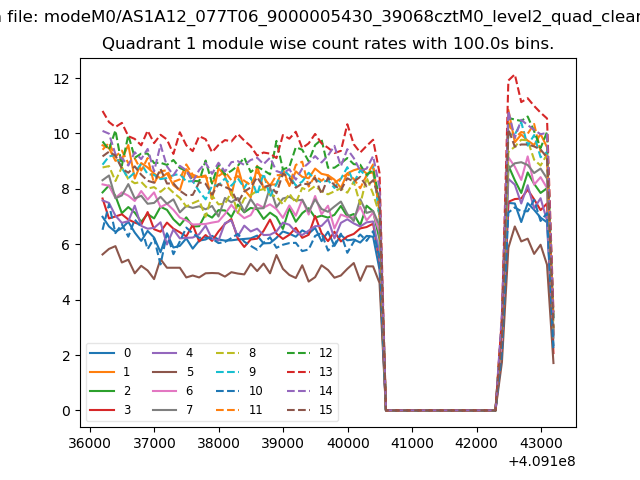
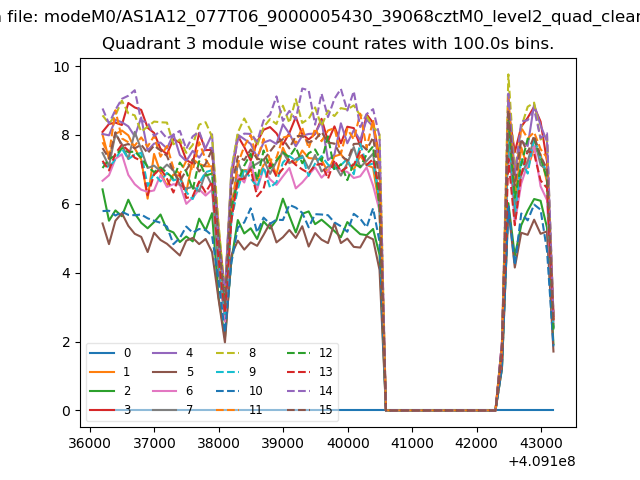
| Module-wise count rates for Quadrant A Data is divided into 100 sec bins |
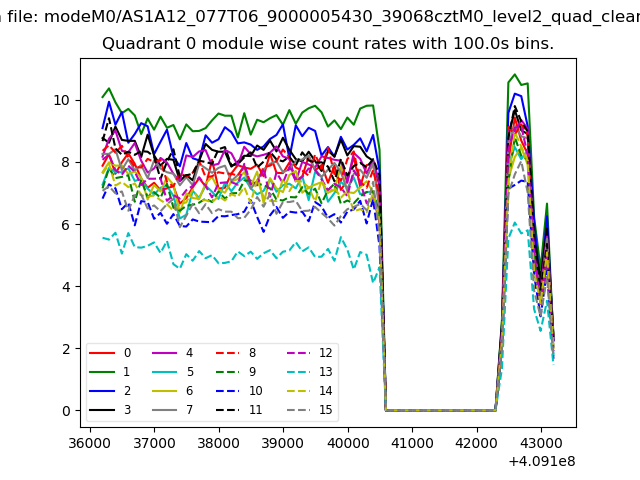 |
 |
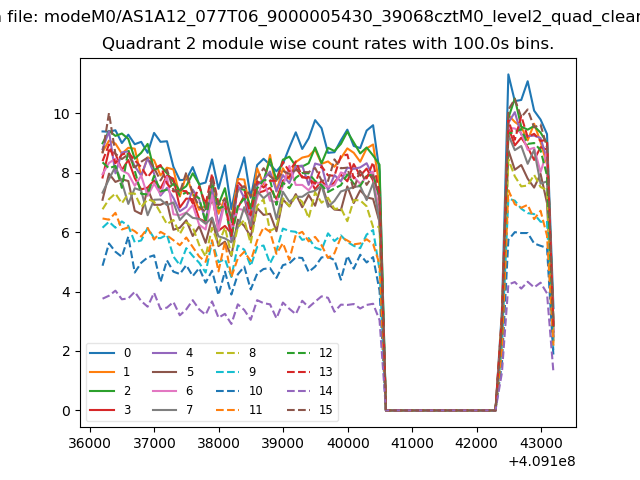
| Module-wise count rates for Quadrant B Data is divided into 100 sec bins |
 |
 |
| Module-wise count rates for Quadrant C Data is divided into 100 sec bins |
 |
 |
| Module-wise count rates for Quadrant D Data is divided into 100 sec bins |
 |
 |
| Parameter | Plot |
|---|---|
| CZT HV Monitor | 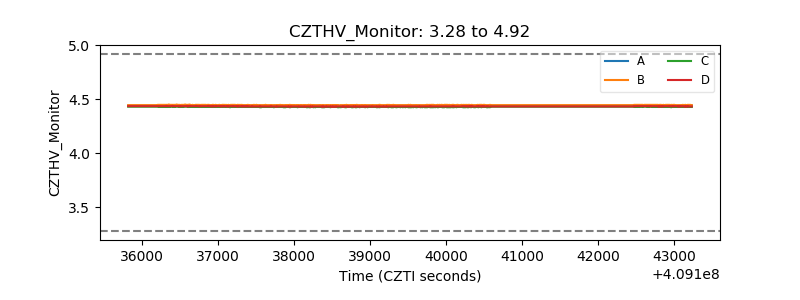 |
| D_VDD | 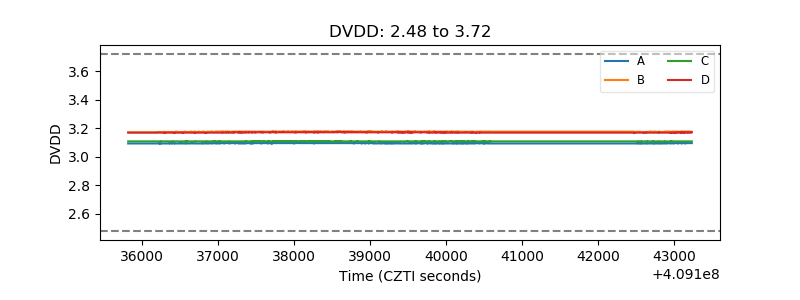 |
| Temperature 1 | 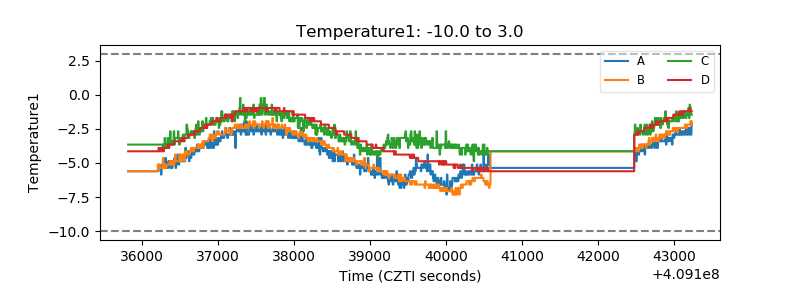 |
| Veto HV Monitor | 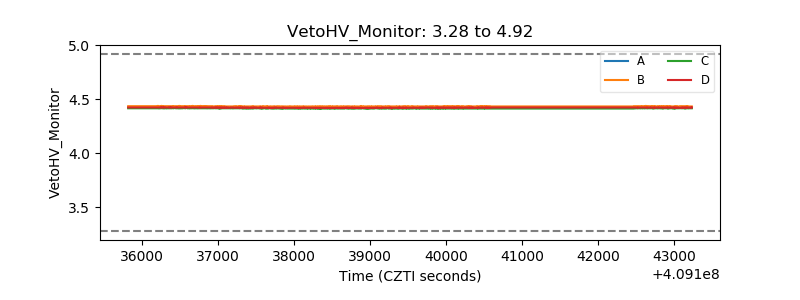 |
| Veto LLD | 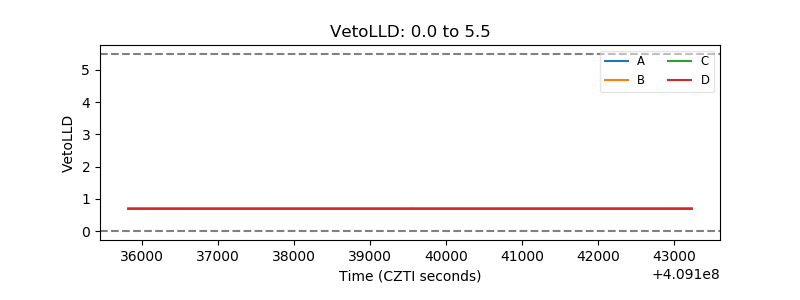 |
| Alpha Counter | 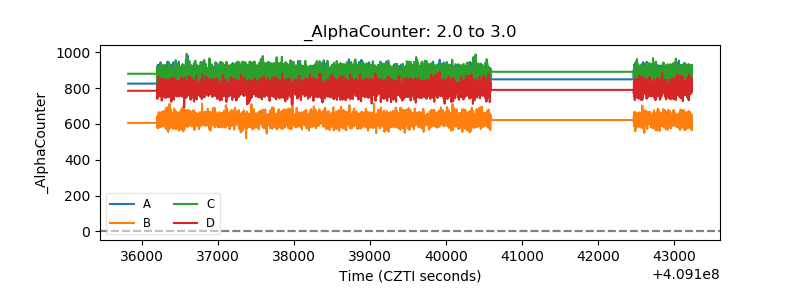 |
| _CPM_Rate | 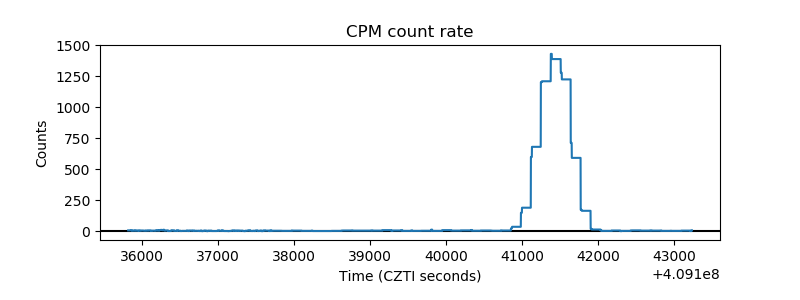 |
| CZT Counter | 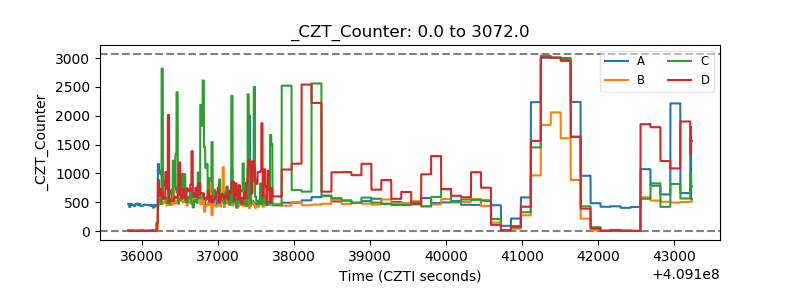 |
| +2.5 Volts monitor | 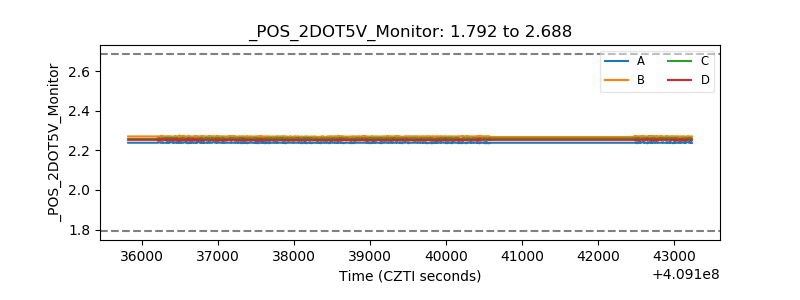 |
| +5 Volts monitor | 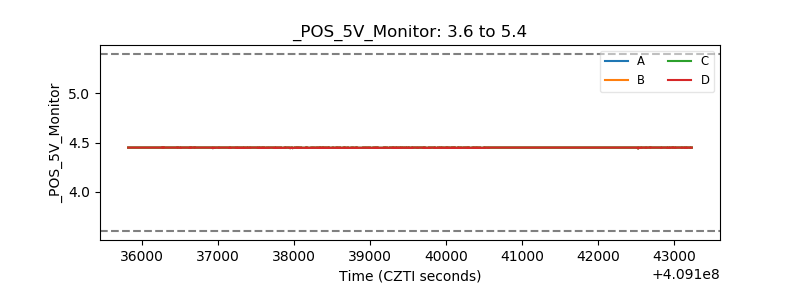 |
| _ROLL_ROT | 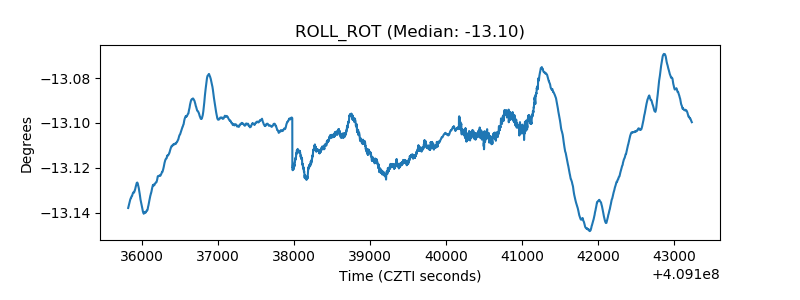 |
| _Roll_DEC | 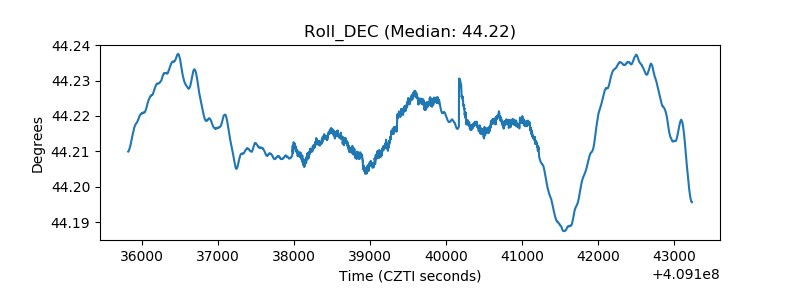 |
| _Roll_RA | 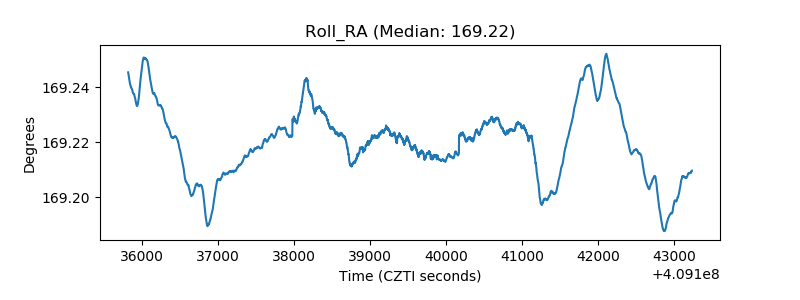 |
| Veto Counter | 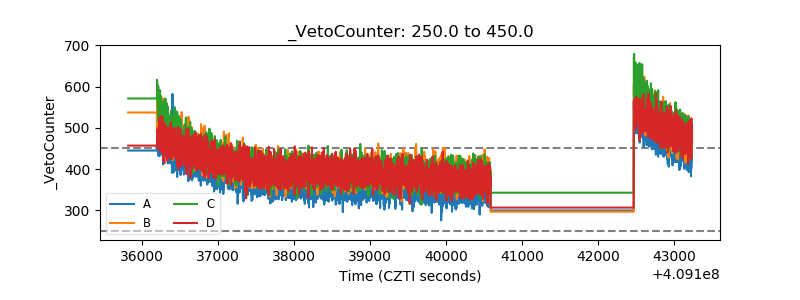 |