| Param | Original file | Final file |
|---|---|---|
| Filename | modeM0/AS1A12_077T06_9000005430_39069cztM0_level2.fits | modeM0/AS1A12_077T06_9000005430_39069cztM0_level2_quad_clean.evt |
| Size (bytes) | 289,923,840 | 55,114,560 |
| Size | 276.5 MB | 52.6 MB |
| Events in quadrant A | 2,240,126 | 373,499 |
| Events in quadrant B | 1,516,336 | 402,222 |
| Events in quadrant C | 1,922,817 | 367,441 |
| Events in quadrant D | 4,811,512 | 305,842 |
| Mode M9 | |||
|---|---|---|---|
| Quadrant | BADHDUFLAG | Total packets | Discarded packets |
| A | 0 | 7 | 0 |
| B | 0 | 7 | 0 |
| C | 0 | 7 | 0 |
| D | 0 | 8 | 0 |
| Mode M0 | |||
|---|---|---|---|
| Quadrant | BADHDUFLAG | Total packets | Discarded packets |
| A | 0 | 8550 | 1 |
| B | 0 | 6465 | 1 |
| C | 0 | 7573 | 1 |
| D | 0 | 16452 | 1 |
| Mode SS | |||
|---|---|---|---|
| Quadrant | BADHDUFLAG | Total packets | Discarded packets |
| A | 0 | 62 | 0 |
| B | 0 | 62 | 0 |
| C | 0 | 62 | 0 |
| D | 0 | 62 | 0 |
| Quadrant | Total seconds | Saturated seconds | Saturation percentage |
|---|---|---|---|
| A | 3091 | 218 | 7.052734% |
| B | 3091 | 12 | 0.388224% |
| C | 3091 | 88 | 2.846975% |
| D | 3091 | 618 | 19.993530% |
Noise dominated data is calculated using 1-second bins in cleaned event files. If a bin has >2000 counts, and if more than 50% of those come from <1% of pixels, then it is considered to be noise-dominated and hence unusable.
| Quadrant | # 1 sec bins | Bins with >0 counts | Bins with >2000 counts | High rate bins dominated by noise | Noise dominated (total time) | Noise dominated (detector-on time) | Marked lightcurve |
|---|---|---|---|---|---|---|---|
| A | 3091 | 3091 | 127 | 127 | 4.11% | 4.11% |  |
| B | 3091 | 3091 | 6 | 6 | 0.19% | 0.19% |  |
| C | 3091 | 3091 | 64 | 64 | 2.07% | 2.07% |  |
| D | 3091 | 3091 | 630 | 630 | 20.38% | 20.38% |  |
Top three noisy pixels from each quadrant. If the there are fewer than three noisy pixels in the level2.evt file, extra rows are filled as -1
| Pixel properties | Quadrant properties | ||||||
|---|---|---|---|---|---|---|---|
| Quadrant | DetID | PixID | Counts | Sigma | Mean | Median | Sigma |
| A | 15 | 222 | 489090 | 6612.88 | 362 | 355 | 73.9 |
| A | 10 | 83 | 227973 | 3079.81 | 362 | 355 | 73.9 |
| A | 15 | 223 | 64827 | 872.35 | 362 | 355 | 73.9 |
| B | 15 | 85 | 45450 | 645.61 | 366 | 357 | 69.8 |
| B | 0 | 213 | 16252 | 227.57 | 366 | 357 | 69.8 |
| B | 0 | 190 | 9007 | 123.84 | 366 | 357 | 69.8 |
| C | 15 | 208 | 389299 | 4612.76 | 357 | 360 | 84.3 |
| C | 15 | 214 | 129217 | 1528.23 | 357 | 360 | 84.3 |
| C | 3 | 233 | 4312 | 46.87 | 357 | 360 | 84.3 |
| D | 12 | 235 | 2803992 | 33000.12 | 347 | 338 | 85.0 |
| D | 2 | 249 | 242385 | 2848.99 | 347 | 338 | 85.0 |
| D | 12 | 233 | 227802 | 2677.34 | 347 | 338 | 85.0 |
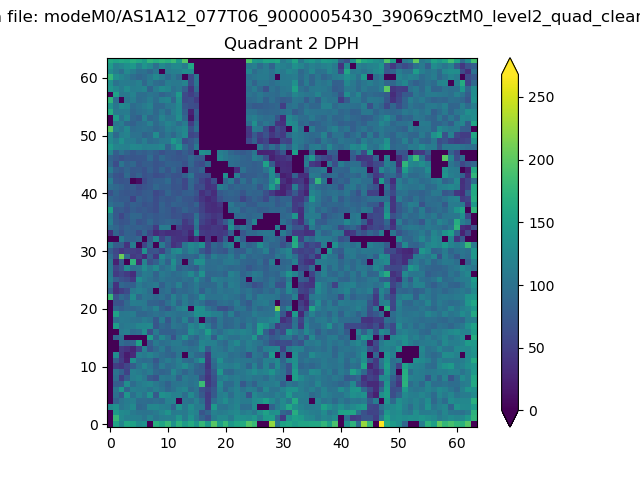
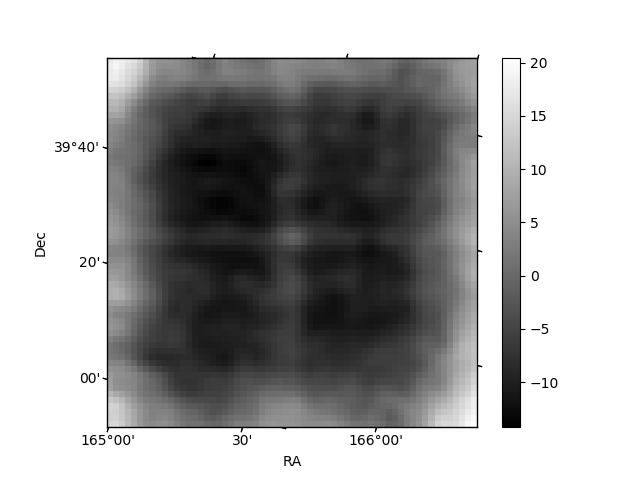
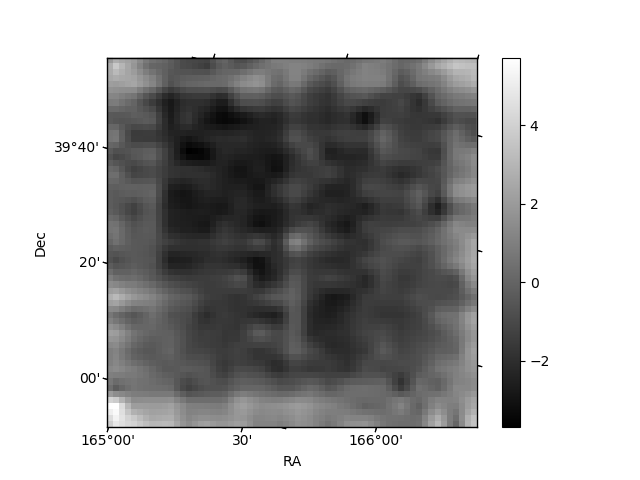
Histogram calculated using DETX and DETY for each event in the final _common_clean file
| Quadrant A | 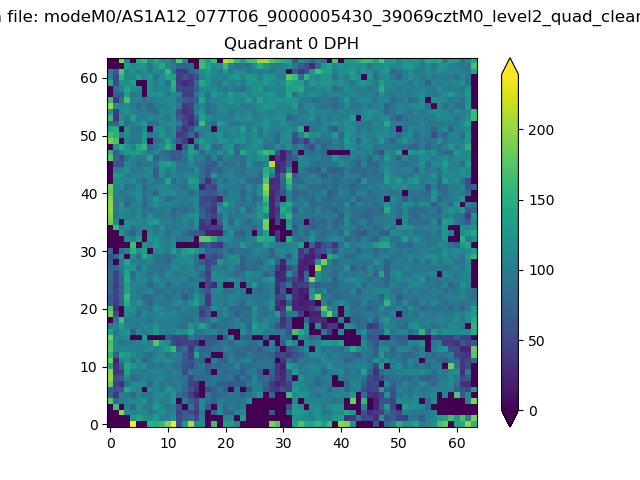 |
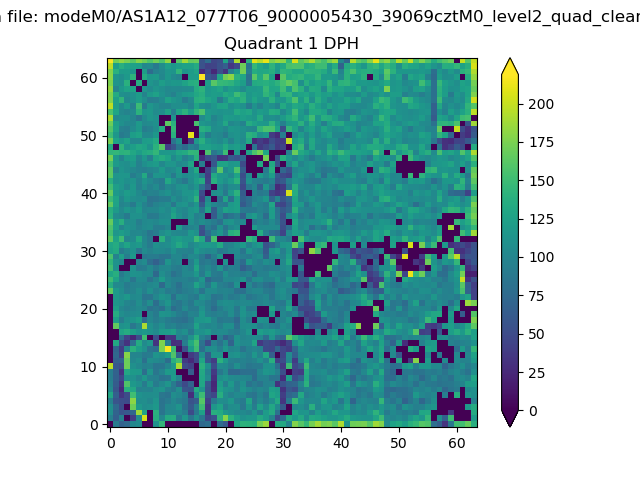 |
Quadrant B |
|---|---|---|---|
| Quadrant D | 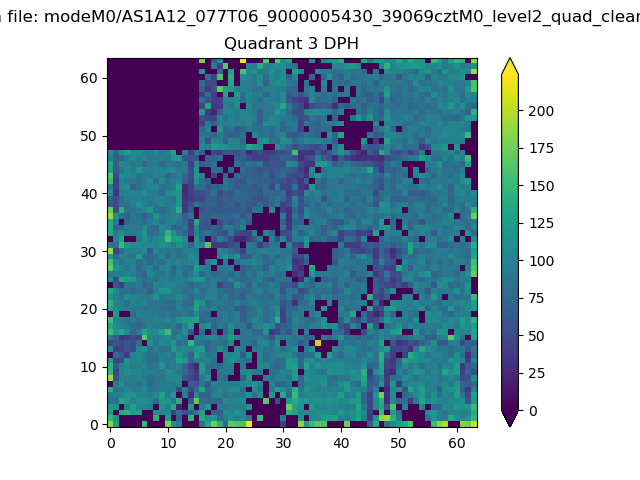 |
 |
Quadrant C |
| Plot type | Count rate plots | Images |
|---|---|---|
| Comparison with Poisson distribution Blue bars denote a histogram of data divided into 1 sec bins. Red curve is a Poisson curve with rate = median count rate of data. |
 |
 |
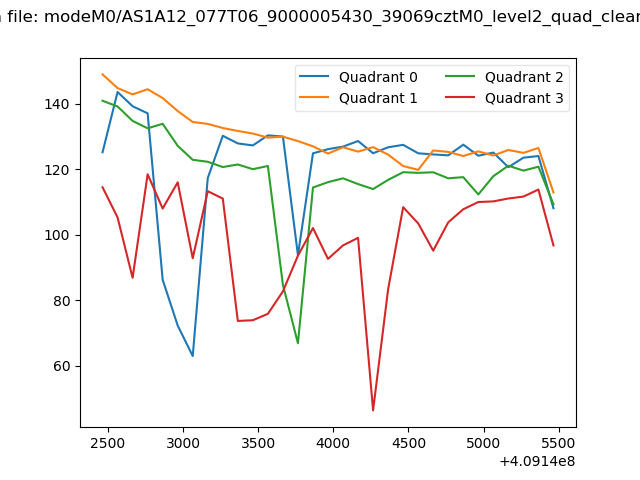
| Quadrant-wise count rates Data is divided into 100 sec bins |
 |
|
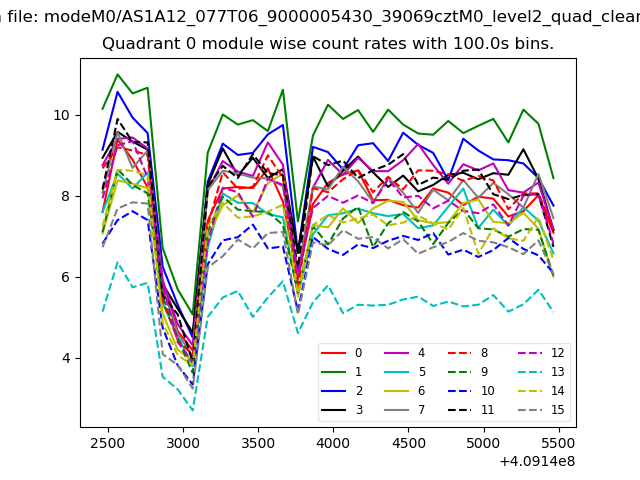
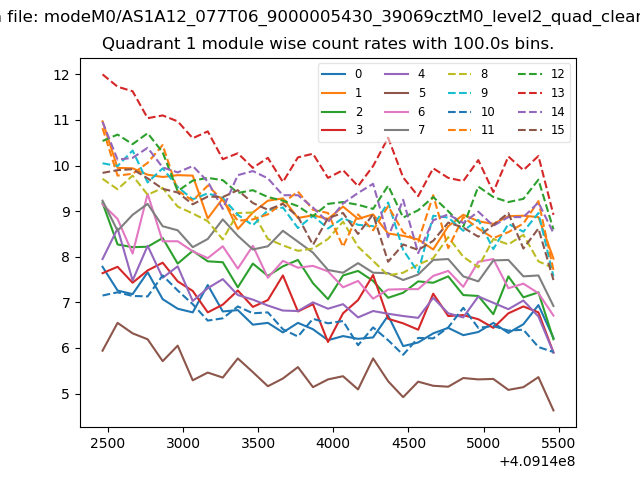
| Module-wise count rates for Quadrant A Data is divided into 100 sec bins |
 |
 |
| Module-wise count rates for Quadrant B Data is divided into 100 sec bins |
 |
 |
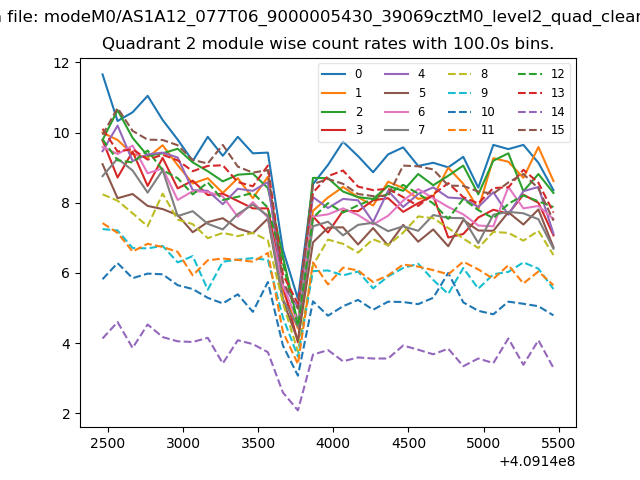
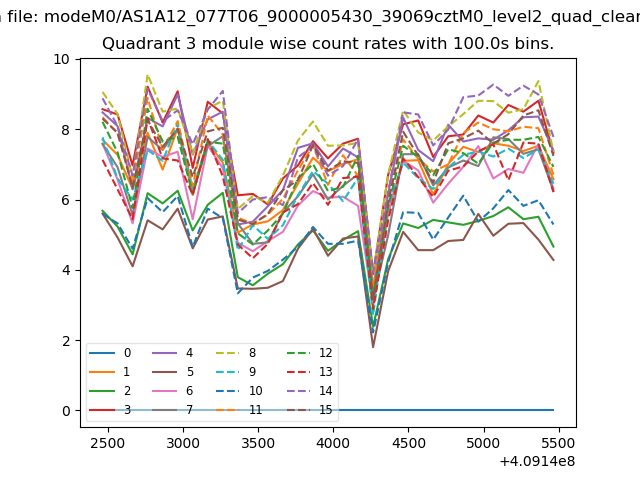
| Module-wise count rates for Quadrant C Data is divided into 100 sec bins |
 |
 |
| Module-wise count rates for Quadrant D Data is divided into 100 sec bins |
 |
 |
| Parameter | Plot |
|---|---|
| CZT HV Monitor | 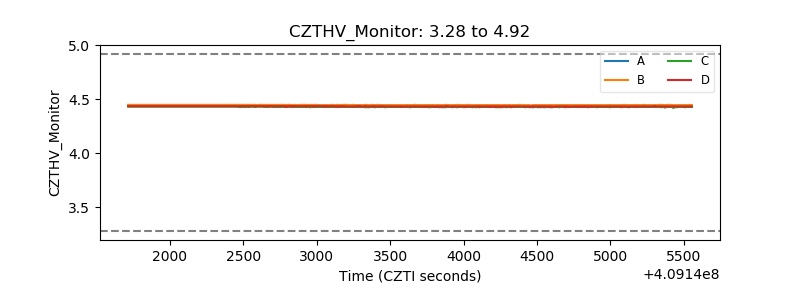 |
| D_VDD | 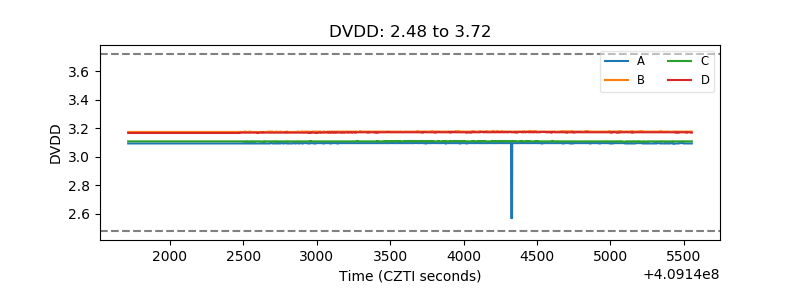 |
| Temperature 1 | 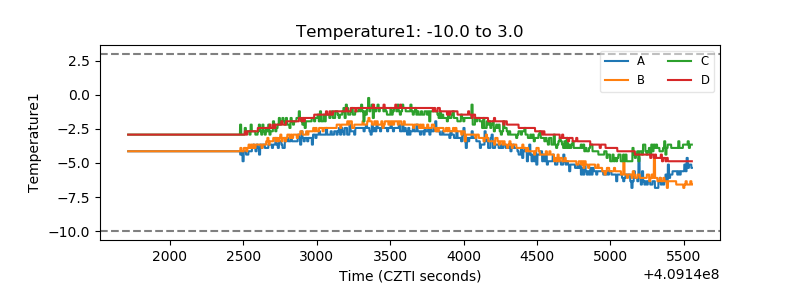 |
| Veto HV Monitor | 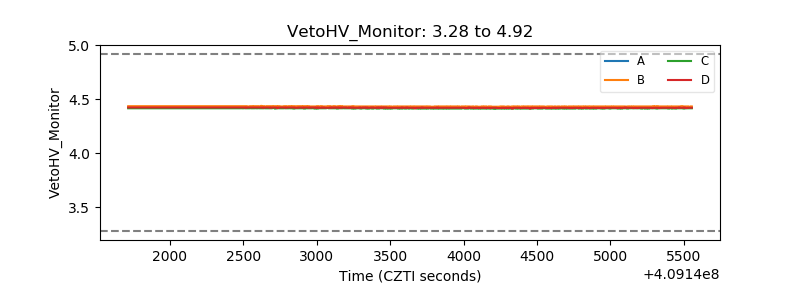 |
| Veto LLD | 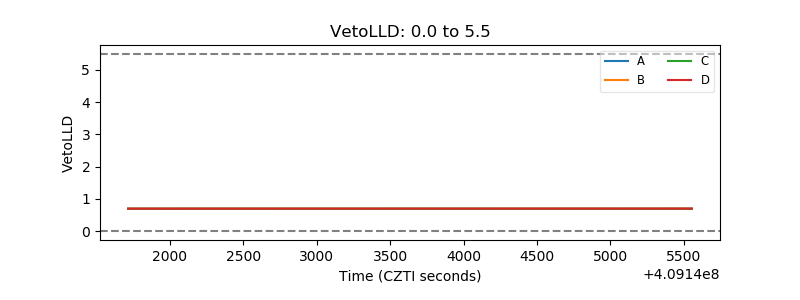 |
| Alpha Counter | 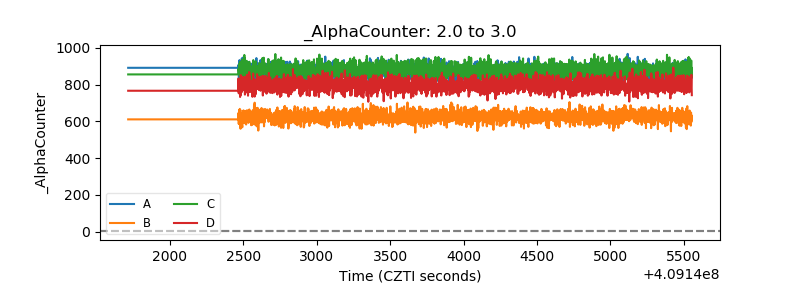 |
| _CPM_Rate | 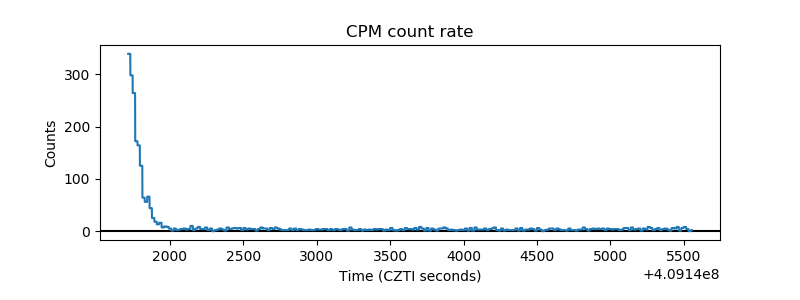 |
| CZT Counter | 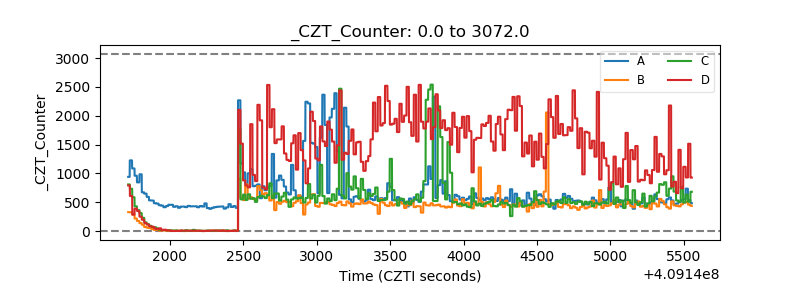 |
| +2.5 Volts monitor | 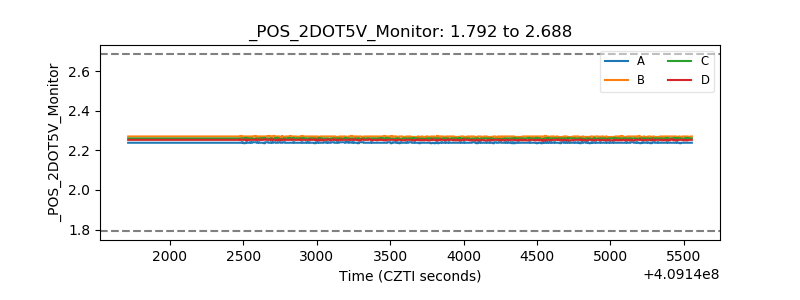 |
| +5 Volts monitor | 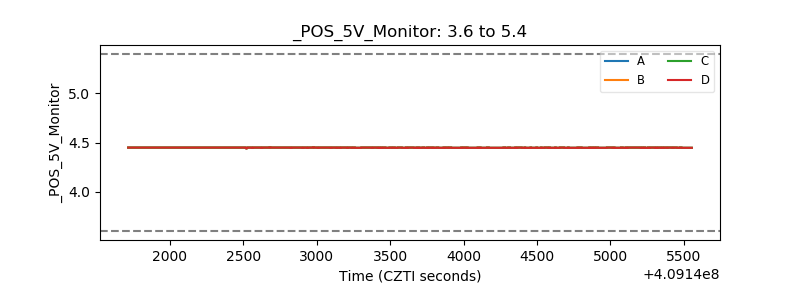 |
| _ROLL_ROT | 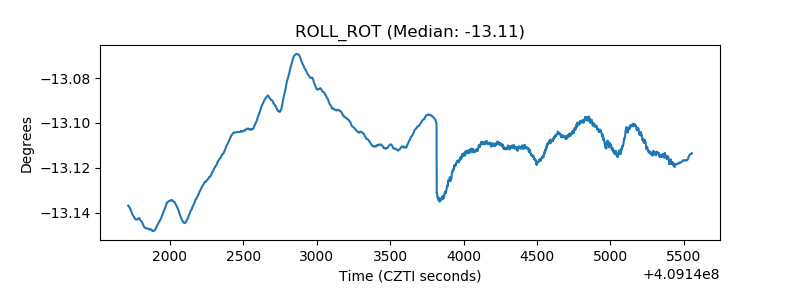 |
| _Roll_DEC | 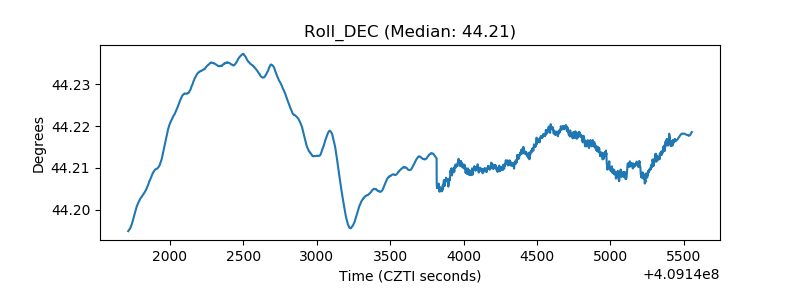 |
| _Roll_RA | 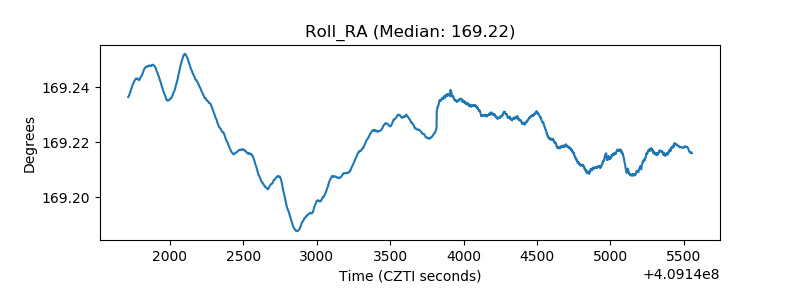 |
| Veto Counter | 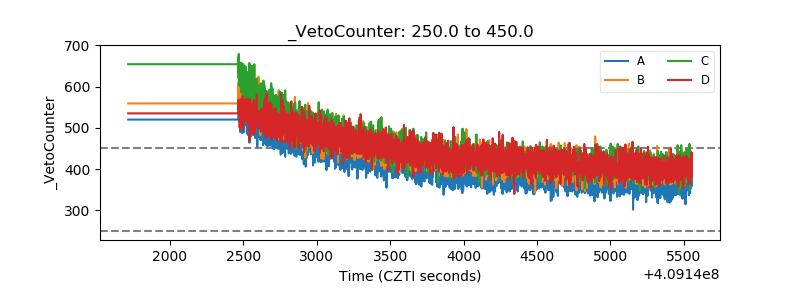 |