| Param | Original file | Final file |
|---|---|---|
| Filename | modeM0/AS1T05_067T01_9000005432_39069cztM0_level2.fits | modeM0/AS1T05_067T01_9000005432_39069cztM0_level2_quad_clean.evt |
| Size (bytes) | 76,173,120 | 15,477,120 |
| Size | 72.6 MB | 14.8 MB |
| Events in quadrant A | 928,573 | 83,496 |
| Events in quadrant B | 432,820 | 117,861 |
| Events in quadrant C | 533,231 | 109,430 |
| Events in quadrant D | 859,665 | 95,080 |
| Mode M0 | |||
|---|---|---|---|
| Quadrant | BADHDUFLAG | Total packets | Discarded packets |
| A | 0 | 3378 | 2 |
| B | 0 | 1728 | 1 |
| C | 0 | 2177 | 1 |
| D | 0 | 3134 | 1 |
| Mode SS | |||
|---|---|---|---|
| Quadrant | BADHDUFLAG | Total packets | Discarded packets |
| A | 0 | 16 | 0 |
| B | 0 | 16 | 0 |
| C | 0 | 16 | 0 |
| D | 0 | 16 | 0 |
| Mode M9 | |||
|---|---|---|---|
| Quadrant | BADHDUFLAG | Total packets | Discarded packets |
| A | 0 | 16 | 0 |
| B | 0 | 16 | 0 |
| C | 0 | 16 | 0 |
| D | 0 | 16 | 0 |
| Quadrant | Total seconds | Saturated seconds | Saturation percentage |
|---|---|---|---|
| A | 799 | 239 | 29.912390% |
| B | 799 | 1 | 0.125156% |
| C | 799 | 6 | 0.750939% |
| D | 799 | 66 | 8.260325% |
Noise dominated data is calculated using 1-second bins in cleaned event files. If a bin has >2000 counts, and if more than 50% of those come from <1% of pixels, then it is considered to be noise-dominated and hence unusable.
| Quadrant | # 1 sec bins | Bins with >0 counts | Bins with >2000 counts | High rate bins dominated by noise | Noise dominated (total time) | Noise dominated (detector-on time) | Marked lightcurve |
|---|---|---|---|---|---|---|---|
| A | 799 | 799 | 133 | 133 | 16.65% | 16.65% | 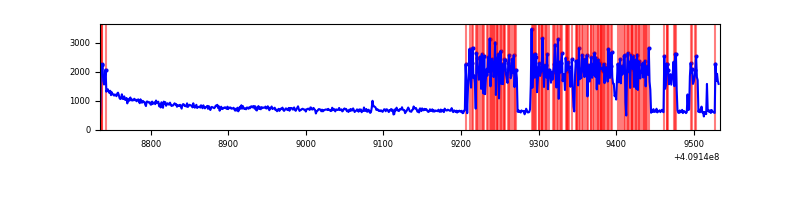 |
| B | 799 | 799 | 0 | 0 | 0.00% | 0.00% | 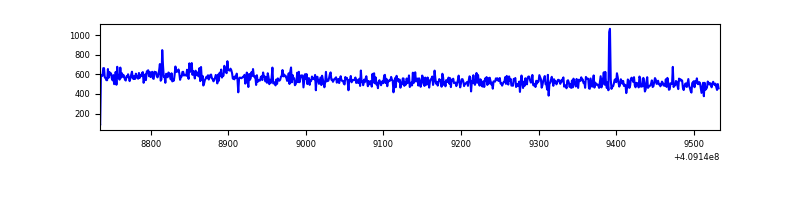 |
| C | 799 | 799 | 3 | 3 | 0.38% | 0.38% | 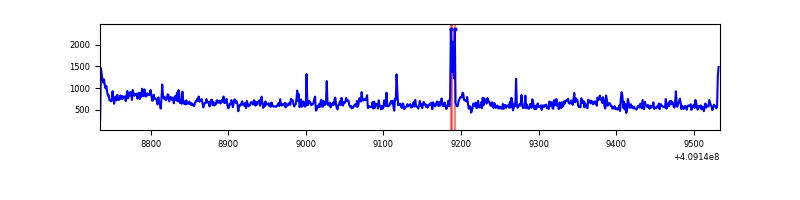 |
| D | 799 | 799 | 48 | 48 | 6.01% | 6.01% | 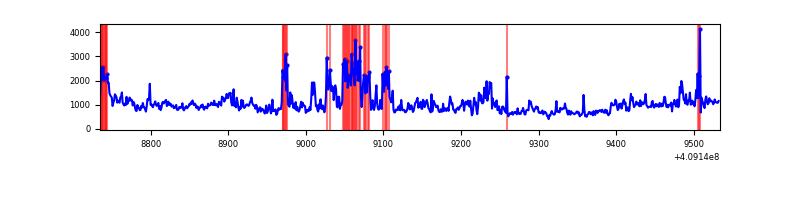 |
Top three noisy pixels from each quadrant. If the there are fewer than three noisy pixels in the level2.evt file, extra rows are filled as -1
| Pixel properties | Quadrant properties | ||||||
|---|---|---|---|---|---|---|---|
| Quadrant | DetID | PixID | Counts | Sigma | Mean | Median | Sigma |
| A | 15 | 222 | 426502 | 19374.9 | 99 | 97 | 22.0 |
| A | 10 | 83 | 113835 | 5168.0 | 99 | 97 | 22.0 |
| A | 9 | 143 | 2067 | 89.51 | 99 | 97 | 22.0 |
| B | 0 | 190 | 7598 | 326.59 | 107 | 105 | 22.9 |
| B | 12 | 111 | 2527 | 105.56 | 107 | 105 | 22.9 |
| B | 11 | 111 | 2336 | 97.24 | 107 | 105 | 22.9 |
| C | 15 | 208 | 84316 | 3266.13 | 103 | 104 | 25.8 |
| C | 15 | 214 | 38822 | 1501.66 | 103 | 104 | 25.8 |
| C | 3 | 233 | 4209 | 159.21 | 103 | 104 | 25.8 |
| D | 12 | 235 | 290040 | 10969.16 | 102 | 99 | 26.4 |
| D | 12 | 233 | 136452 | 5158.56 | 102 | 99 | 26.4 |
| D | 2 | 249 | 17895 | 673.26 | 102 | 99 | 26.4 |
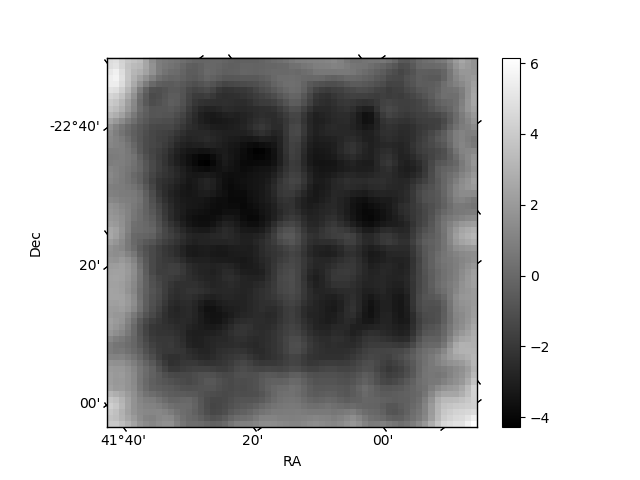
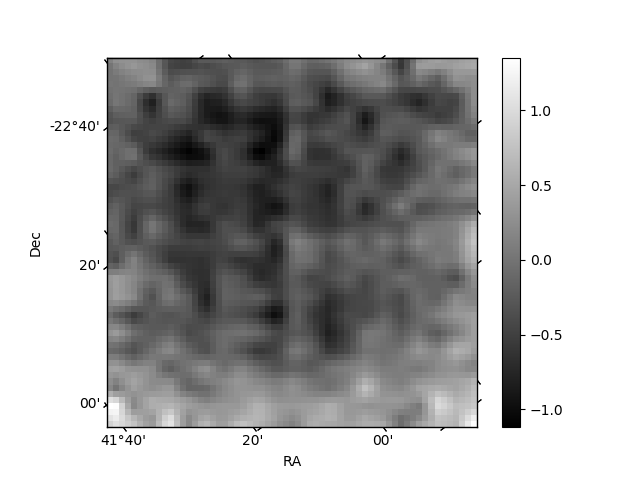
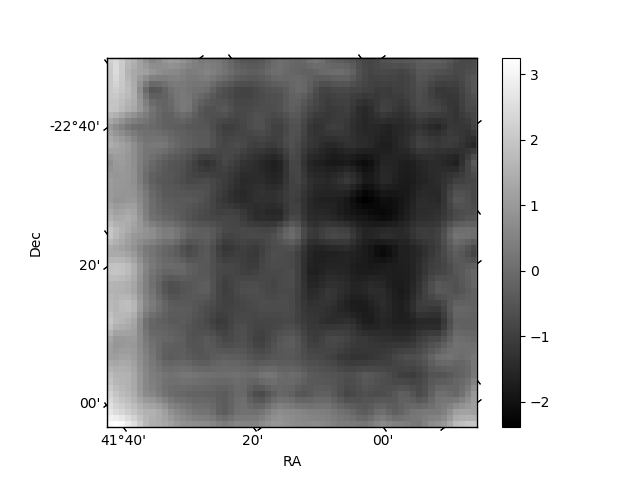
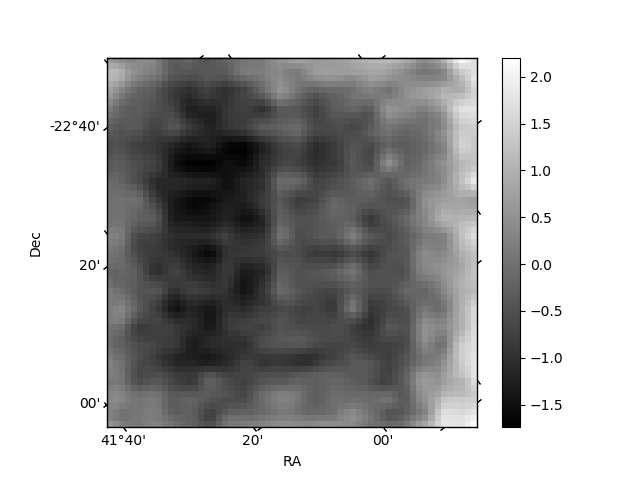
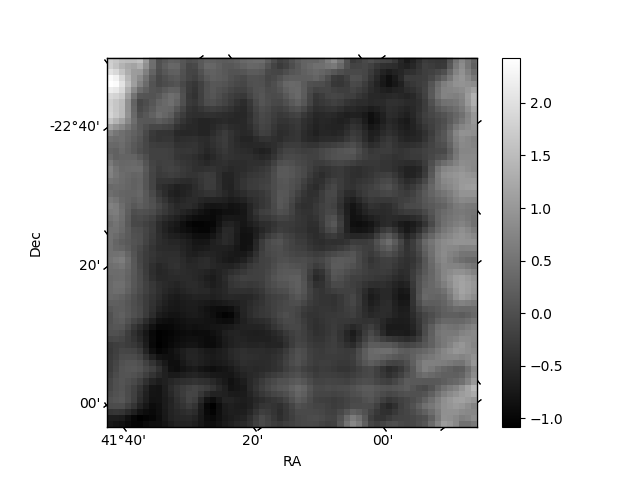
Histogram calculated using DETX and DETY for each event in the final _common_clean file
| Quadrant A | 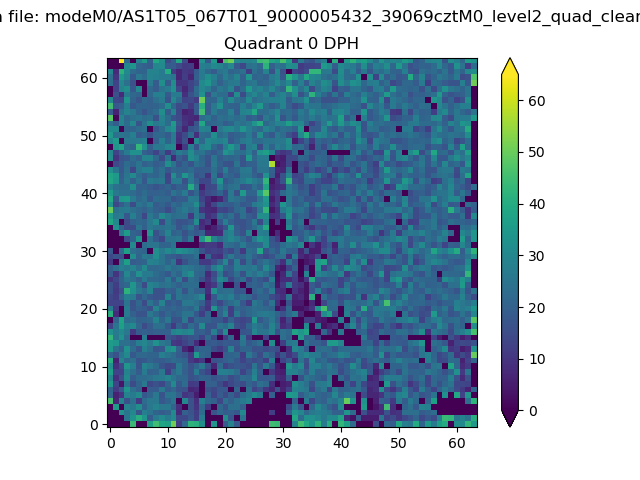 |
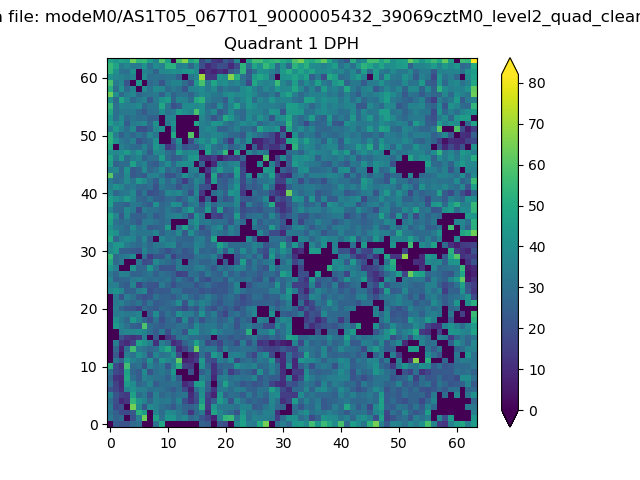 |
Quadrant B |
|---|---|---|---|
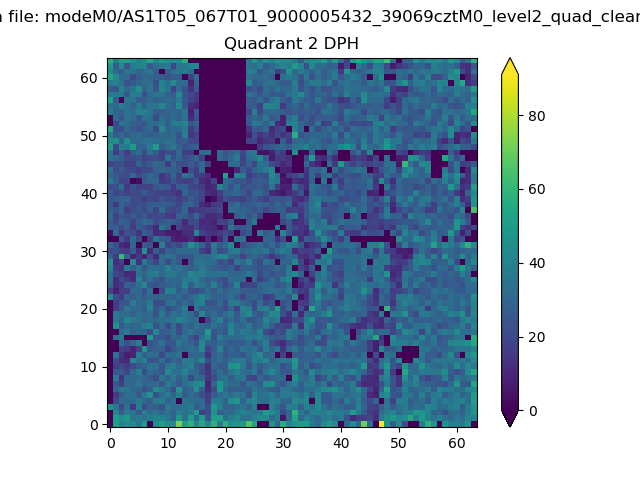
| Quadrant D | 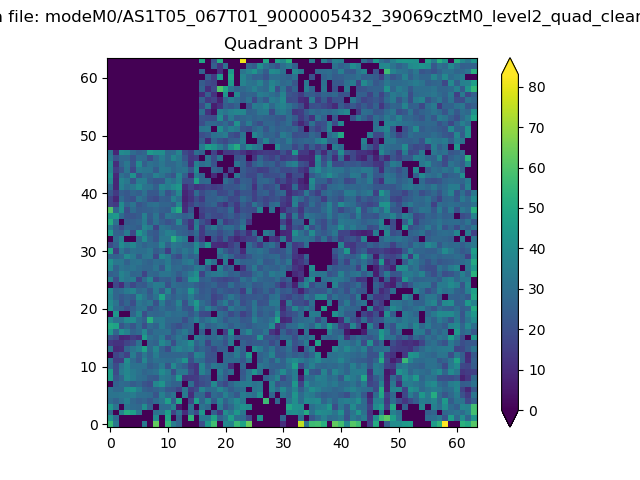 |
 |
Quadrant C |
| Plot type | Count rate plots | Images |
|---|---|---|
| Comparison with Poisson distribution Blue bars denote a histogram of data divided into 1 sec bins. Red curve is a Poisson curve with rate = median count rate of data. |
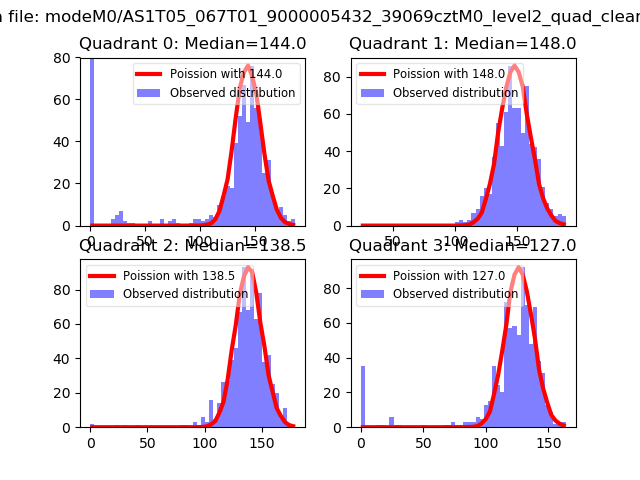 |
 |
| Quadrant-wise count rates Data is divided into 100 sec bins |
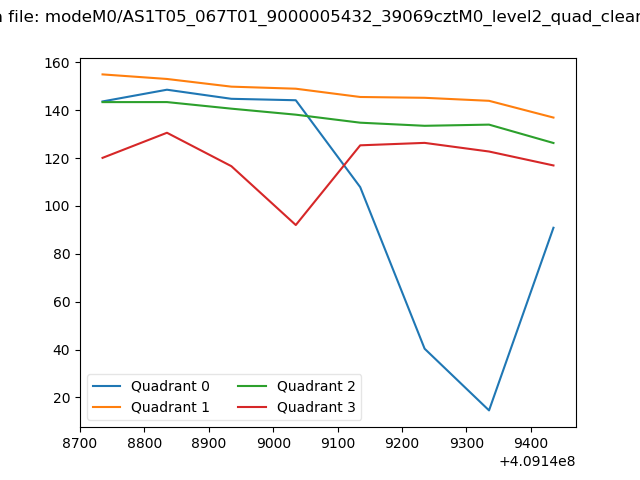 |
|
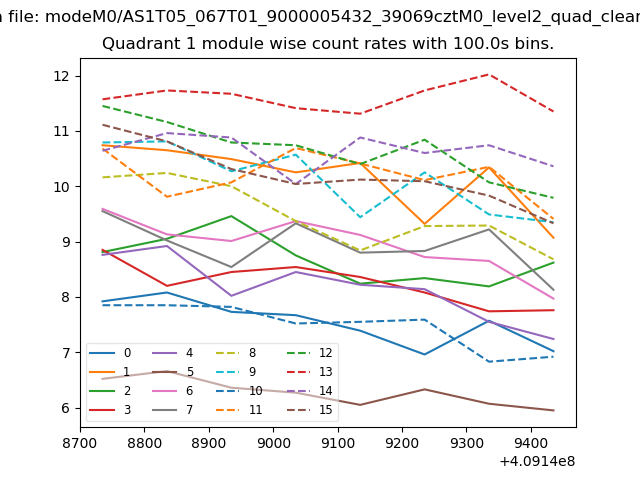
| Module-wise count rates for Quadrant A Data is divided into 100 sec bins |
 |
 |
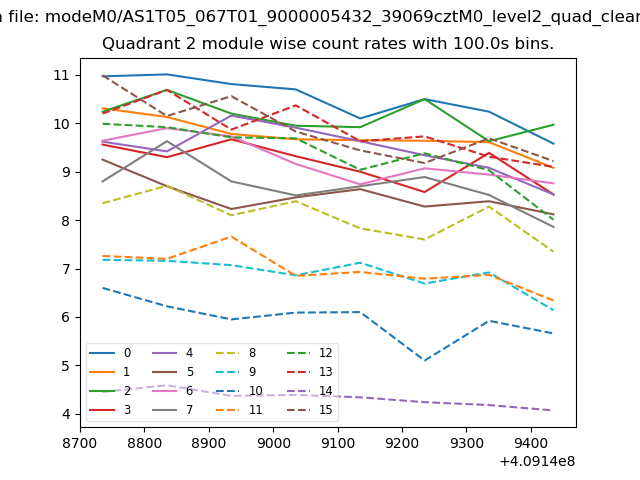
| Module-wise count rates for Quadrant B Data is divided into 100 sec bins |
 |
 |
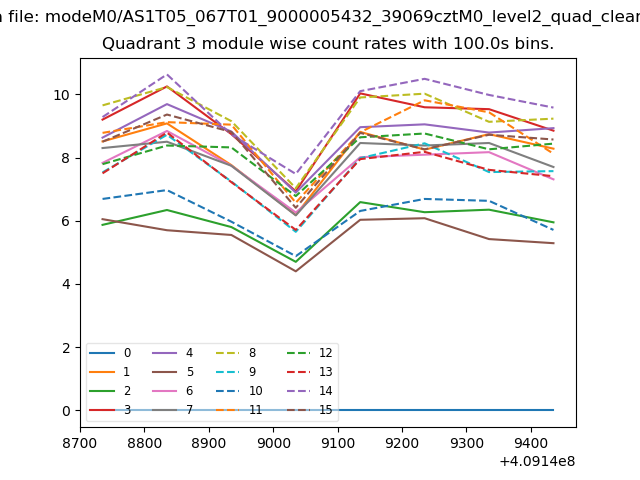
| Module-wise count rates for Quadrant C Data is divided into 100 sec bins |
 |
 |
| Module-wise count rates for Quadrant D Data is divided into 100 sec bins |
 |
 |
| Parameter | Plot |
|---|---|
| CZT HV Monitor | 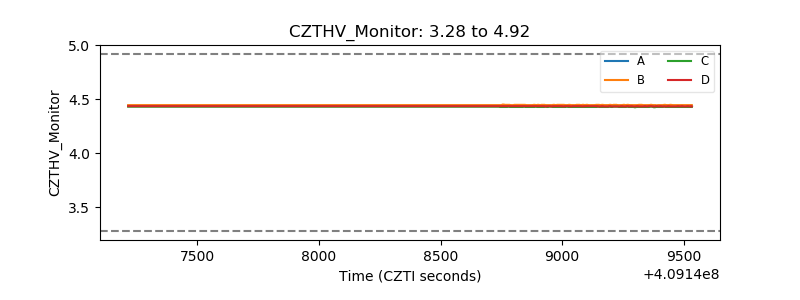 |
| D_VDD | 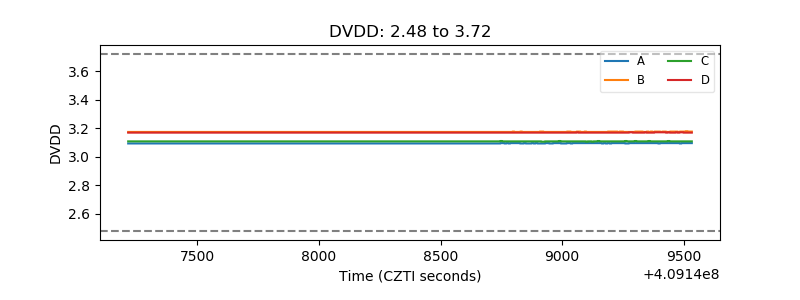 |
| Temperature 1 | 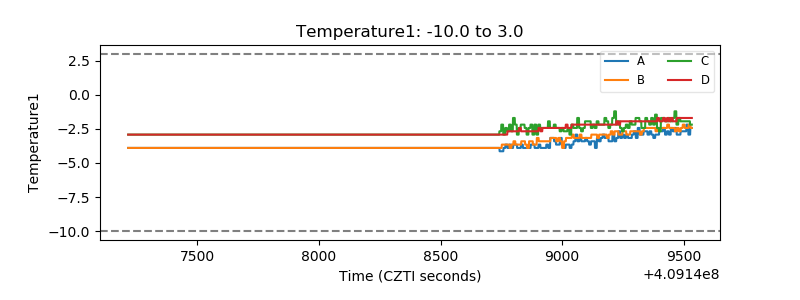 |
| Veto HV Monitor | 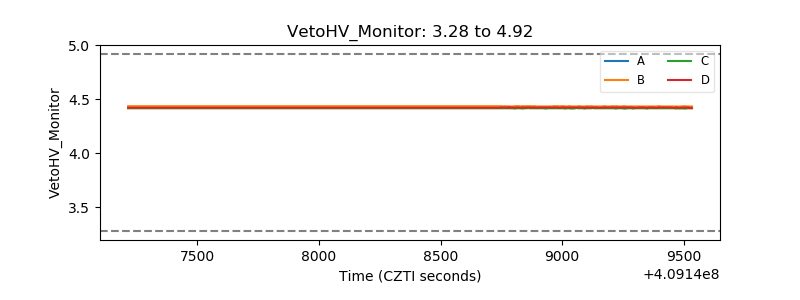 |
| Veto LLD | 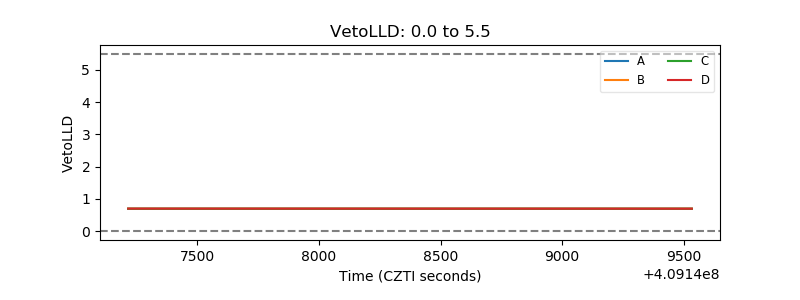 |
| Alpha Counter | 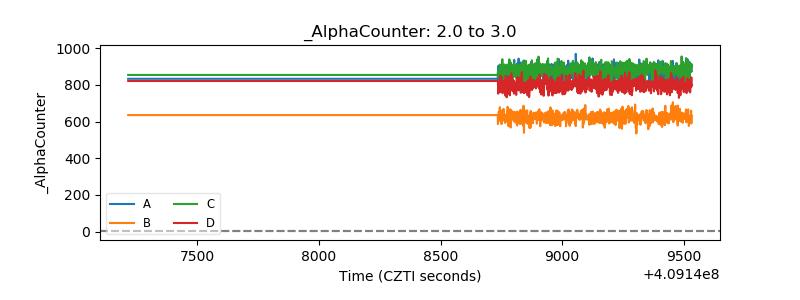 |
| _CPM_Rate | 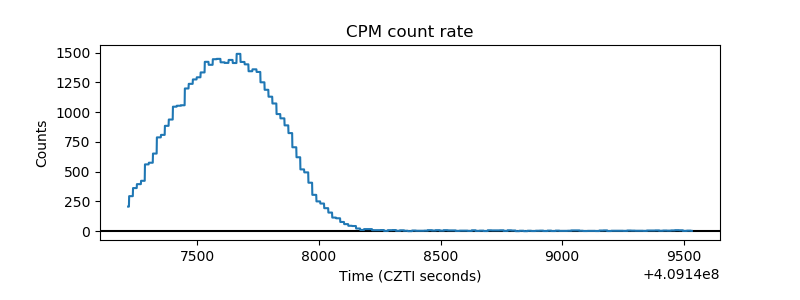 |
| CZT Counter | 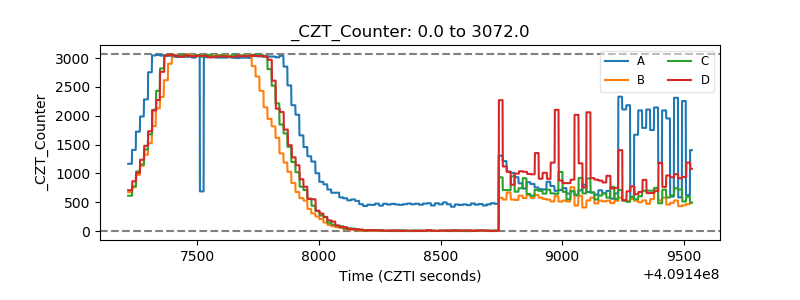 |
| +2.5 Volts monitor | 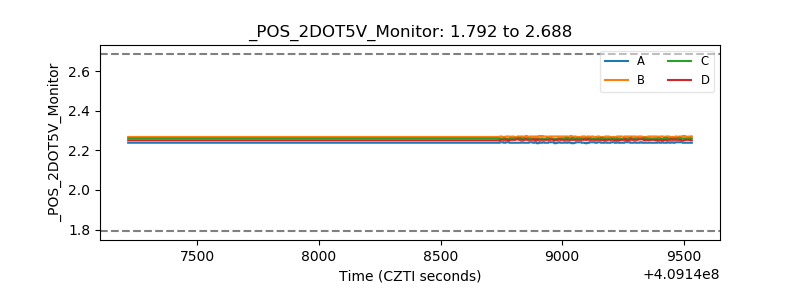 |
| +5 Volts monitor | 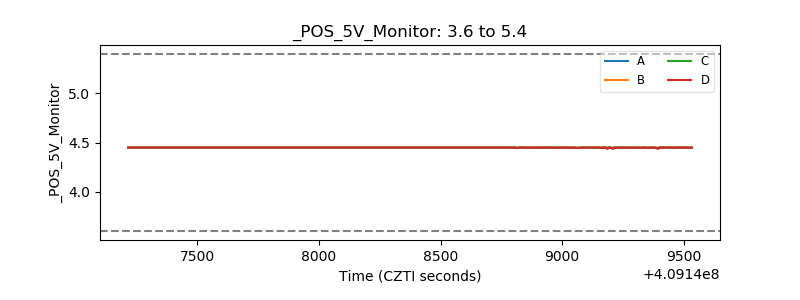 |
| _ROLL_ROT | 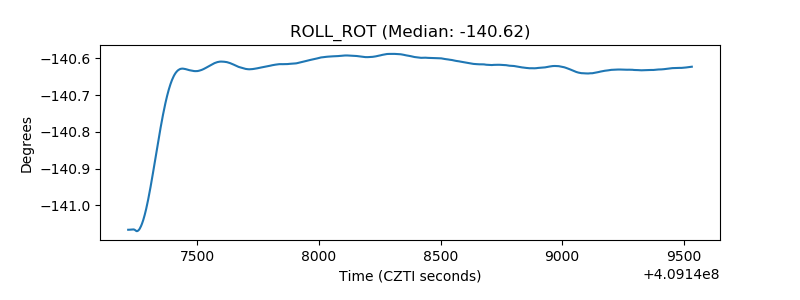 |
| _Roll_DEC | 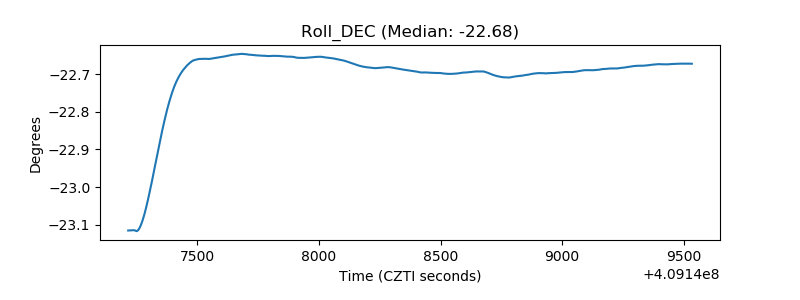 |
| _Roll_RA | 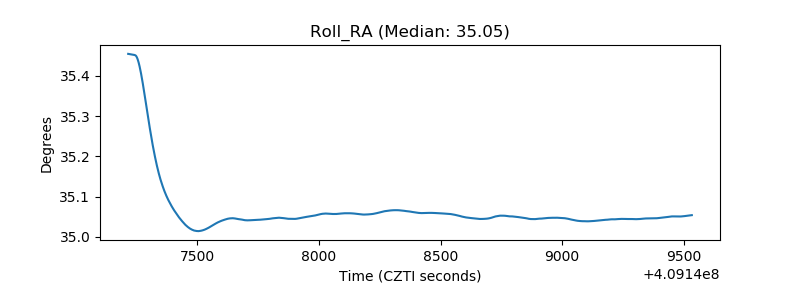 |
| Veto Counter | 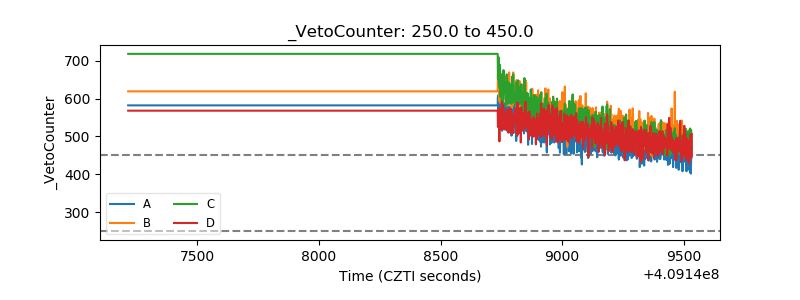 |