| Param | Original file | Final file |
|---|---|---|
| Filename | modeM0/AS1T05_067T01_9000005432_39070cztM0_level2.fits | modeM0/AS1T05_067T01_9000005432_39070cztM0_level2_quad_clean.evt |
| Size (bytes) | 510,338,880 | 95,526,720 |
| Size | 486.7 MB | 91.1 MB |
| Events in quadrant A | 4,086,057 | 659,366 |
| Events in quadrant B | 2,570,548 | 715,732 |
| Events in quadrant C | 3,758,702 | 649,563 |
| Events in quadrant D | 8,059,253 | 492,341 |
| Mode M0 | |||
|---|---|---|---|
| Quadrant | BADHDUFLAG | Total packets | Discarded packets |
| A | 0 | 15859 | 3 |
| B | 0 | 10966 | 2 |
| C | 0 | 14626 | 2 |
| D | 0 | 27724 | 2 |
| Mode SS | |||
|---|---|---|---|
| Quadrant | BADHDUFLAG | Total packets | Discarded packets |
| A | 0 | 108 | 0 |
| B | 0 | 108 | 0 |
| C | 0 | 108 | 0 |
| D | 0 | 108 | 0 |
| Mode M9 | |||
|---|---|---|---|
| Quadrant | BADHDUFLAG | Total packets | Discarded packets |
| A | 0 | 31 | 0 |
| B | 0 | 31 | 0 |
| C | 0 | 31 | 0 |
| D | 0 | 32 | 0 |
| Quadrant | Total seconds | Saturated seconds | Saturation percentage |
|---|---|---|---|
| A | 5372 | 384 | 7.148176% |
| B | 5372 | 5 | 0.093075% |
| C | 5372 | 218 | 4.058079% |
| D | 5372 | 1264 | 23.529412% |
Noise dominated data is calculated using 1-second bins in cleaned event files. If a bin has >2000 counts, and if more than 50% of those come from <1% of pixels, then it is considered to be noise-dominated and hence unusable.
| Quadrant | # 1 sec bins | Bins with >0 counts | Bins with >2000 counts | High rate bins dominated by noise | Noise dominated (total time) | Noise dominated (detector-on time) | Marked lightcurve |
|---|---|---|---|---|---|---|---|
| A | 7465 | 5373 | 233 | 233 | 3.12% | 4.34% | 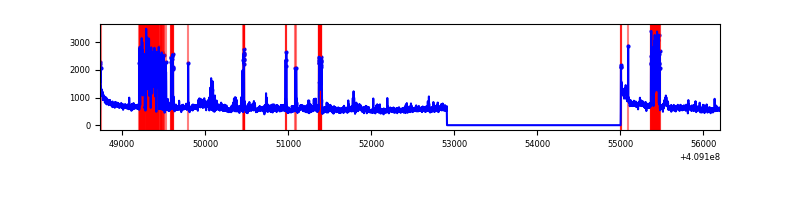 |
| B | 7465 | 5373 | 1 | 1 | 0.01% | 0.02% | 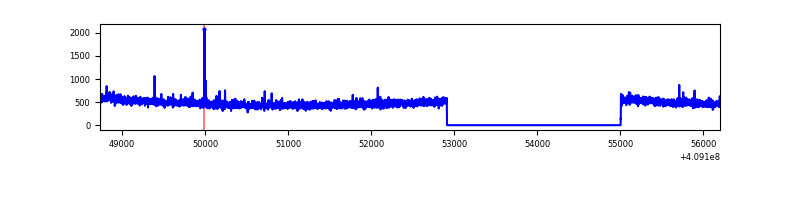 |
| C | 7465 | 5373 | 128 | 128 | 1.71% | 2.38% | 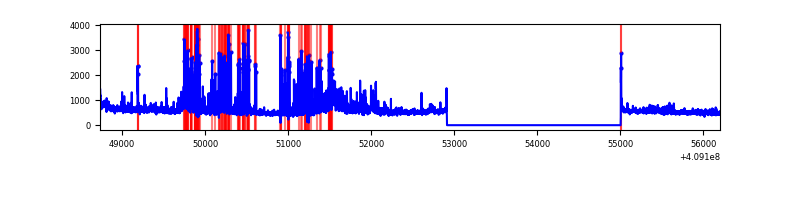 |
| D | 7465 | 5373 | 1450 | 1450 | 19.42% | 26.99% | 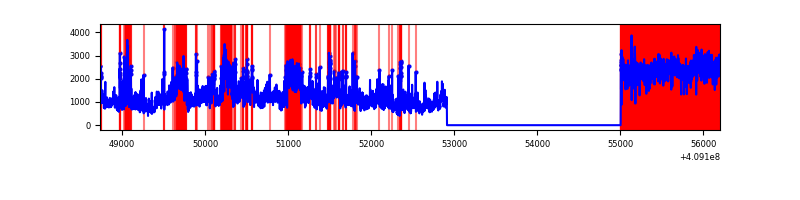 |
Top three noisy pixels from each quadrant. If the there are fewer than three noisy pixels in the level2.evt file, extra rows are filled as -1
| Pixel properties | Quadrant properties | ||||||
|---|---|---|---|---|---|---|---|
| Quadrant | DetID | PixID | Counts | Sigma | Mean | Median | Sigma |
| A | 15 | 222 | 1059055 | 8298.39 | 632 | 619 | 127.5 |
| A | 10 | 83 | 419947 | 3287.63 | 632 | 619 | 127.5 |
| A | 15 | 223 | 130052 | 1014.79 | 632 | 619 | 127.5 |
| B | 0 | 190 | 41287 | 330.38 | 642 | 628 | 123.1 |
| B | 12 | 111 | 15044 | 117.14 | 642 | 628 | 123.1 |
| B | 11 | 111 | 13605 | 105.45 | 642 | 628 | 123.1 |
| C | 15 | 208 | 1076628 | 7679.11 | 605 | 611 | 140.1 |
| C | 15 | 214 | 223808 | 1592.87 | 605 | 611 | 140.1 |
| C | 3 | 233 | 93048 | 659.69 | 605 | 611 | 140.1 |
| D | 12 | 235 | 5067879 | 35885.12 | 579 | 562 | 141.2 |
| D | 12 | 233 | 314046 | 2219.99 | 579 | 562 | 141.2 |
| D | 2 | 249 | 168120 | 1186.59 | 579 | 562 | 141.2 |
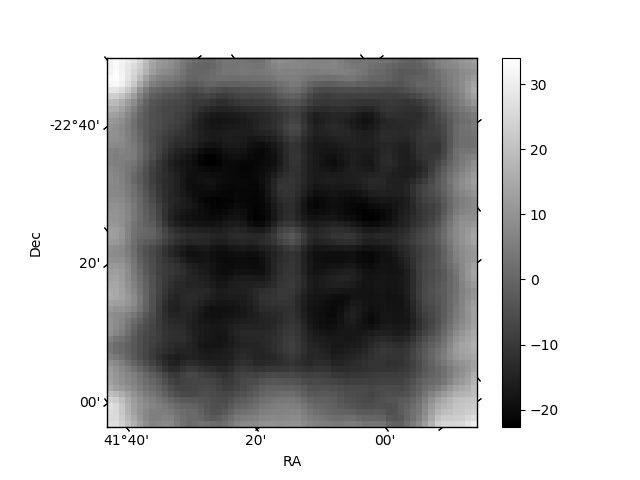
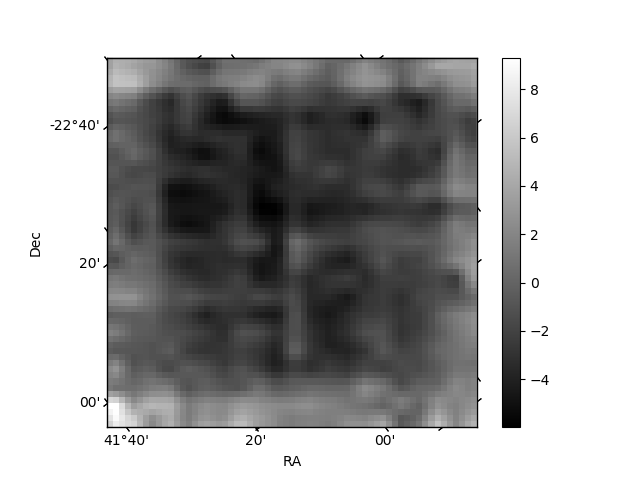
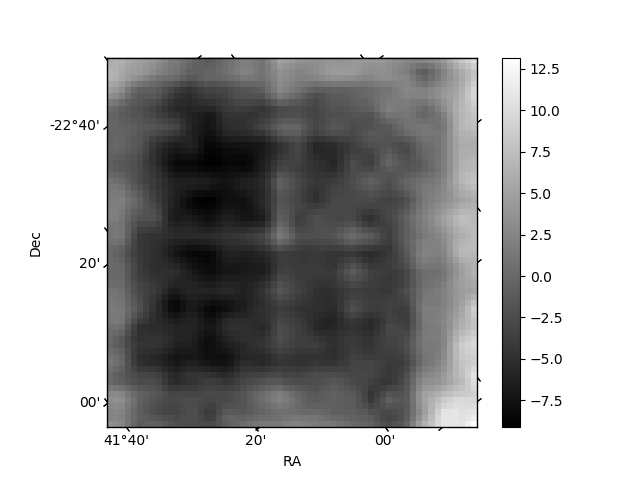
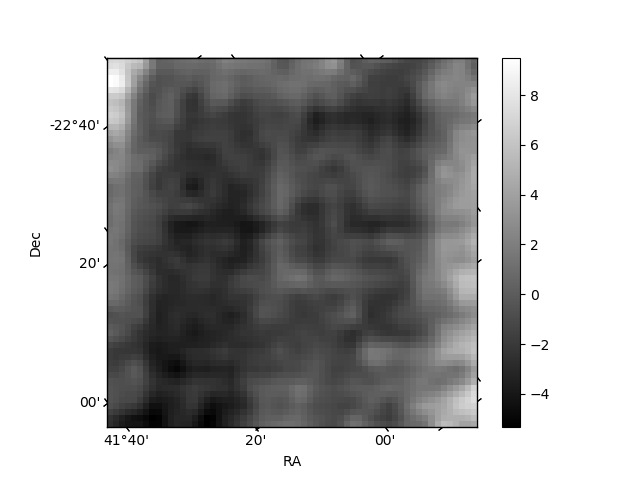
Histogram calculated using DETX and DETY for each event in the final _common_clean file
| Quadrant A | 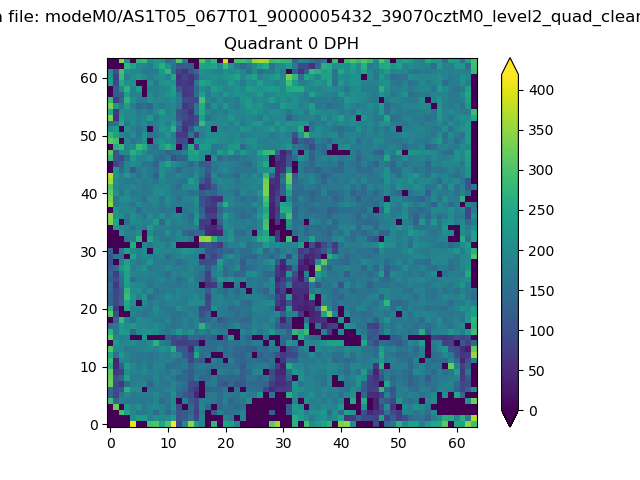 |
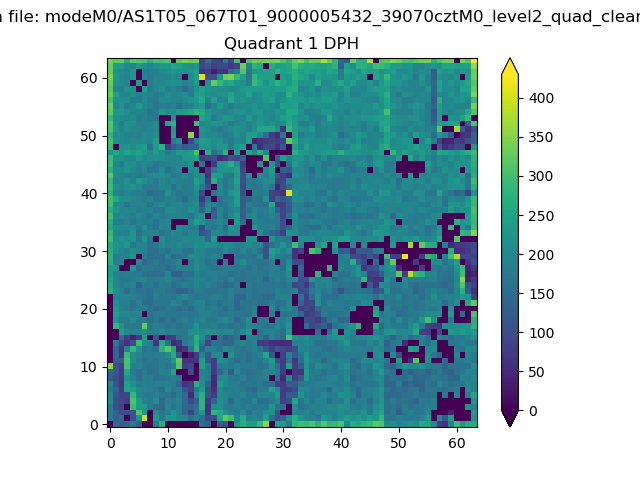 |
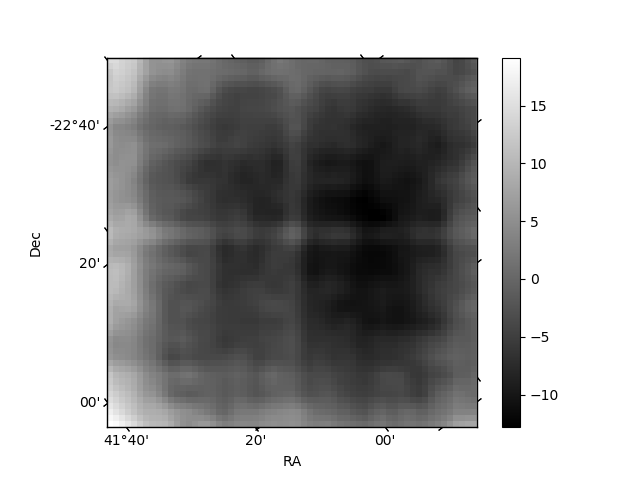
Quadrant B |
|---|---|---|---|
| Quadrant D | 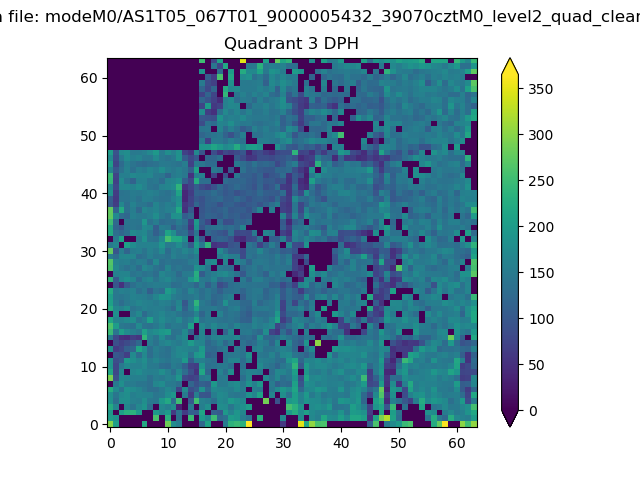 |
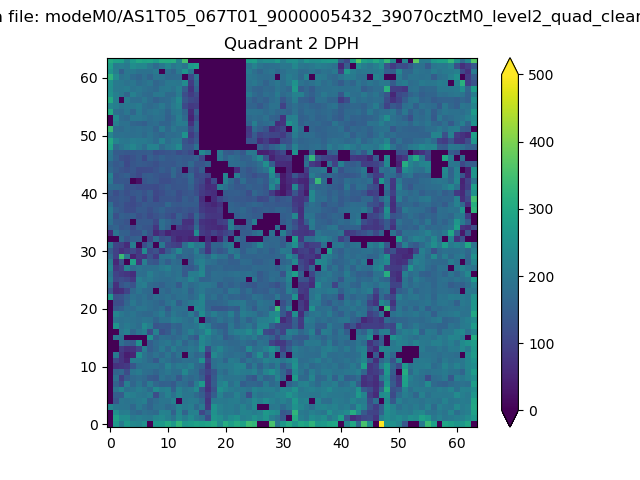 |
Quadrant C |
| Plot type | Count rate plots | Images |
|---|---|---|
| Comparison with Poisson distribution Blue bars denote a histogram of data divided into 1 sec bins. Red curve is a Poisson curve with rate = median count rate of data. |
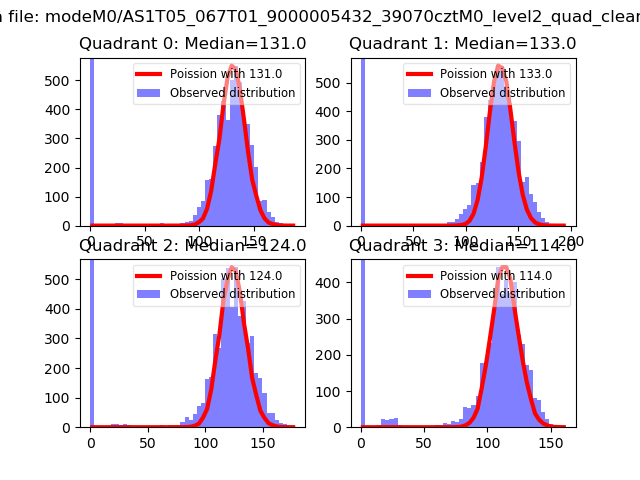 |
 |
| Quadrant-wise count rates Data is divided into 100 sec bins |
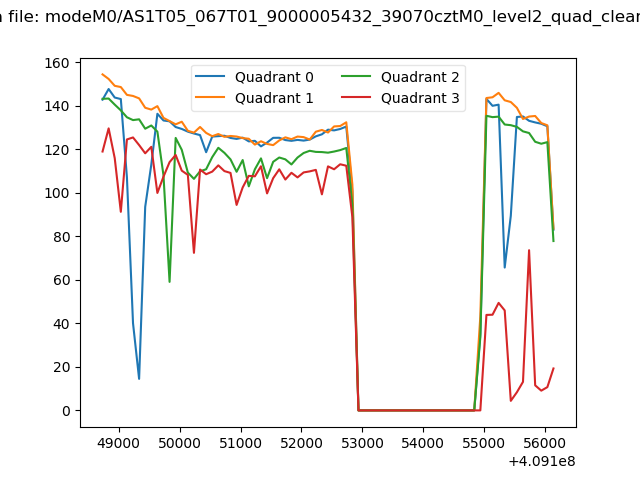 |
|
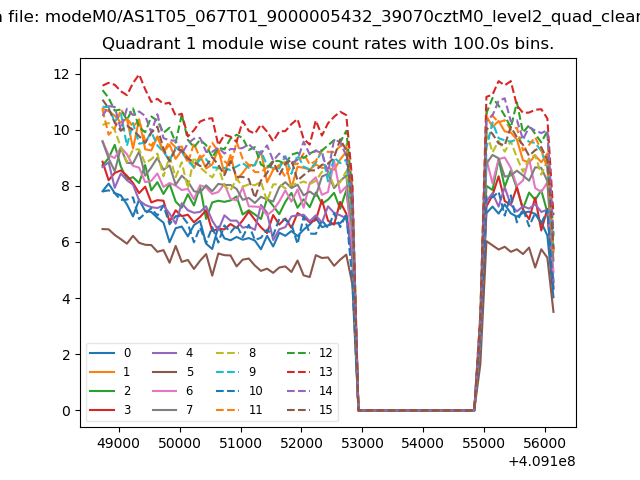
| Module-wise count rates for Quadrant A Data is divided into 100 sec bins |
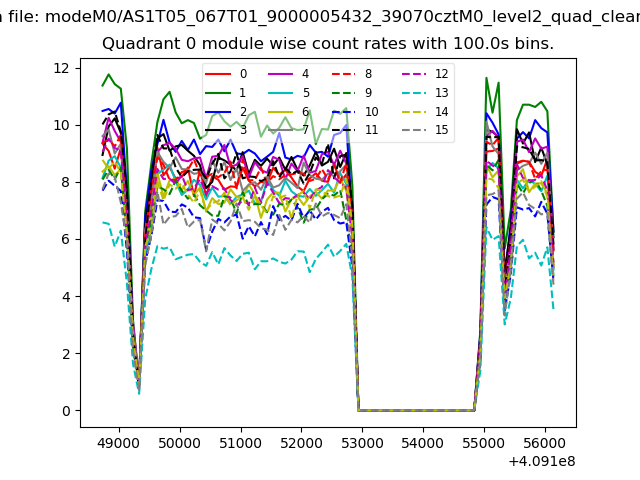 |
 |
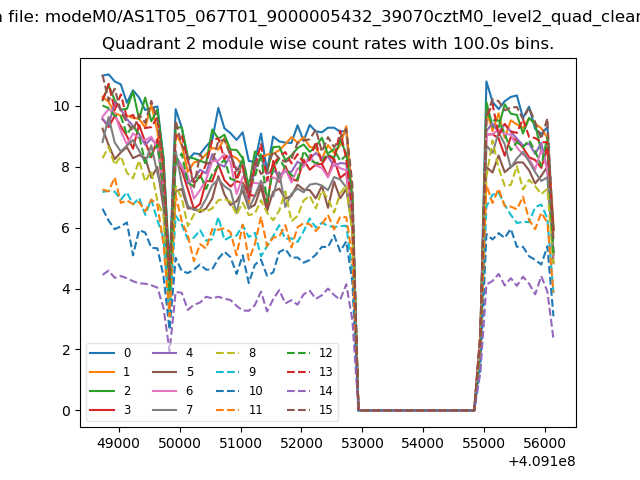
| Module-wise count rates for Quadrant B Data is divided into 100 sec bins |
 |
 |
| Module-wise count rates for Quadrant C Data is divided into 100 sec bins |
 |
 |
| Module-wise count rates for Quadrant D Data is divided into 100 sec bins |
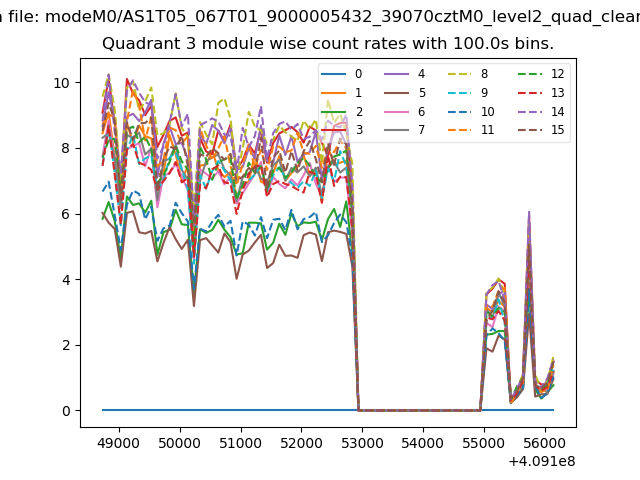 |
 |
| Parameter | Plot |
|---|---|
| CZT HV Monitor | 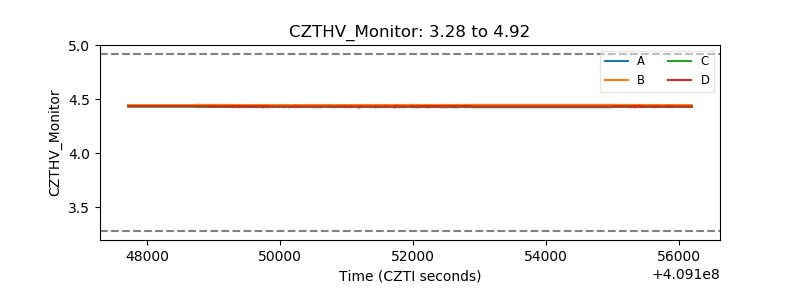 |
| D_VDD | 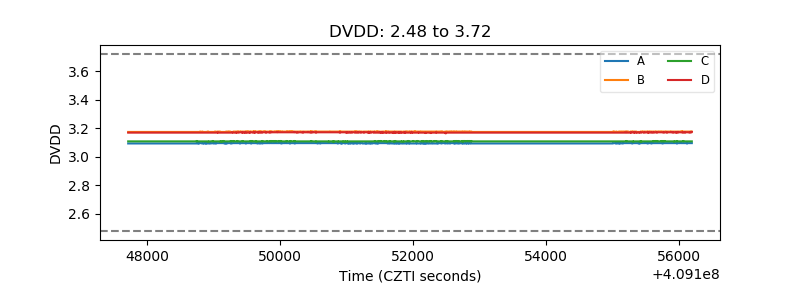 |
| Temperature 1 | 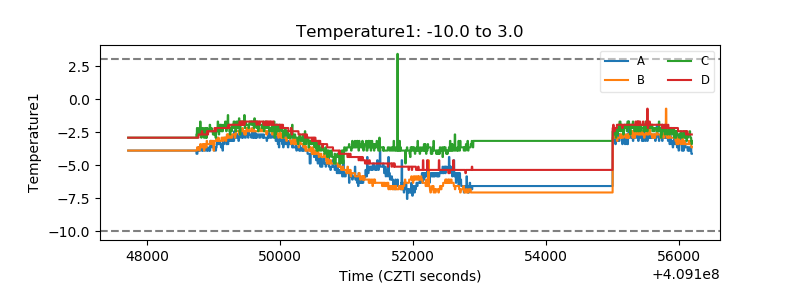 |
| Veto HV Monitor | 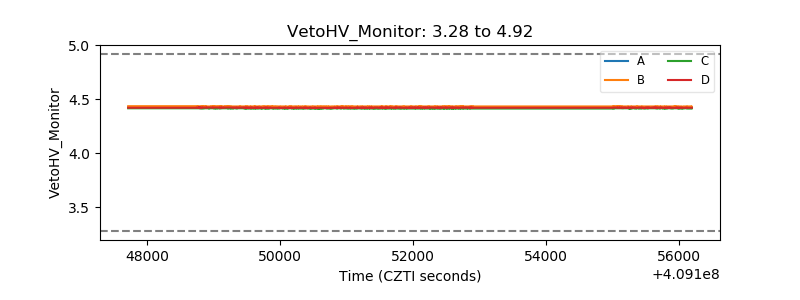 |
| Veto LLD | 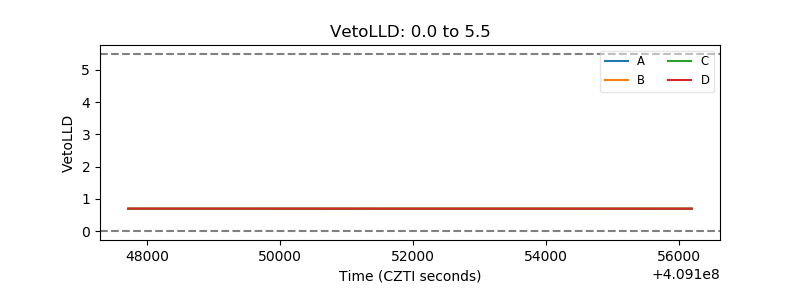 |
| Alpha Counter | 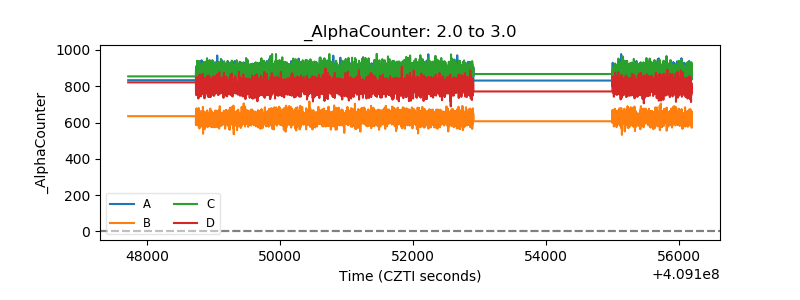 |
| _CPM_Rate | 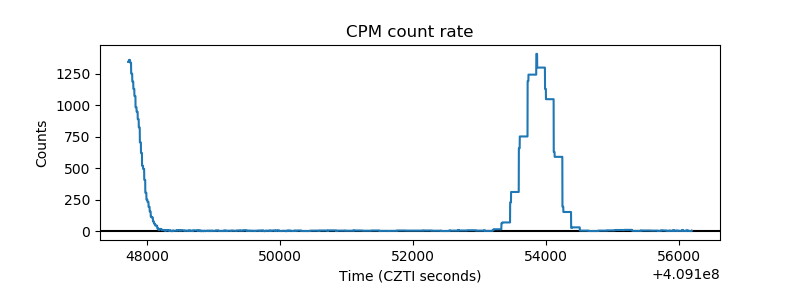 |
| CZT Counter | 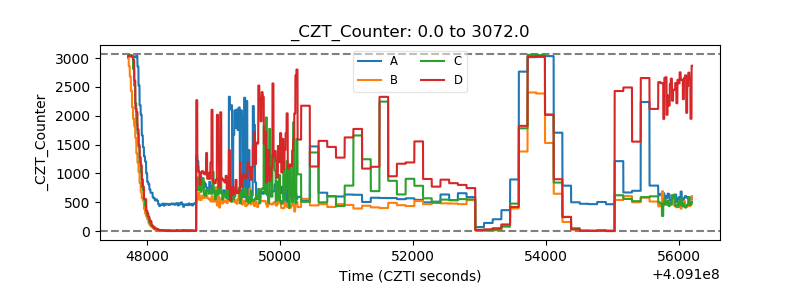 |
| +2.5 Volts monitor | 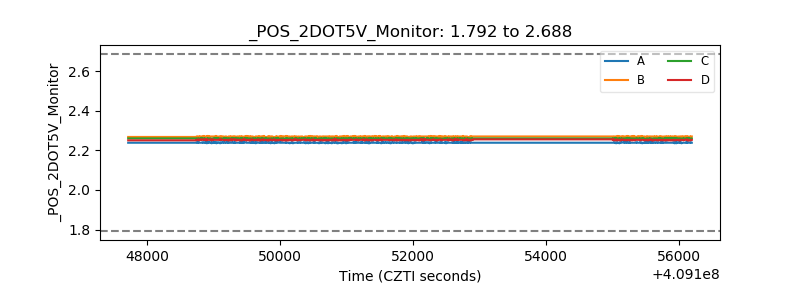 |
| +5 Volts monitor | 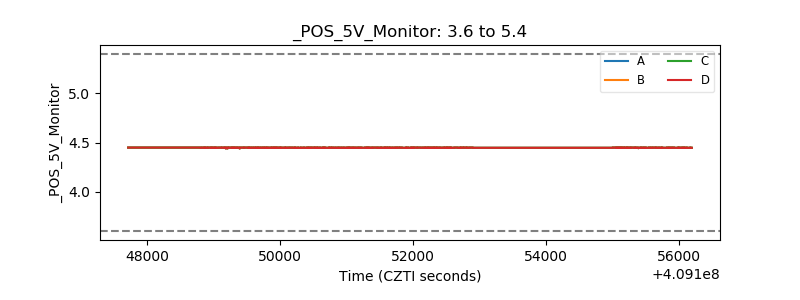 |
| _ROLL_ROT | 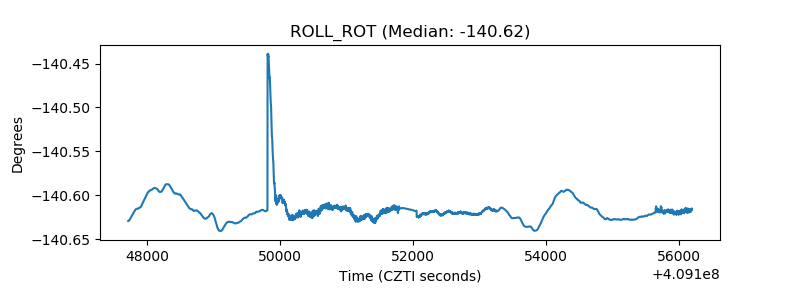 |
| _Roll_DEC | 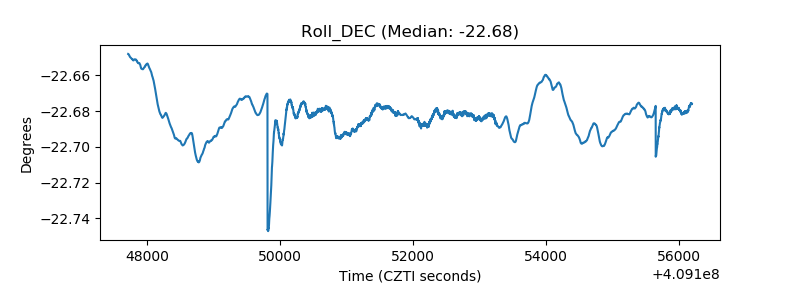 |
| _Roll_RA | 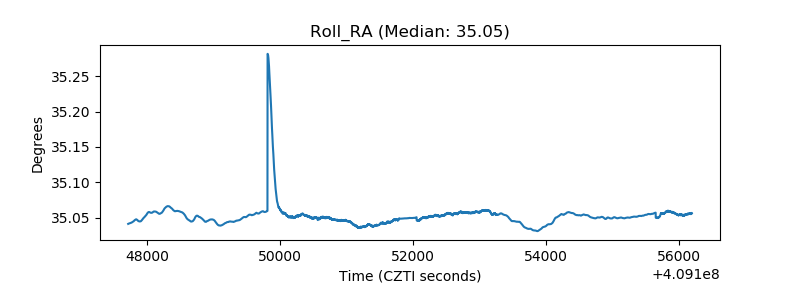 |
| Veto Counter | 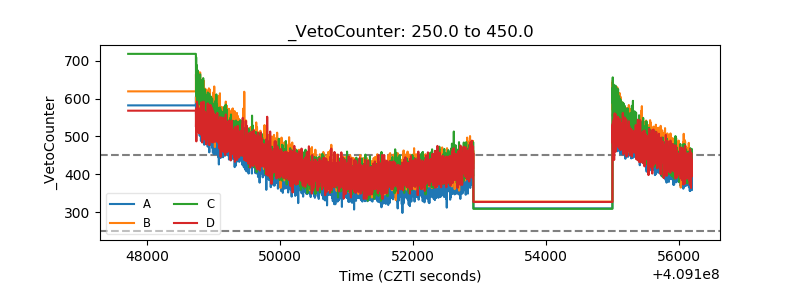 |