| Param | Original file | Final file |
|---|---|---|
| Filename | modeM0/AS1T05_067T01_9000005432_39071cztM0_level2.fits | modeM0/AS1T05_067T01_9000005432_39071cztM0_level2_quad_clean.evt |
| Size (bytes) | 486,864,000 | 91,543,680 |
| Size | 464.3 MB | 87.3 MB |
| Events in quadrant A | 3,305,386 | 660,489 |
| Events in quadrant B | 2,493,500 | 682,384 |
| Events in quadrant C | 3,026,534 | 630,765 |
| Events in quadrant D | 8,785,793 | 427,157 |
| Mode M0 | |||
|---|---|---|---|
| Quadrant | BADHDUFLAG | Total packets | Discarded packets |
| A | 0 | 13064 | 3 |
| B | 0 | 10749 | 2 |
| C | 0 | 12231 | 2 |
| D | 0 | 29832 | 2 |
| Mode SS | |||
|---|---|---|---|
| Quadrant | BADHDUFLAG | Total packets | Discarded packets |
| A | 0 | 110 | 0 |
| B | 0 | 110 | 0 |
| C | 0 | 110 | 0 |
| D | 0 | 110 | 0 |
| Mode M9 | |||
|---|---|---|---|
| Quadrant | BADHDUFLAG | Total packets | Discarded packets |
| A | 0 | 24 | 0 |
| B | 0 | 24 | 0 |
| C | 0 | 24 | 0 |
| D | 0 | 25 | 0 |
| Quadrant | Total seconds | Saturated seconds | Saturation percentage |
|---|---|---|---|
| A | 5295 | 110 | 2.077432% |
| B | 5295 | 5 | 0.094429% |
| C | 5295 | 47 | 0.887630% |
| D | 5295 | 1656 | 31.274788% |
Noise dominated data is calculated using 1-second bins in cleaned event files. If a bin has >2000 counts, and if more than 50% of those come from <1% of pixels, then it is considered to be noise-dominated and hence unusable.
| Quadrant | # 1 sec bins | Bins with >0 counts | Bins with >2000 counts | High rate bins dominated by noise | Noise dominated (total time) | Noise dominated (detector-on time) | Marked lightcurve |
|---|---|---|---|---|---|---|---|
| A | 7419 | 5296 | 64 | 64 | 0.86% | 1.21% | 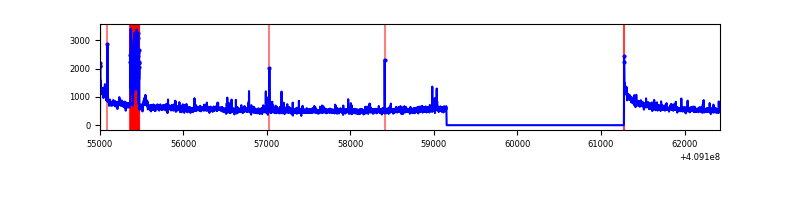 |
| B | 7419 | 5296 | 0 | 0 | 0.00% | 0.00% | 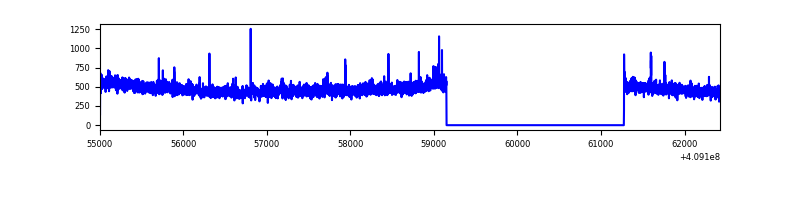 |
| C | 7419 | 5296 | 39 | 39 | 0.53% | 0.74% | 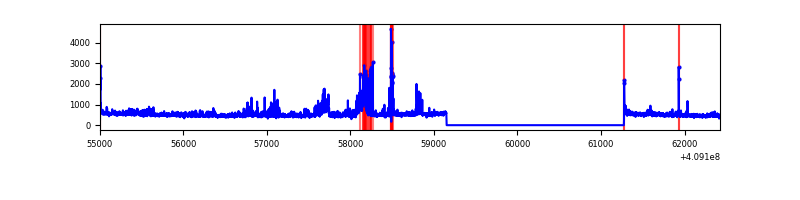 |
| D | 7419 | 5296 | 2044 | 2044 | 27.55% | 38.60% | 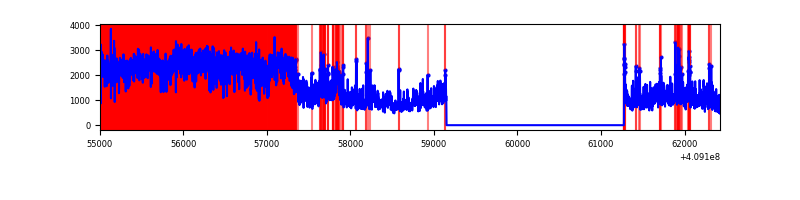 |
Top three noisy pixels from each quadrant. If the there are fewer than three noisy pixels in the level2.evt file, extra rows are filled as -1
| Pixel properties | Quadrant properties | ||||||
|---|---|---|---|---|---|---|---|
| Quadrant | DetID | PixID | Counts | Sigma | Mean | Median | Sigma |
| A | 15 | 222 | 461572 | 3725.04 | 613 | 603 | 123.7 |
| A | 10 | 83 | 425487 | 3433.44 | 613 | 603 | 123.7 |
| A | 13 | 248 | 19202 | 150.3 | 613 | 603 | 123.7 |
| B | 0 | 190 | 59849 | 502.3 | 613 | 599 | 118.0 |
| B | 12 | 111 | 14309 | 116.23 | 613 | 599 | 118.0 |
| B | 11 | 111 | 13081 | 105.82 | 613 | 599 | 118.0 |
| C | 15 | 208 | 461997 | 3380.45 | 585 | 589 | 136.5 |
| C | 15 | 214 | 223415 | 1632.51 | 585 | 589 | 136.5 |
| C | 3 | 233 | 42998 | 310.7 | 585 | 589 | 136.5 |
| D | 12 | 235 | 6217037 | 46896.55 | 541 | 526 | 132.6 |
| D | 1 | 47 | 199276 | 1499.34 | 541 | 526 | 132.6 |
| D | 12 | 233 | 195502 | 1470.87 | 541 | 526 | 132.6 |
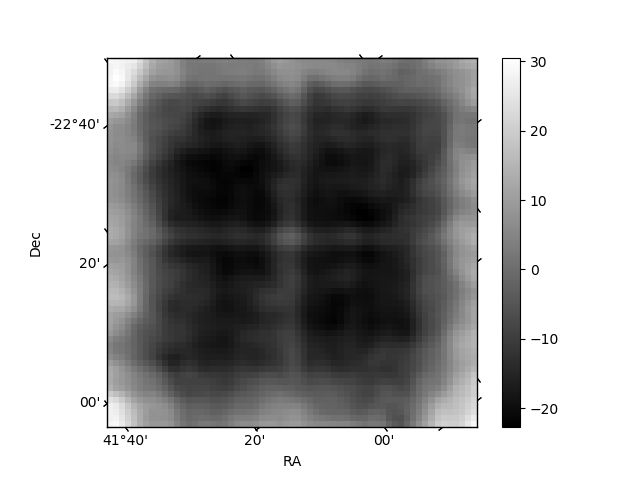
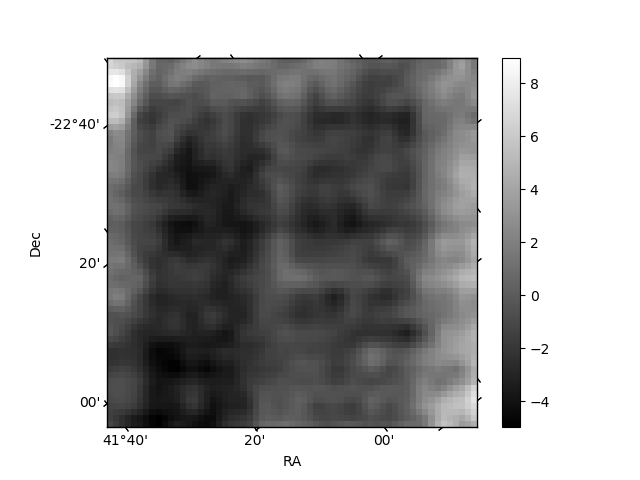
Histogram calculated using DETX and DETY for each event in the final _common_clean file
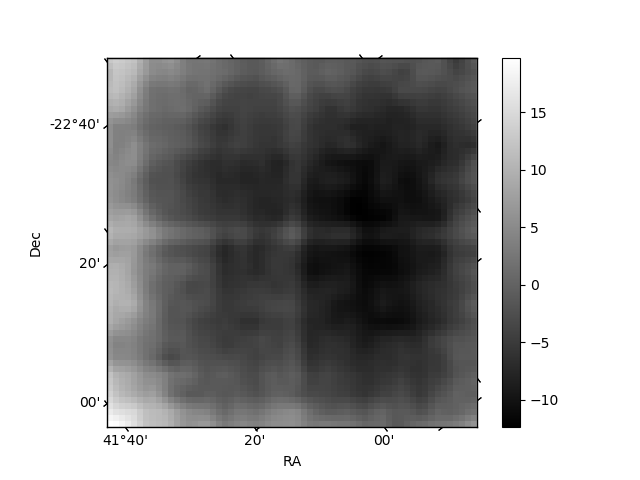
| Quadrant A | 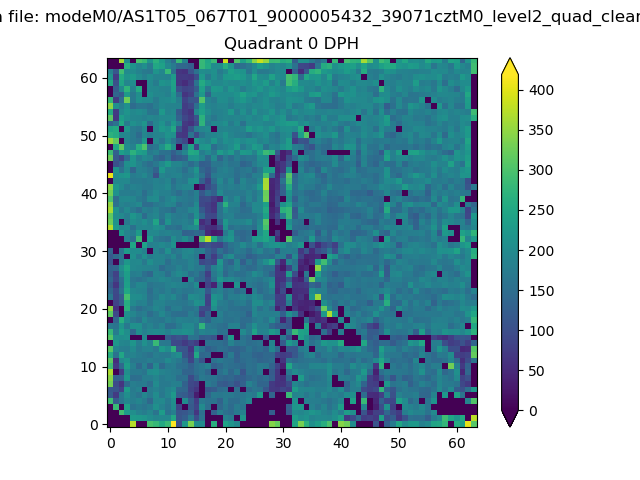 |
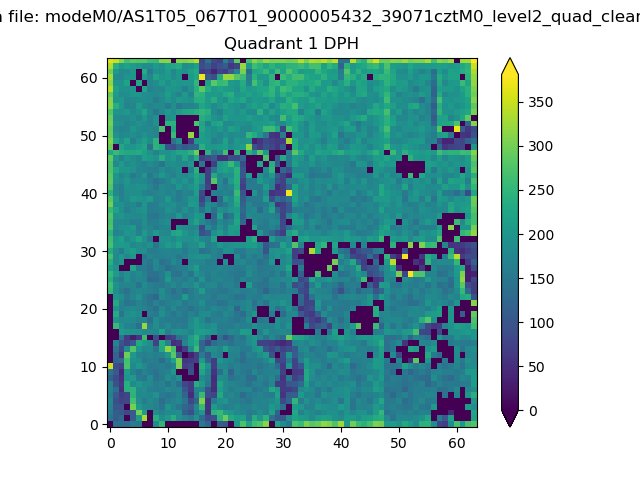 |
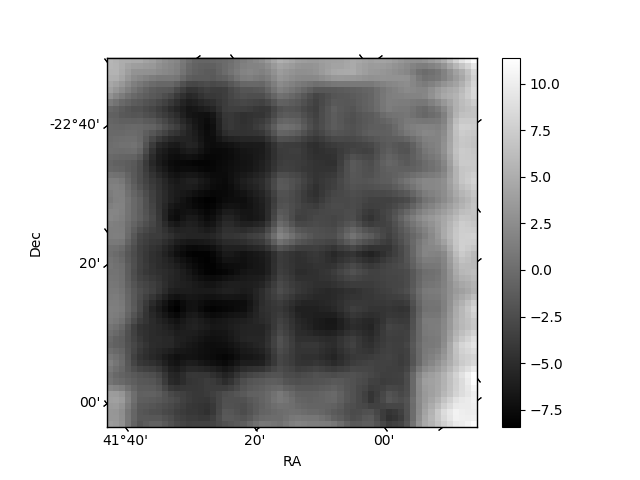
Quadrant B |
|---|---|---|---|
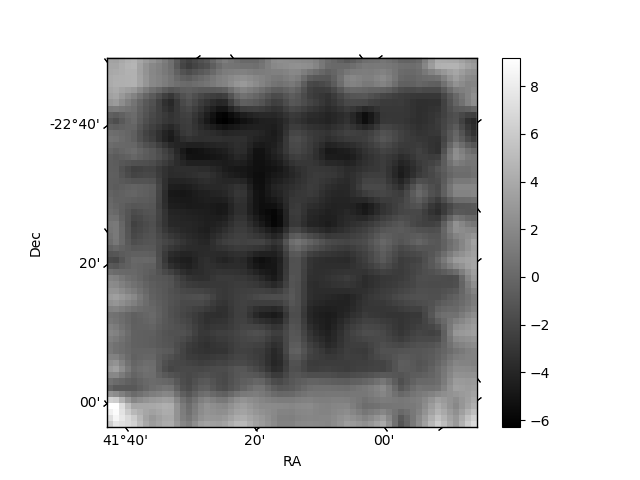
| Quadrant D |  |
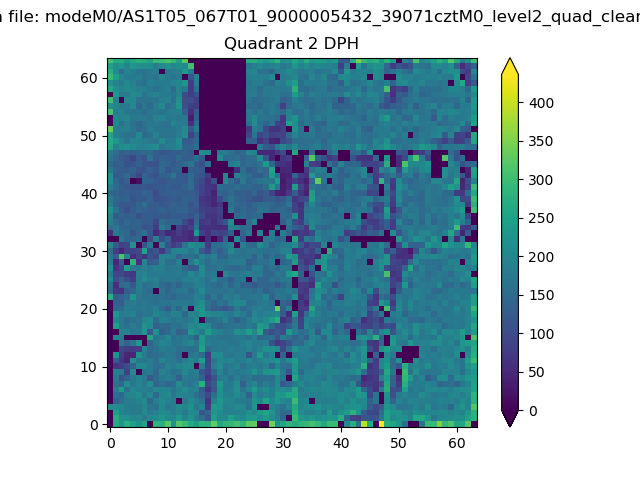 |
Quadrant C |
| Plot type | Count rate plots | Images |
|---|---|---|
| Comparison with Poisson distribution Blue bars denote a histogram of data divided into 1 sec bins. Red curve is a Poisson curve with rate = median count rate of data. |
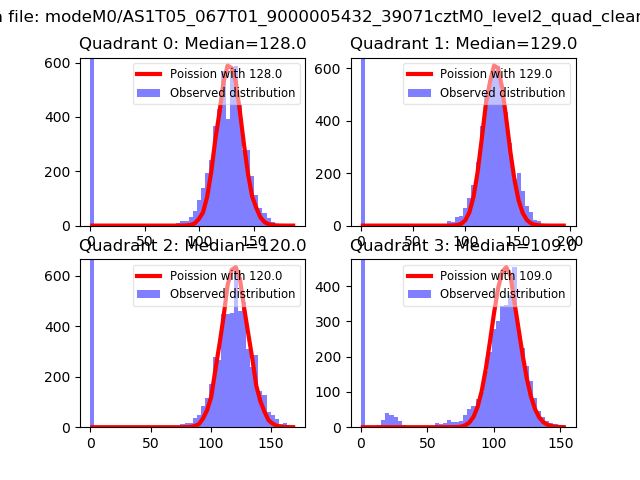 |
 |
| Quadrant-wise count rates Data is divided into 100 sec bins |
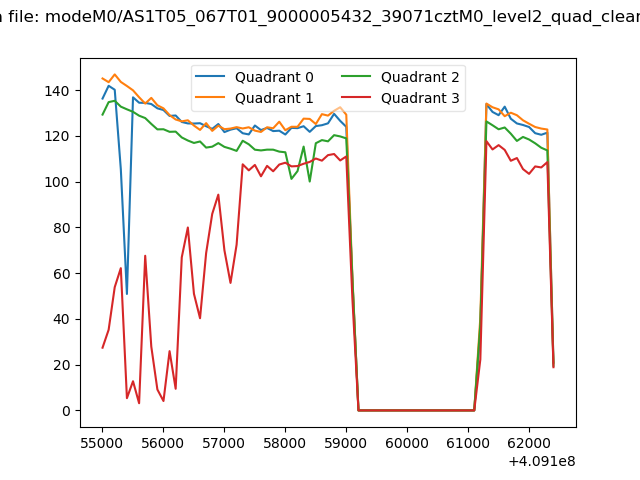 |
|
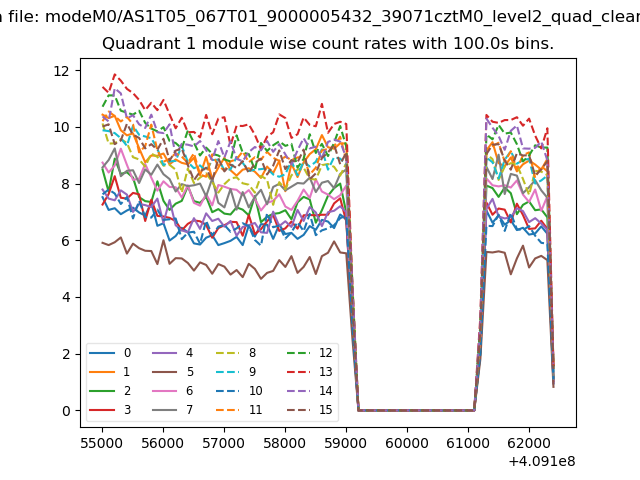
| Module-wise count rates for Quadrant A Data is divided into 100 sec bins |
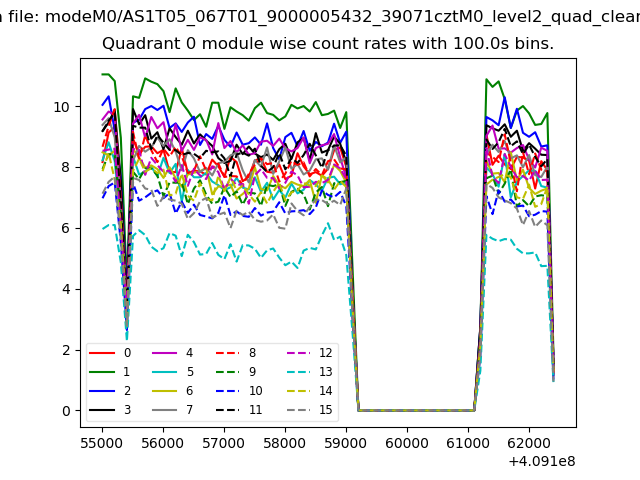 |
 |
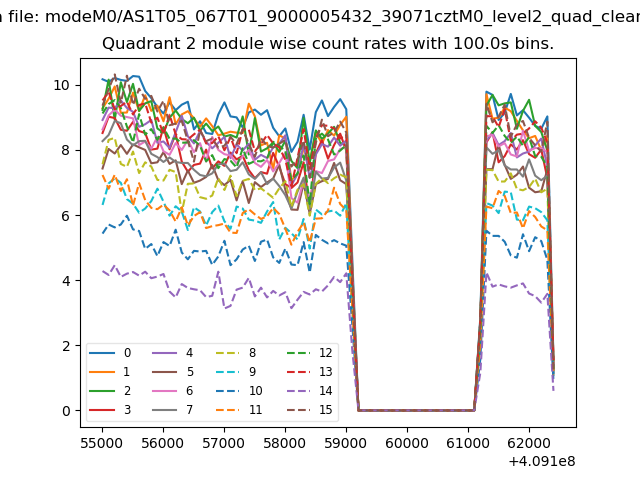
| Module-wise count rates for Quadrant B Data is divided into 100 sec bins |
 |
 |
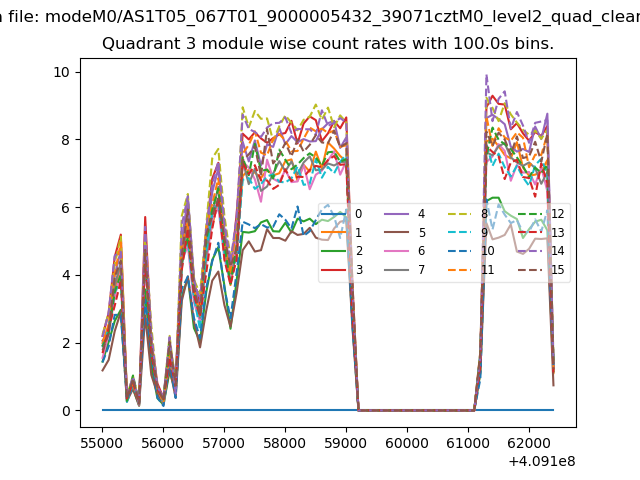
| Module-wise count rates for Quadrant C Data is divided into 100 sec bins |
 |
 |
| Module-wise count rates for Quadrant D Data is divided into 100 sec bins |
 |
 |
| Parameter | Plot |
|---|---|
| CZT HV Monitor | 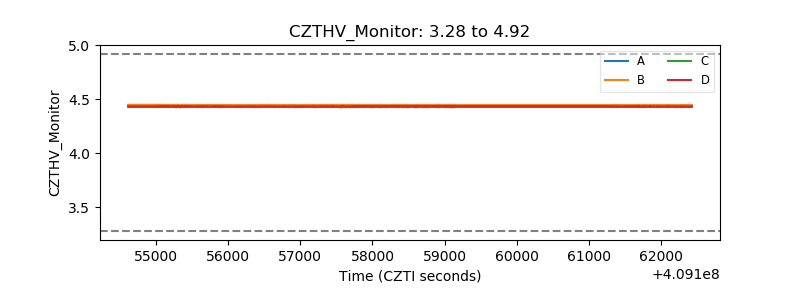 |
| D_VDD | 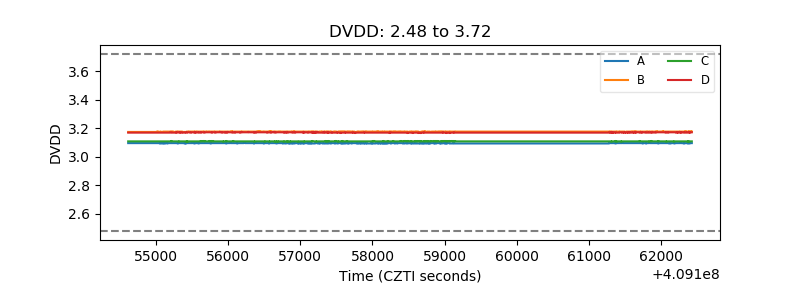 |
| Temperature 1 | 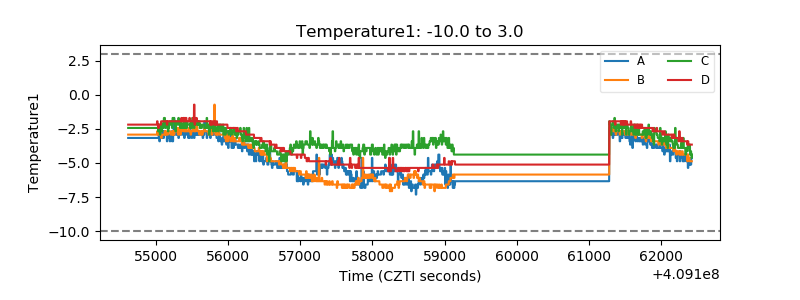 |
| Veto HV Monitor |  |
| Veto LLD | 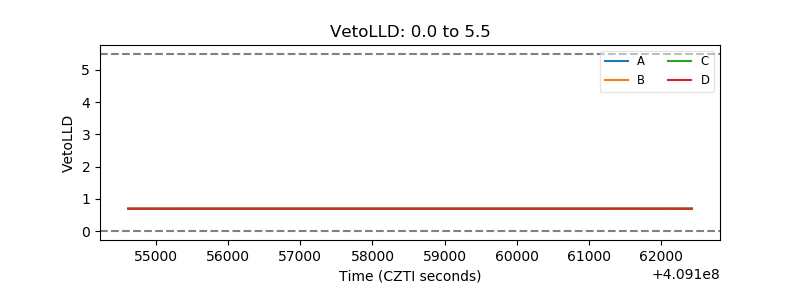 |
| Alpha Counter | 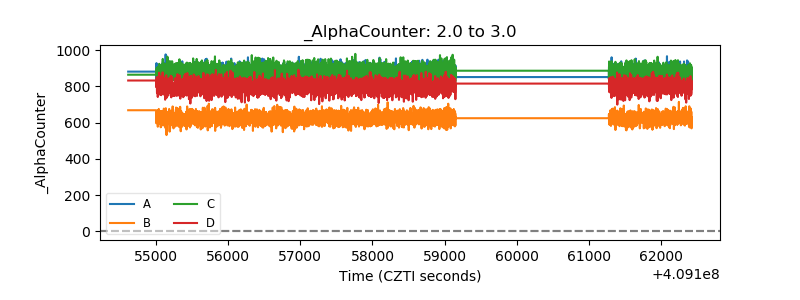 |
| _CPM_Rate | 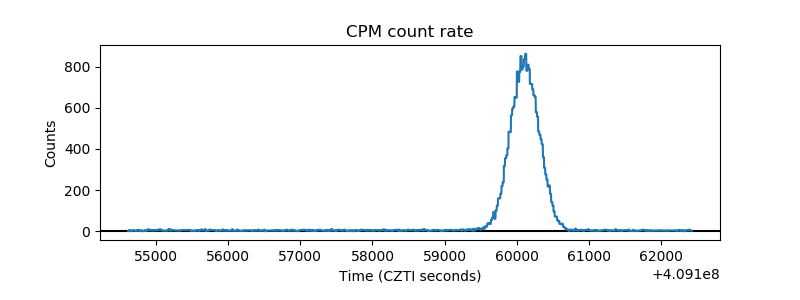 |
| CZT Counter | 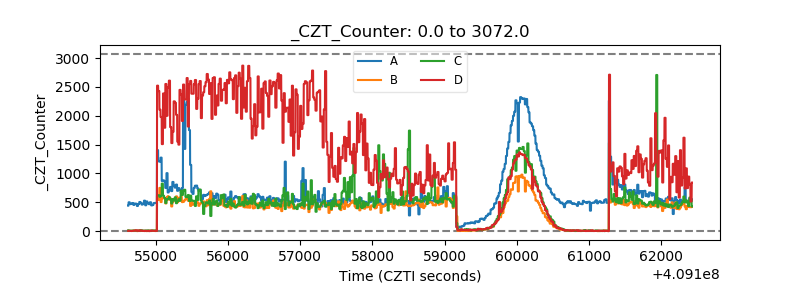 |
| +2.5 Volts monitor | 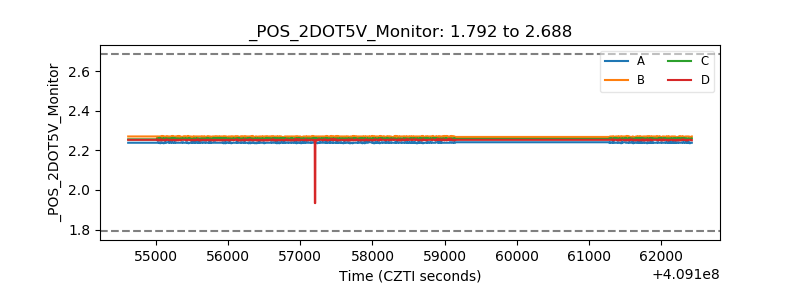 |
| +5 Volts monitor | 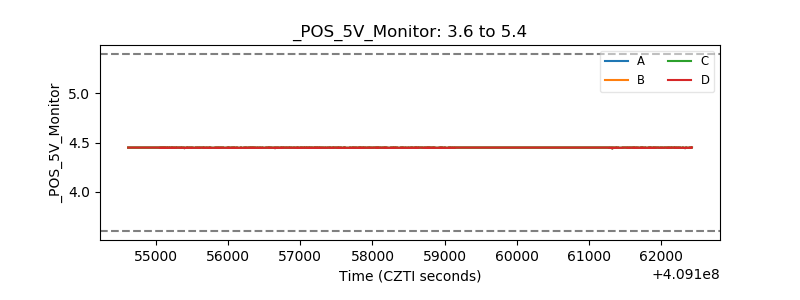 |
| _ROLL_ROT | 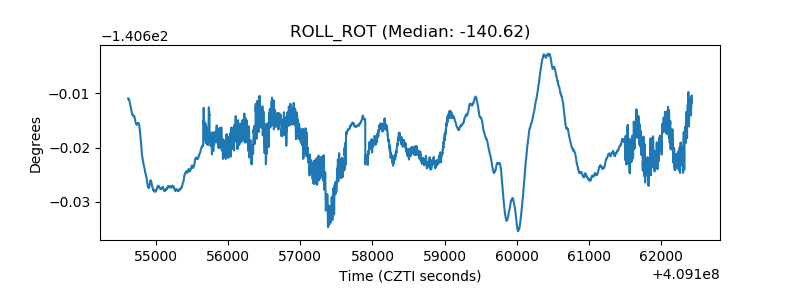 |
| _Roll_DEC | 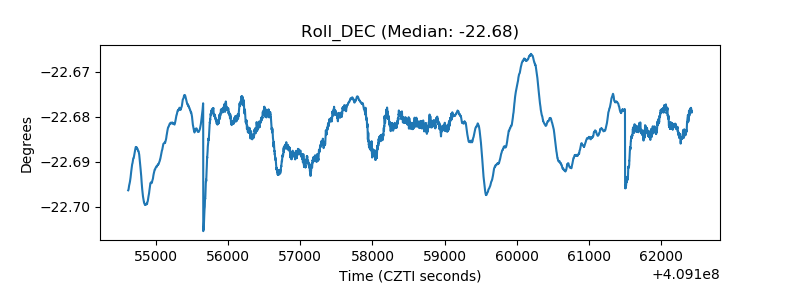 |
| _Roll_RA | 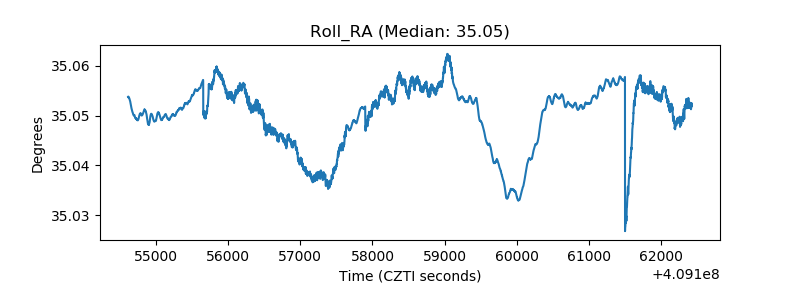 |
| Veto Counter | 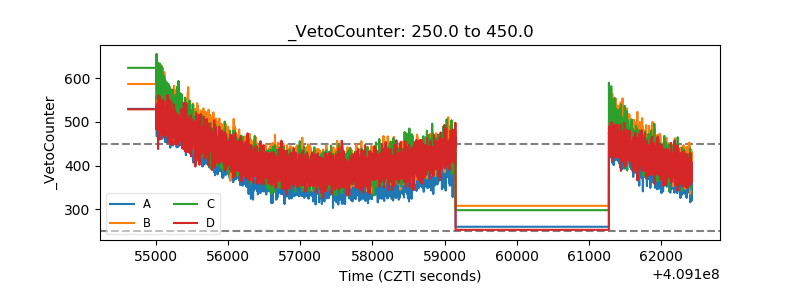 |