| Param | Original file | Final file |
|---|---|---|
| Filename | modeM0/AS1T05_067T01_9000005432_39072cztM0_level2.fits | modeM0/AS1T05_067T01_9000005432_39072cztM0_level2_quad_clean.evt |
| Size (bytes) | 346,481,280 | 91,290,240 |
| Size | 330.4 MB | 87.1 MB |
| Events in quadrant A | 3,020,234 | 626,324 |
| Events in quadrant B | 2,355,673 | 635,102 |
| Events in quadrant C | 2,784,734 | 591,438 |
| Events in quadrant D | 4,259,974 | 546,897 |
| Mode M0 | |||
|---|---|---|---|
| Quadrant | BADHDUFLAG | Total packets | Discarded packets |
| A | 0 | 12202 | 3 |
| B | 0 | 10616 | 2 |
| C | 0 | 11575 | 2 |
| D | 0 | 16317 | 2 |
| Mode SS | |||
|---|---|---|---|
| Quadrant | BADHDUFLAG | Total packets | Discarded packets |
| A | 0 | 106 | 0 |
| B | 0 | 106 | 0 |
| C | 0 | 106 | 0 |
| D | 0 | 106 | 0 |
| Mode M9 | |||
|---|---|---|---|
| Quadrant | BADHDUFLAG | Total packets | Discarded packets |
| A | 0 | 25 | 0 |
| B | 0 | 25 | 0 |
| C | 0 | 25 | 0 |
| D | 0 | 26 | 0 |
| Quadrant | Total seconds | Saturated seconds | Saturation percentage |
|---|---|---|---|
| A | 5207 | 14 | 0.268869% |
| B | 5207 | 10 | 0.192049% |
| C | 5207 | 12 | 0.230459% |
| D | 5207 | 98 | 1.882082% |
Noise dominated data is calculated using 1-second bins in cleaned event files. If a bin has >2000 counts, and if more than 50% of those come from <1% of pixels, then it is considered to be noise-dominated and hence unusable.
| Quadrant | # 1 sec bins | Bins with >0 counts | Bins with >2000 counts | High rate bins dominated by noise | Noise dominated (total time) | Noise dominated (detector-on time) | Marked lightcurve |
|---|---|---|---|---|---|---|---|
| A | 7299 | 5208 | 7 | 7 | 0.10% | 0.13% | 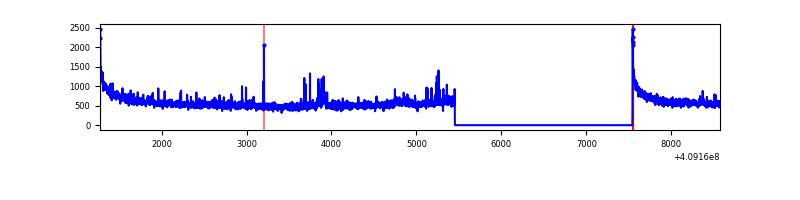 |
| B | 7299 | 5208 | 3 | 3 | 0.04% | 0.06% | 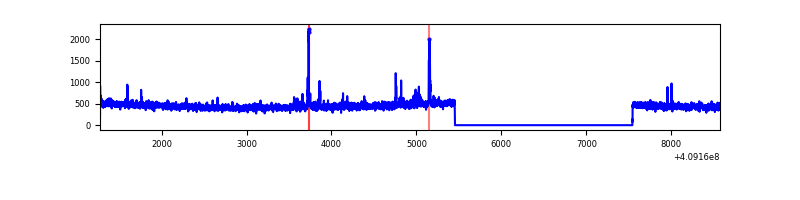 |
| C | 7299 | 5208 | 12 | 12 | 0.16% | 0.23% | 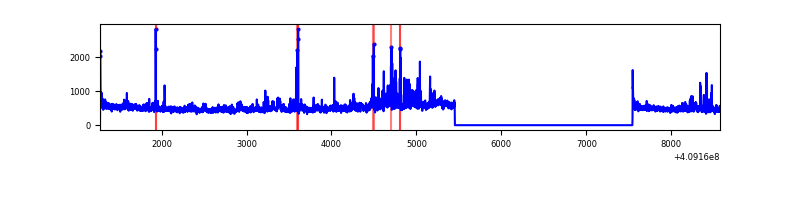 |
| D | 7299 | 5208 | 109 | 109 | 1.49% | 2.09% | 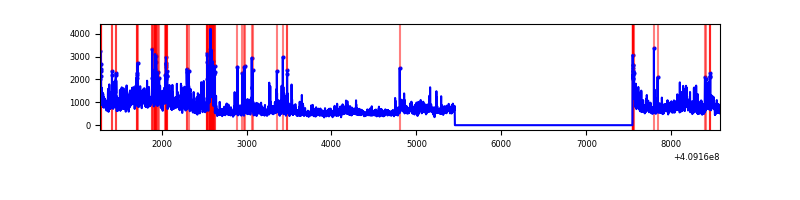 |
Top three noisy pixels from each quadrant. If the there are fewer than three noisy pixels in the level2.evt file, extra rows are filled as -1
| Pixel properties | Quadrant properties | ||||||
|---|---|---|---|---|---|---|---|
| Quadrant | DetID | PixID | Counts | Sigma | Mean | Median | Sigma |
| A | 10 | 83 | 417546 | 3514.94 | 584 | 573 | 118.6 |
| A | 15 | 222 | 272982 | 2296.31 | 584 | 573 | 118.6 |
| A | 12 | 16 | 18236 | 148.89 | 584 | 573 | 118.6 |
| B | 5 | 172 | 35374 | 311.03 | 581 | 567 | 111.9 |
| B | 0 | 190 | 33277 | 292.29 | 581 | 567 | 111.9 |
| B | 12 | 111 | 14150 | 121.38 | 581 | 567 | 111.9 |
| C | 15 | 214 | 220764 | 1669.12 | 561 | 566 | 131.9 |
| C | 15 | 208 | 207048 | 1565.15 | 561 | 566 | 131.9 |
| C | 3 | 233 | 155849 | 1177.06 | 561 | 566 | 131.9 |
| D | 12 | 235 | 1615276 | 11954.11 | 555 | 538 | 135.1 |
| D | 1 | 47 | 341038 | 2520.77 | 555 | 538 | 135.1 |
| D | 2 | 249 | 62606 | 459.5 | 555 | 538 | 135.1 |
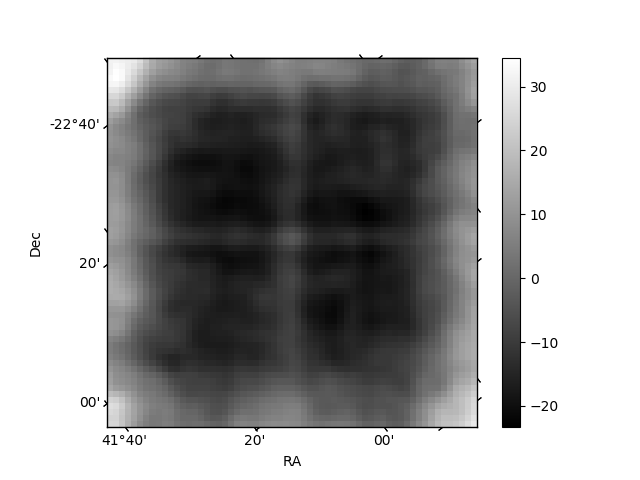
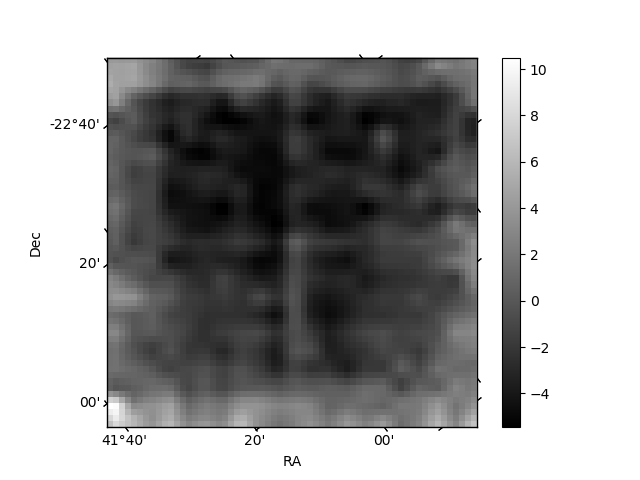
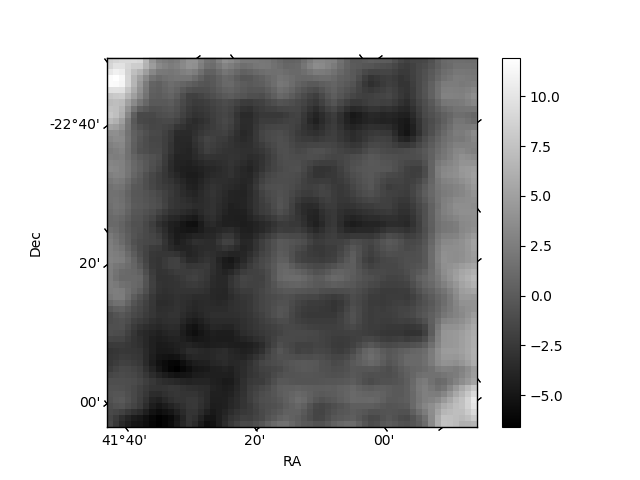
Histogram calculated using DETX and DETY for each event in the final _common_clean file
| Quadrant A | 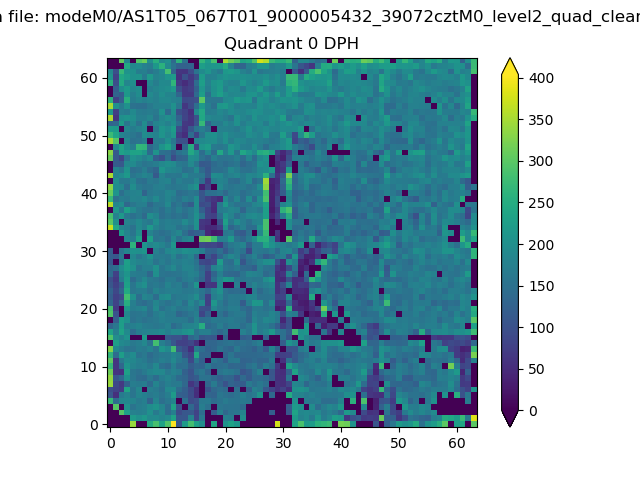 |
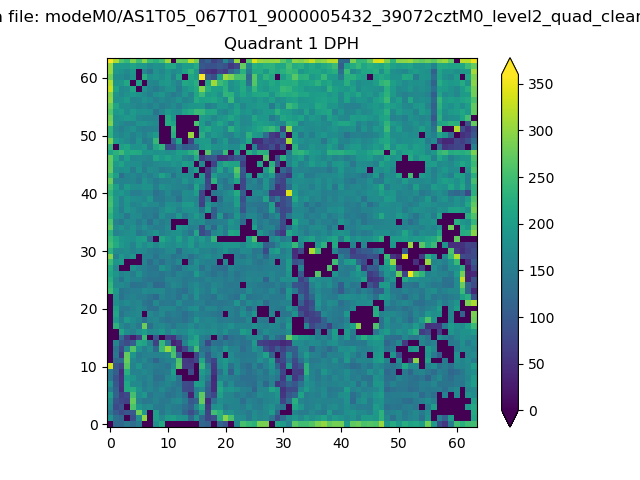 |
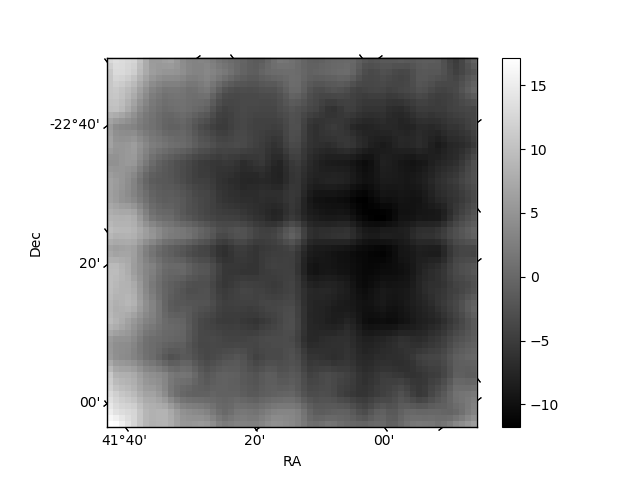
Quadrant B |
|---|---|---|---|
| Quadrant D | 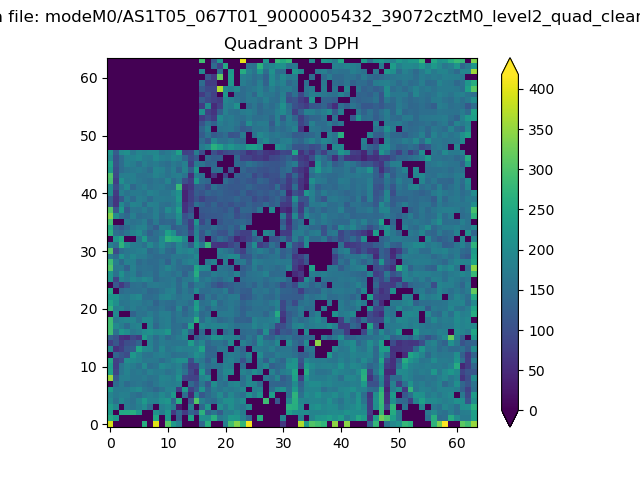 |
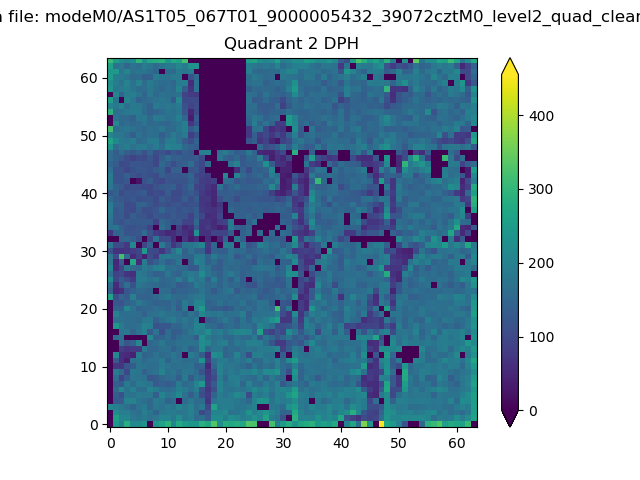 |
Quadrant C |
| Plot type | Count rate plots | Images |
|---|---|---|
| Comparison with Poisson distribution Blue bars denote a histogram of data divided into 1 sec bins. Red curve is a Poisson curve with rate = median count rate of data. |
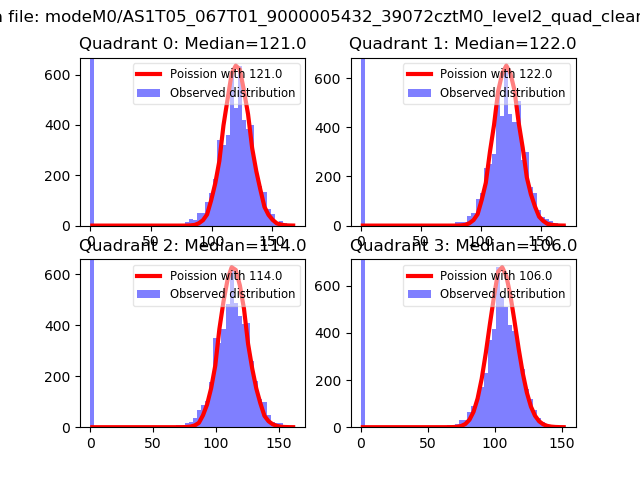 |
 |
| Quadrant-wise count rates Data is divided into 100 sec bins |
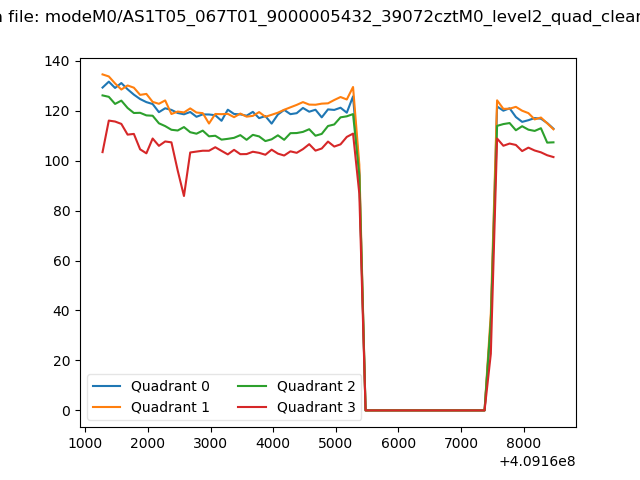 |
|
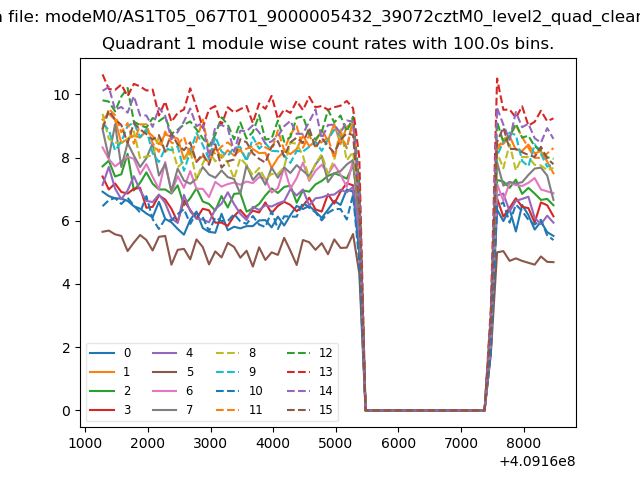
| Module-wise count rates for Quadrant A Data is divided into 100 sec bins |
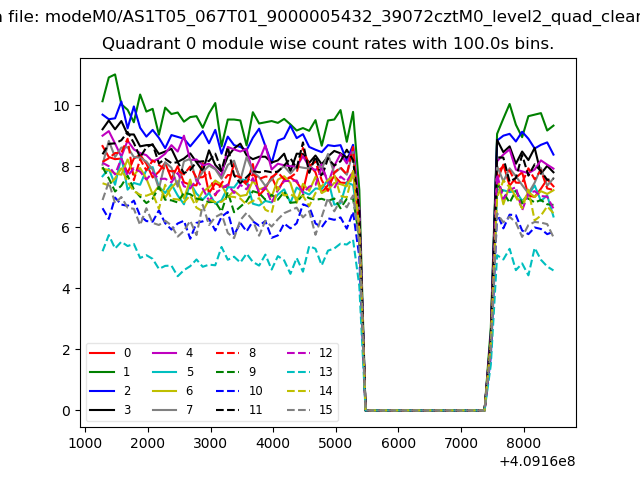 |
 |
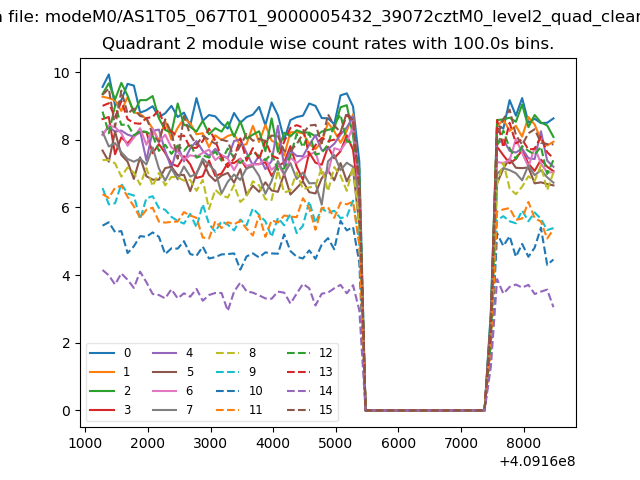
| Module-wise count rates for Quadrant B Data is divided into 100 sec bins |
 |
 |
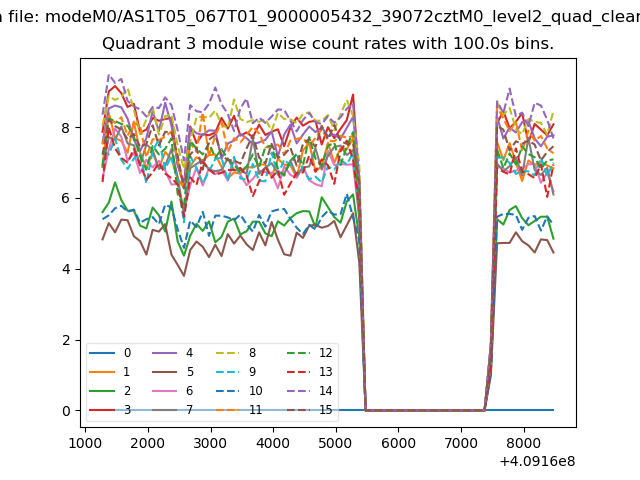
| Module-wise count rates for Quadrant C Data is divided into 100 sec bins |
 |
 |
| Module-wise count rates for Quadrant D Data is divided into 100 sec bins |
 |
 |
| Parameter | Plot |
|---|---|
| CZT HV Monitor | 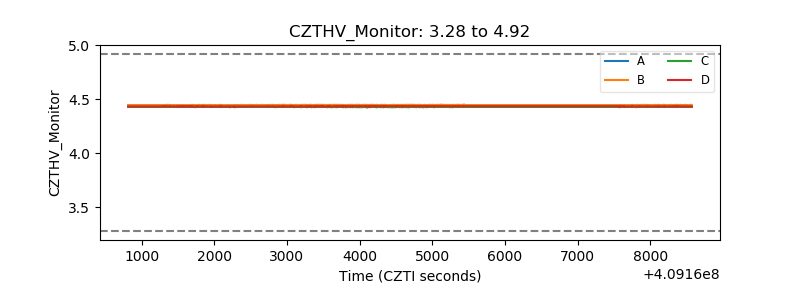 |
| D_VDD | 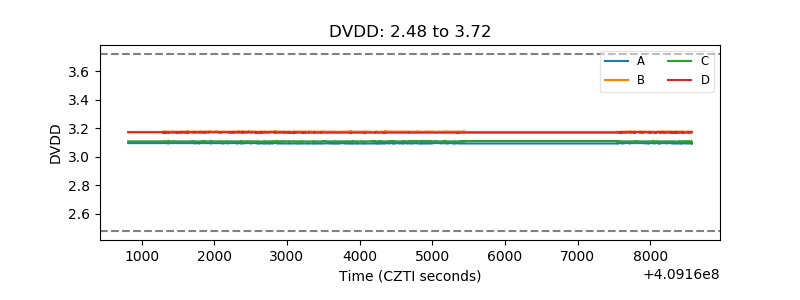 |
| Temperature 1 | 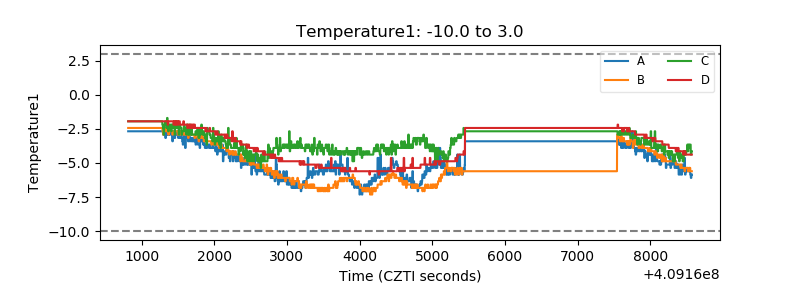 |
| Veto HV Monitor | 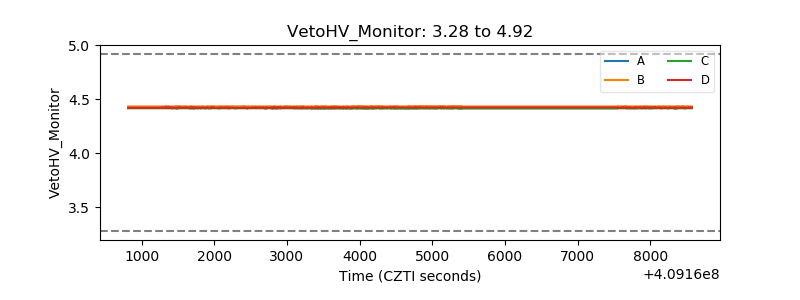 |
| Veto LLD | 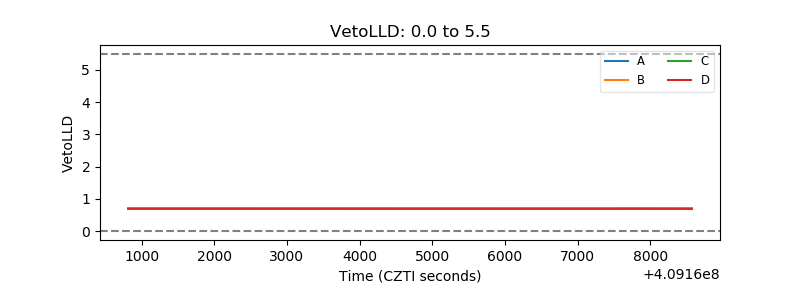 |
| Alpha Counter | 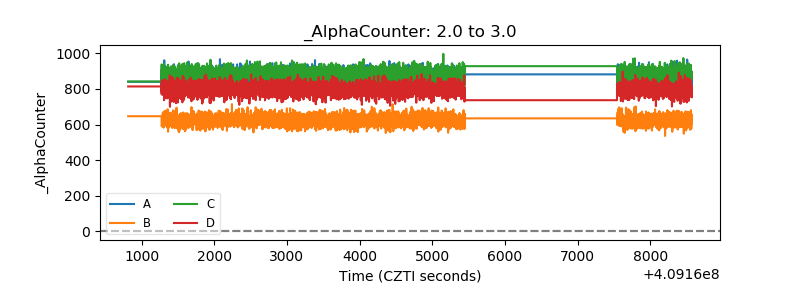 |
| _CPM_Rate | 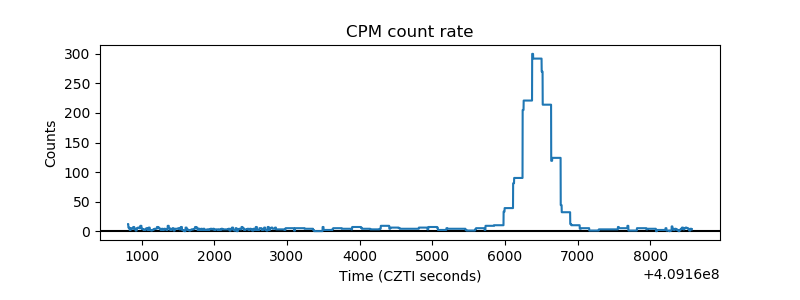 |
| CZT Counter | 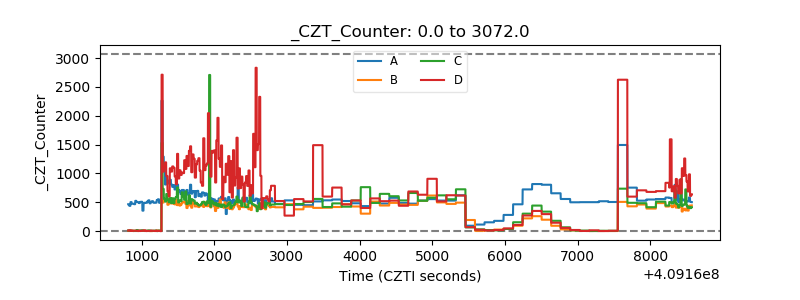 |
| +2.5 Volts monitor | 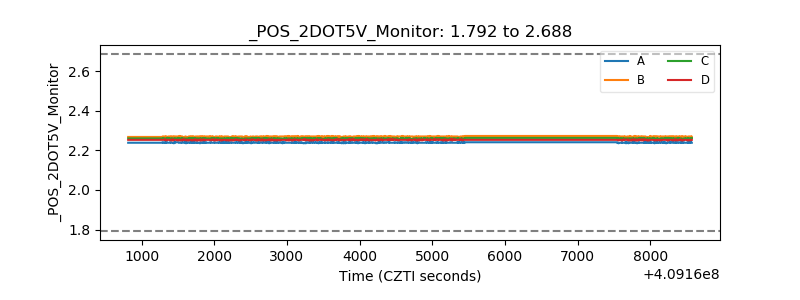 |
| +5 Volts monitor | 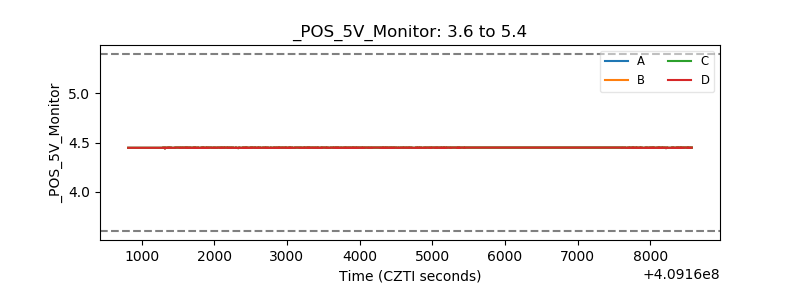 |
| _ROLL_ROT | 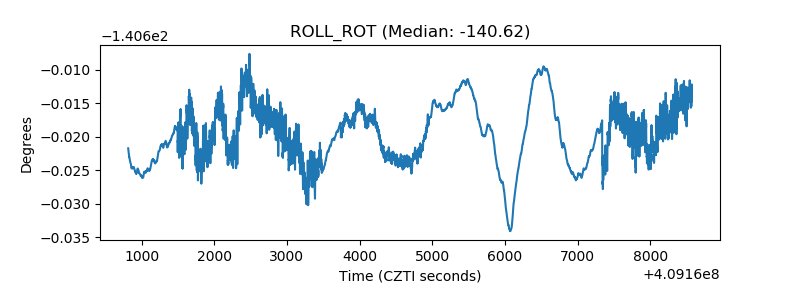 |
| _Roll_DEC | 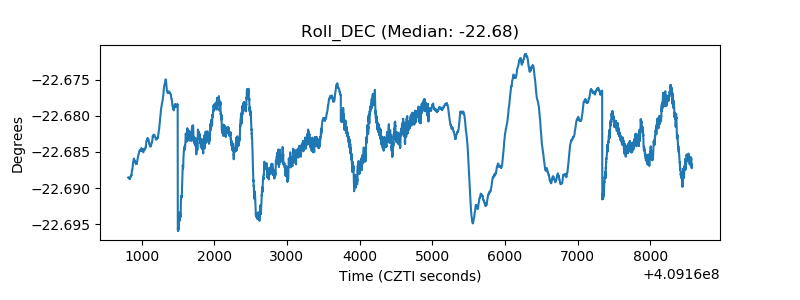 |
| _Roll_RA | 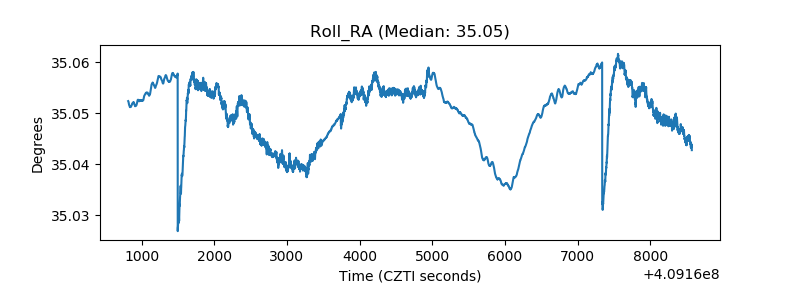 |
| Veto Counter | 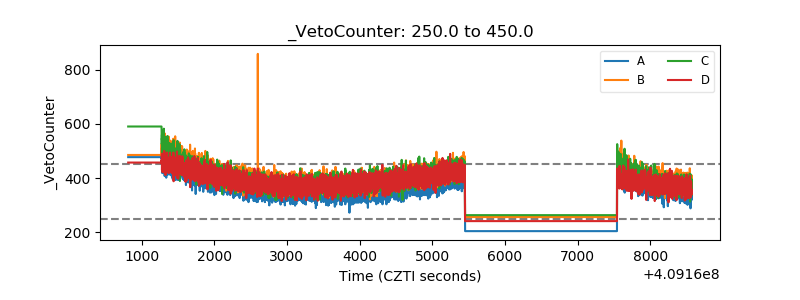 |