| Param | Original file | Final file |
|---|---|---|
| Filename | modeM0/AS1T05_067T01_9000005432_39073cztM0_level2.fits | modeM0/AS1T05_067T01_9000005432_39073cztM0_level2_quad_clean.evt |
| Size (bytes) | 354,133,440 | 87,822,720 |
| Size | 337.7 MB | 83.8 MB |
| Events in quadrant A | 3,091,868 | 595,507 |
| Events in quadrant B | 2,321,355 | 609,142 |
| Events in quadrant C | 3,302,941 | 561,754 |
| Events in quadrant D | 3,987,033 | 527,350 |
| Mode M0 | |||
|---|---|---|---|
| Quadrant | BADHDUFLAG | Total packets | Discarded packets |
| A | 0 | 12457 | 3 |
| B | 0 | 10622 | 2 |
| C | 0 | 13254 | 2 |
| D | 0 | 15514 | 2 |
| Mode SS | |||
|---|---|---|---|
| Quadrant | BADHDUFLAG | Total packets | Discarded packets |
| A | 0 | 108 | 0 |
| B | 0 | 108 | 0 |
| C | 0 | 108 | 0 |
| D | 0 | 108 | 0 |
| Mode M9 | |||
|---|---|---|---|
| Quadrant | BADHDUFLAG | Total packets | Discarded packets |
| A | 0 | 29 | 0 |
| B | 0 | 29 | 0 |
| C | 0 | 29 | 0 |
| D | 0 | 30 | 0 |
| Quadrant | Total seconds | Saturated seconds | Saturation percentage |
|---|---|---|---|
| A | 5214 | 65 | 1.246644% |
| B | 5214 | 21 | 0.402762% |
| C | 5214 | 147 | 2.819333% |
| D | 5214 | 96 | 1.841197% |
Noise dominated data is calculated using 1-second bins in cleaned event files. If a bin has >2000 counts, and if more than 50% of those come from <1% of pixels, then it is considered to be noise-dominated and hence unusable.
| Quadrant | # 1 sec bins | Bins with >0 counts | Bins with >2000 counts | High rate bins dominated by noise | Noise dominated (total time) | Noise dominated (detector-on time) | Marked lightcurve |
|---|---|---|---|---|---|---|---|
| A | 7096 | 5214 | 54 | 54 | 0.76% | 1.04% | 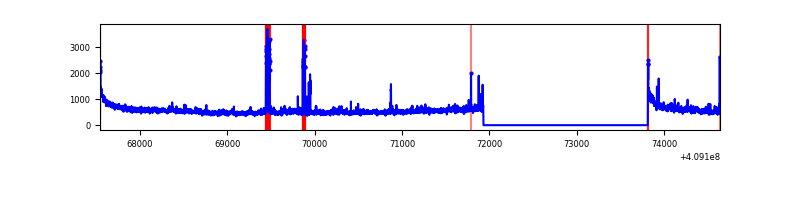 |
| B | 7096 | 5214 | 11 | 11 | 0.16% | 0.21% | 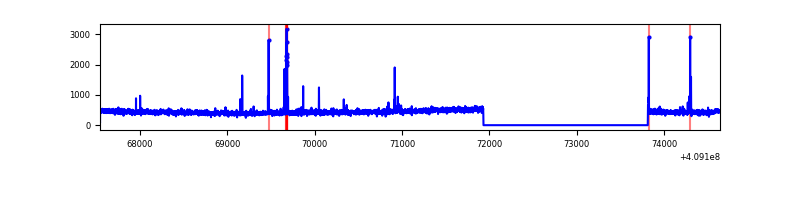 |
| C | 7096 | 5214 | 101 | 101 | 1.42% | 1.94% | 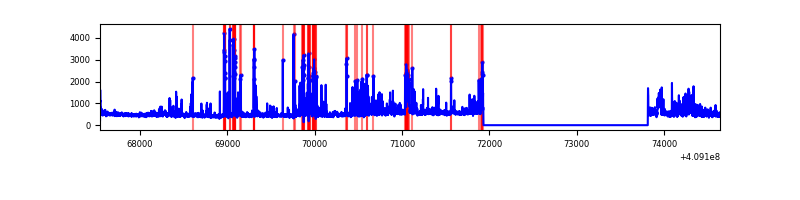 |
| D | 7096 | 5214 | 106 | 106 | 1.49% | 2.03% | 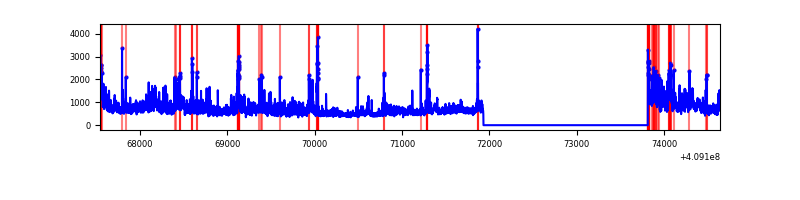 |
Top three noisy pixels from each quadrant. If the there are fewer than three noisy pixels in the level2.evt file, extra rows are filled as -1
| Pixel properties | Quadrant properties | ||||||
|---|---|---|---|---|---|---|---|
| Quadrant | DetID | PixID | Counts | Sigma | Mean | Median | Sigma |
| A | 15 | 222 | 424465 | 3621.36 | 571 | 561 | 117.1 |
| A | 10 | 83 | 411189 | 3507.94 | 571 | 561 | 117.1 |
| A | 7 | 3 | 13117 | 107.26 | 571 | 561 | 117.1 |
| B | 5 | 172 | 41102 | 365.05 | 571 | 557 | 111.1 |
| B | 5 | 184 | 30361 | 268.35 | 571 | 557 | 111.1 |
| B | 12 | 111 | 14048 | 121.47 | 571 | 557 | 111.1 |
| C | 15 | 208 | 848648 | 6548.93 | 551 | 554 | 129.5 |
| C | 15 | 214 | 221914 | 1709.33 | 551 | 554 | 129.5 |
| C | 3 | 233 | 66660 | 510.47 | 551 | 554 | 129.5 |
| D | 12 | 235 | 1382888 | 10301.06 | 550 | 535 | 134.2 |
| D | 13 | 249 | 106907 | 792.67 | 550 | 535 | 134.2 |
| D | 13 | 174 | 87457 | 647.73 | 550 | 535 | 134.2 |
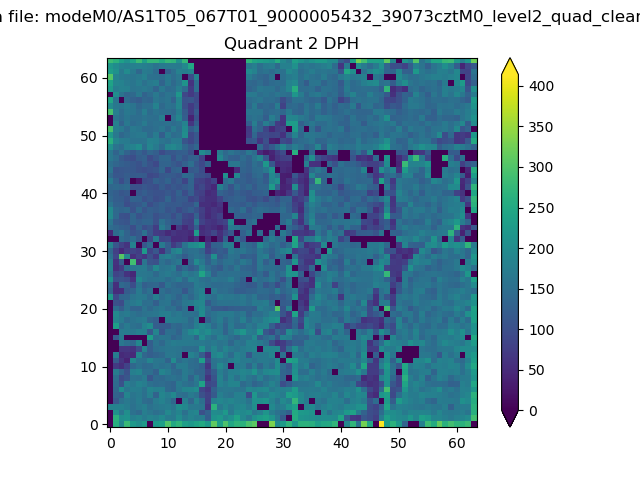
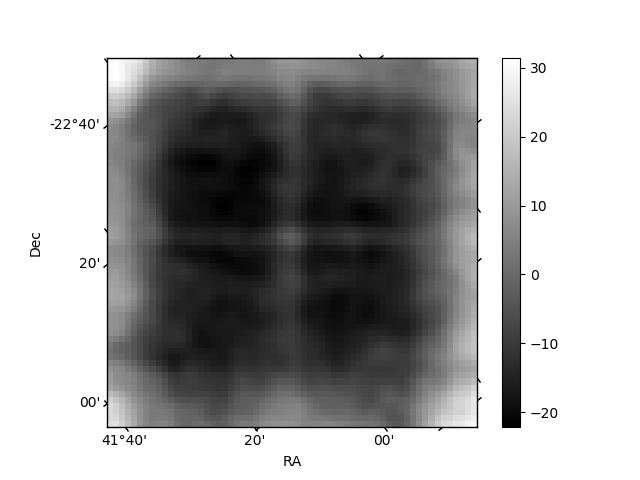
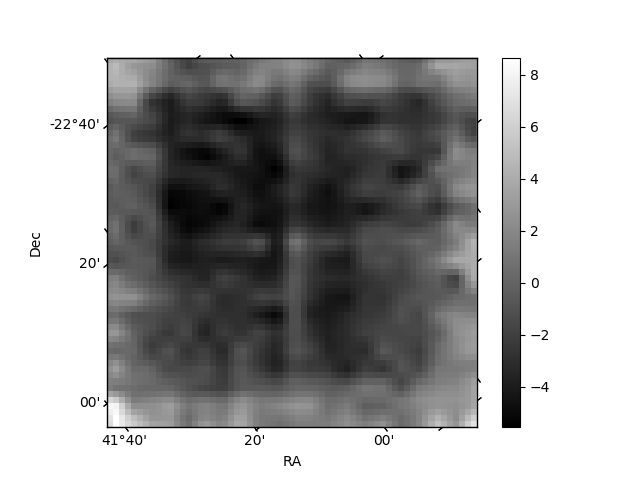
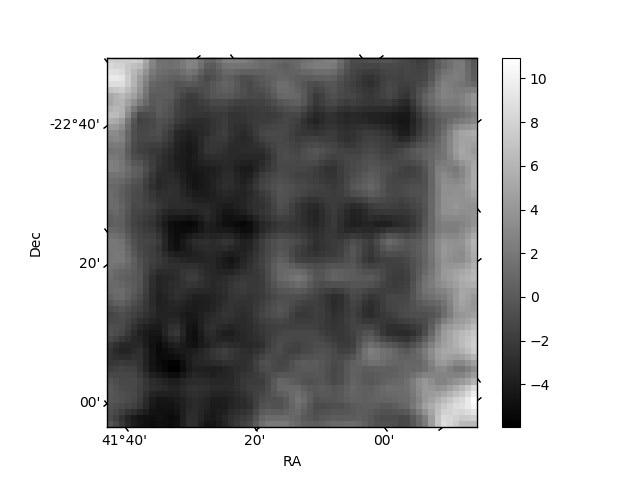
Histogram calculated using DETX and DETY for each event in the final _common_clean file
| Quadrant A | 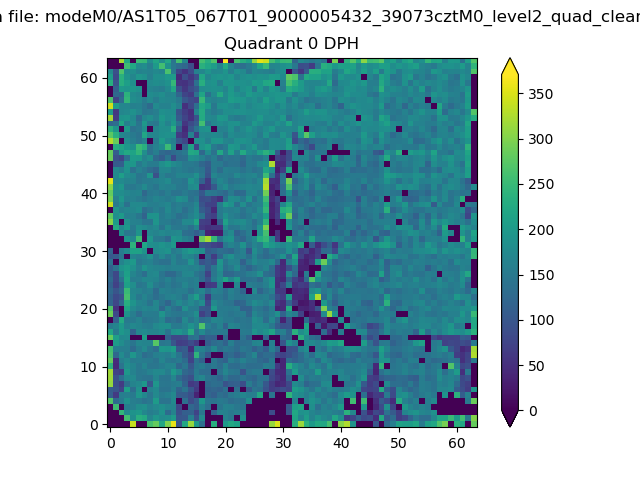 |
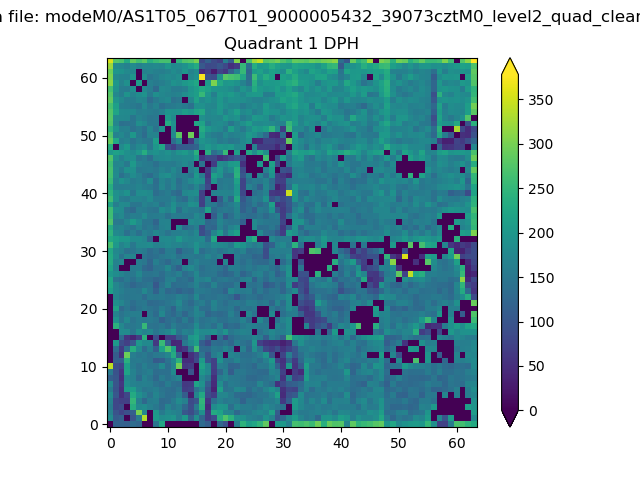 |
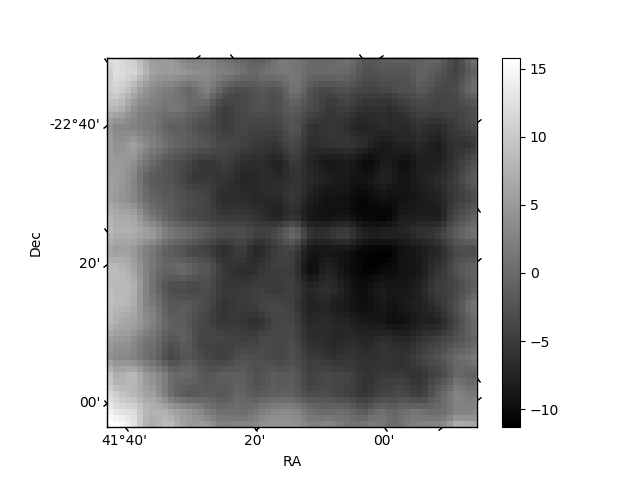
Quadrant B |
|---|---|---|---|
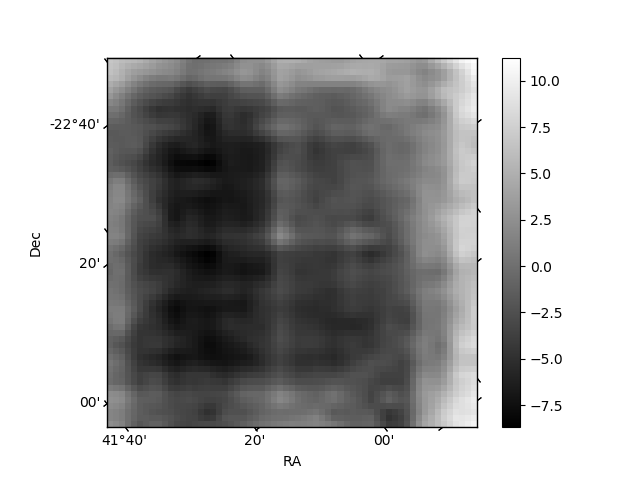
| Quadrant D | 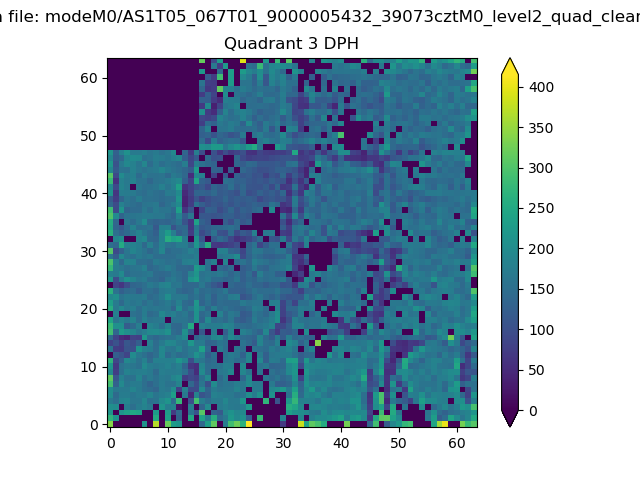 |
 |
Quadrant C |
| Plot type | Count rate plots | Images |
|---|---|---|
| Comparison with Poisson distribution Blue bars denote a histogram of data divided into 1 sec bins. Red curve is a Poisson curve with rate = median count rate of data. |
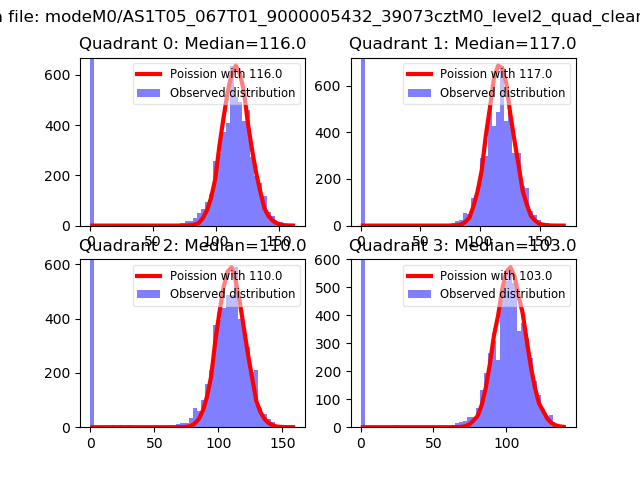 |
 |
| Quadrant-wise count rates Data is divided into 100 sec bins |
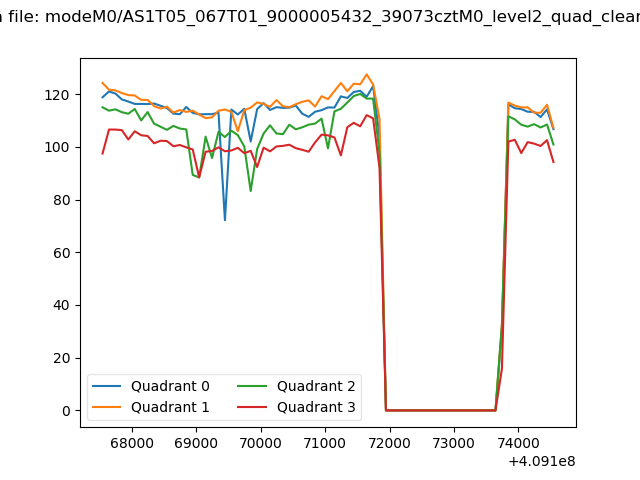 |
|
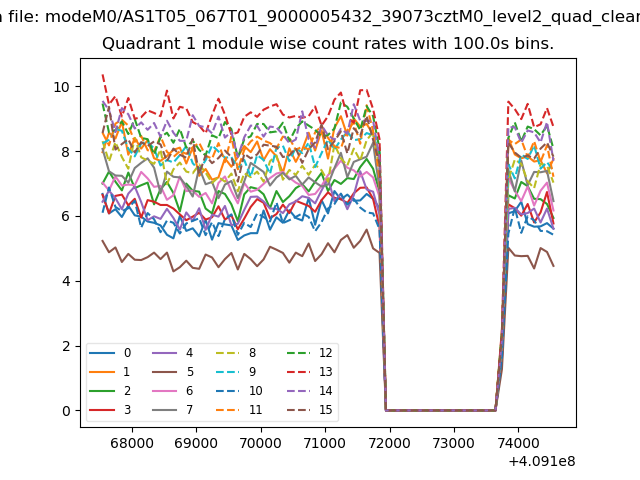
| Module-wise count rates for Quadrant A Data is divided into 100 sec bins |
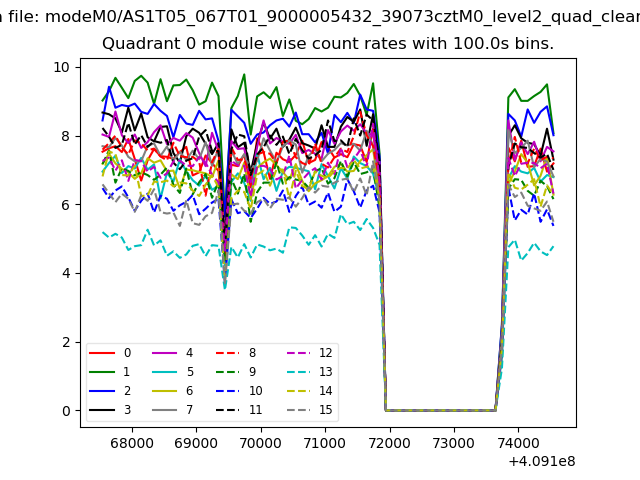 |
 |
| Module-wise count rates for Quadrant B Data is divided into 100 sec bins |
 |
 |
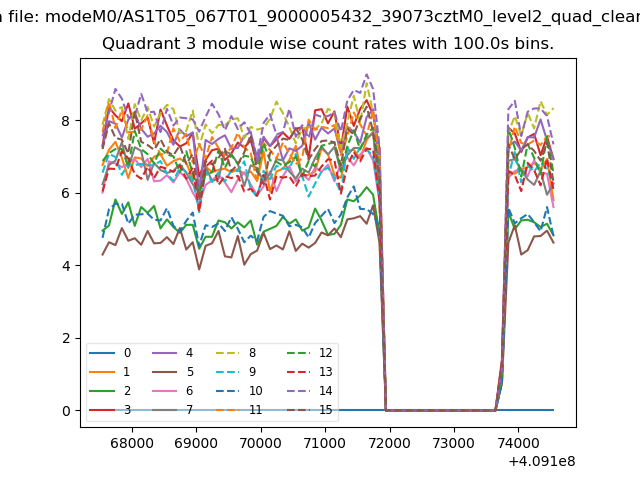
| Module-wise count rates for Quadrant C Data is divided into 100 sec bins |
 |
 |
| Module-wise count rates for Quadrant D Data is divided into 100 sec bins |
 |
 |
| Parameter | Plot |
|---|---|
| CZT HV Monitor | 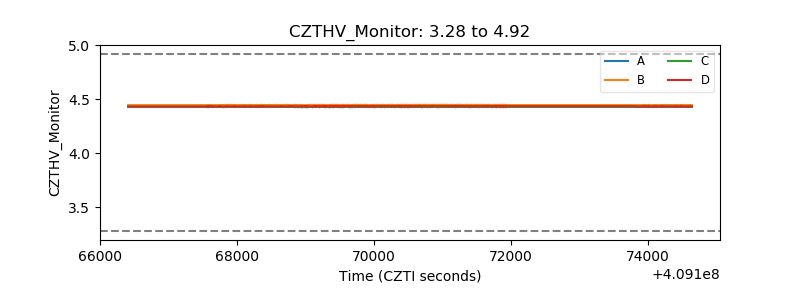 |
| D_VDD | 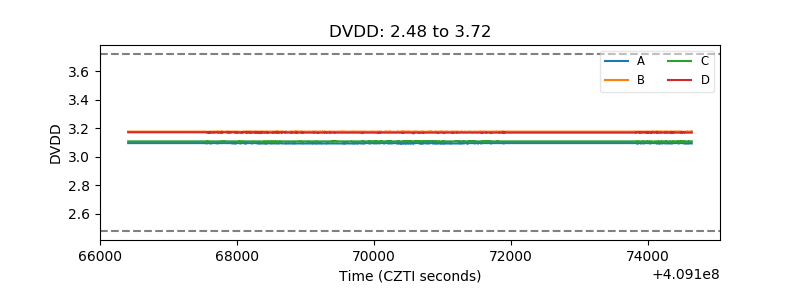 |
| Temperature 1 | 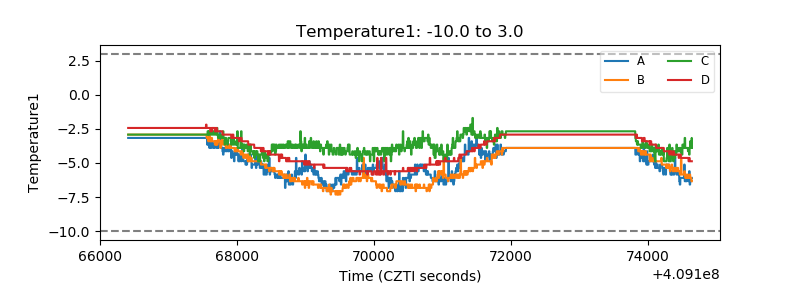 |
| Veto HV Monitor | 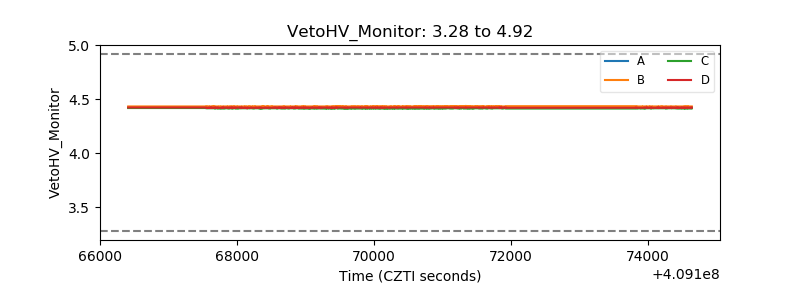 |
| Veto LLD | 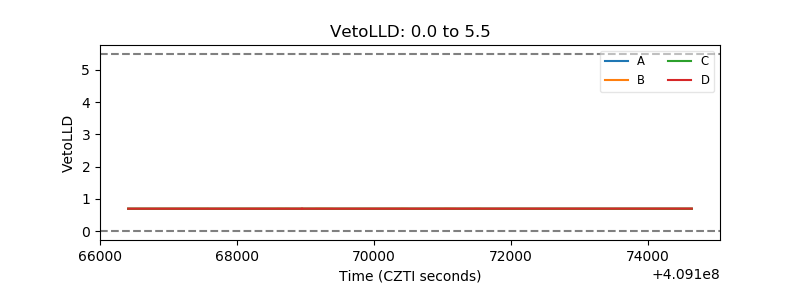 |
| Alpha Counter | 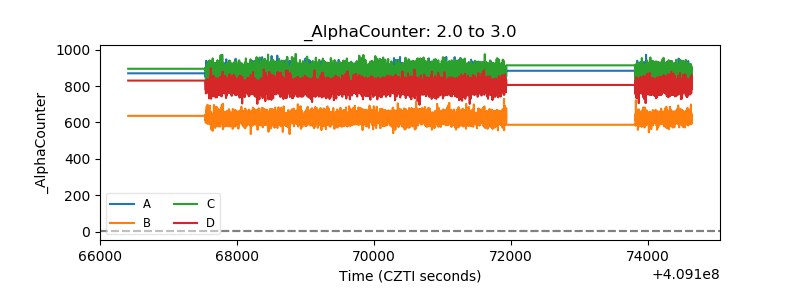 |
| _CPM_Rate | 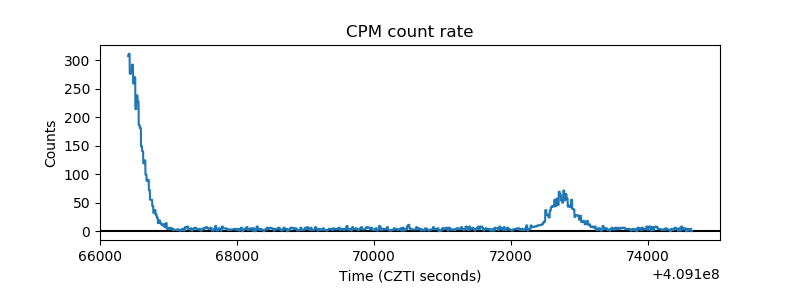 |
| CZT Counter | 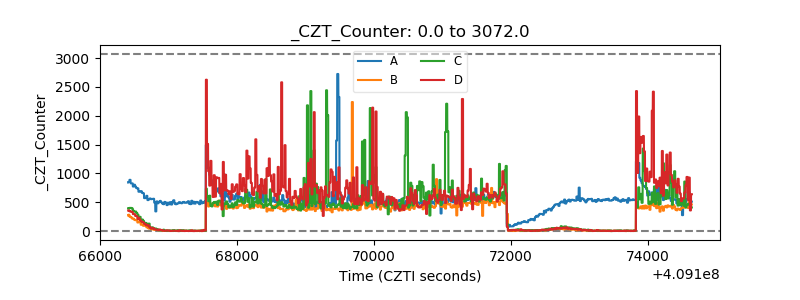 |
| +2.5 Volts monitor | 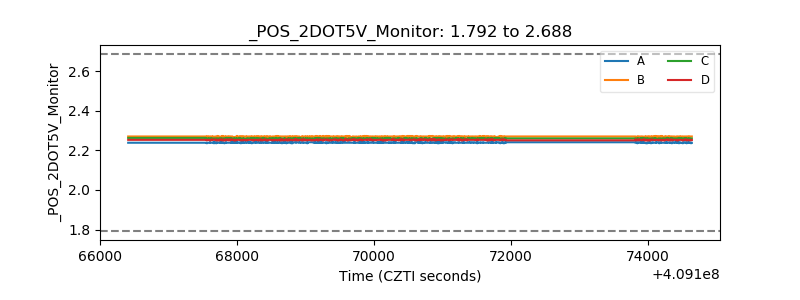 |
| +5 Volts monitor | 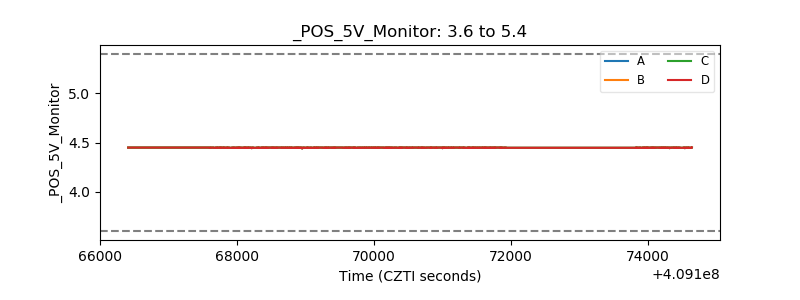 |
| _ROLL_ROT | 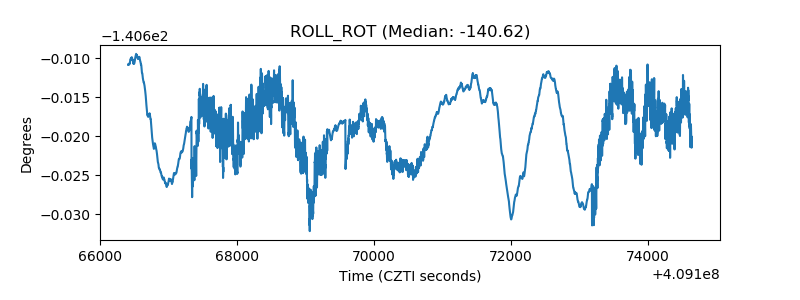 |
| _Roll_DEC | 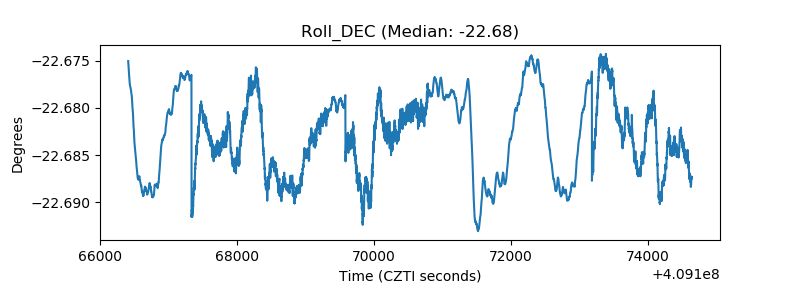 |
| _Roll_RA | 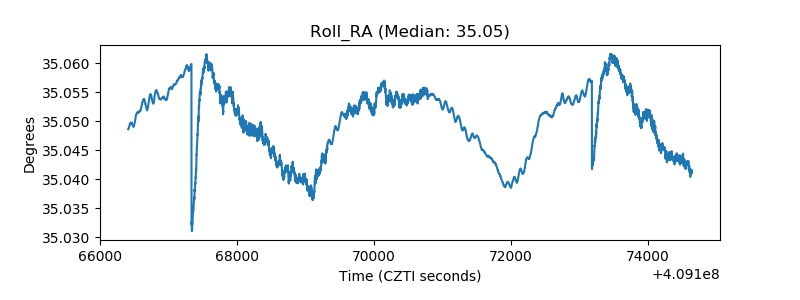 |
| Veto Counter | 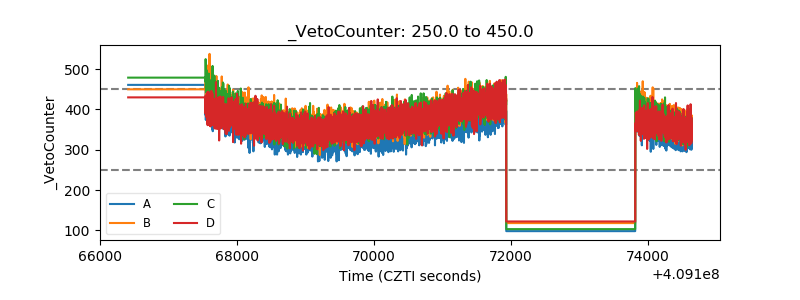 |