| Param | Original file | Final file |
|---|---|---|
| Filename | modeM0/AS1T05_067T01_9000005432_39074cztM0_level2.fits | modeM0/AS1T05_067T01_9000005432_39074cztM0_level2_quad_clean.evt |
| Size (bytes) | 405,365,760 | 92,505,600 |
| Size | 386.6 MB | 88.2 MB |
| Events in quadrant A | 3,114,797 | 631,895 |
| Events in quadrant B | 2,910,948 | 638,388 |
| Events in quadrant C | 3,935,490 | 581,037 |
| Events in quadrant D | 4,606,770 | 556,118 |
| Mode M0 | |||
|---|---|---|---|
| Quadrant | BADHDUFLAG | Total packets | Discarded packets |
| A | 0 | 12824 | 3 |
| B | 0 | 12747 | 2 |
| C | 0 | 15317 | 2 |
| D | 0 | 17440 | 2 |
| Mode SS | |||
|---|---|---|---|
| Quadrant | BADHDUFLAG | Total packets | Discarded packets |
| A | 0 | 116 | 0 |
| B | 0 | 116 | 0 |
| C | 0 | 116 | 0 |
| D | 0 | 116 | 0 |
| Mode M9 | |||
|---|---|---|---|
| Quadrant | BADHDUFLAG | Total packets | Discarded packets |
| A | 0 | 23 | 0 |
| B | 0 | 23 | 0 |
| C | 0 | 23 | 0 |
| D | 0 | 24 | 0 |
| Quadrant | Total seconds | Saturated seconds | Saturation percentage |
|---|---|---|---|
| A | 5624 | 17 | 0.302276% |
| B | 5624 | 87 | 1.546942% |
| C | 5624 | 330 | 5.867710% |
| D | 5624 | 173 | 3.076102% |
Noise dominated data is calculated using 1-second bins in cleaned event files. If a bin has >2000 counts, and if more than 50% of those come from <1% of pixels, then it is considered to be noise-dominated and hence unusable.
| Quadrant | # 1 sec bins | Bins with >0 counts | Bins with >2000 counts | High rate bins dominated by noise | Noise dominated (total time) | Noise dominated (detector-on time) | Marked lightcurve |
|---|---|---|---|---|---|---|---|
| A | 7146 | 5624 | 7 | 7 | 0.10% | 0.12% | 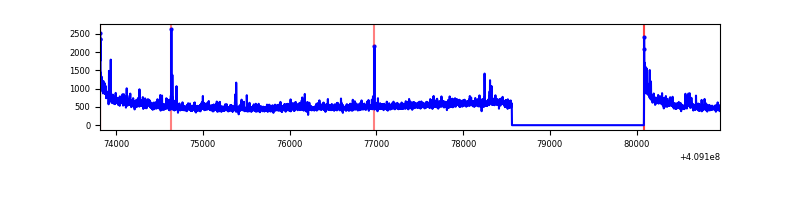 |
| B | 7146 | 5624 | 69 | 69 | 0.97% | 1.23% | 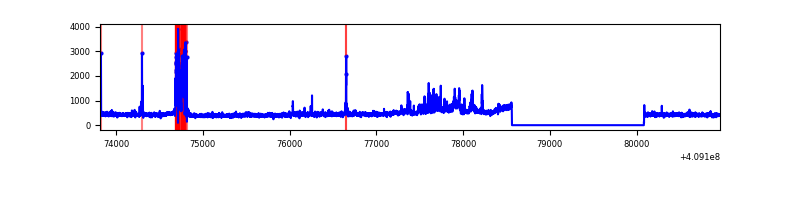 |
| C | 7146 | 5624 | 310 | 310 | 4.34% | 5.51% | 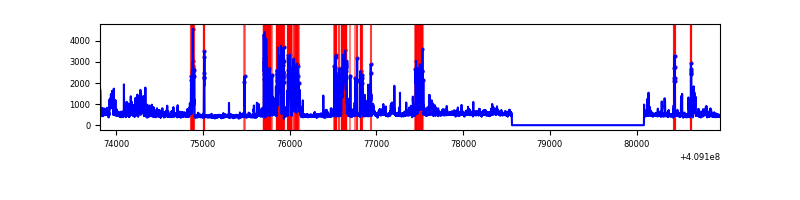 |
| D | 7146 | 5624 | 164 | 164 | 2.29% | 2.92% | 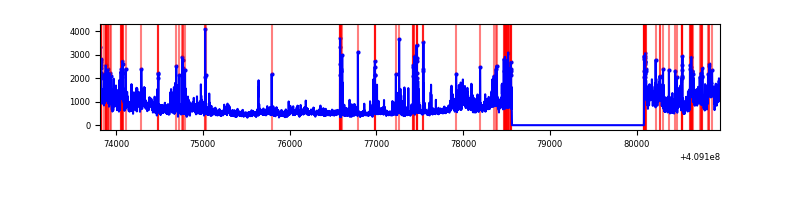 |
Top three noisy pixels from each quadrant. If the there are fewer than three noisy pixels in the level2.evt file, extra rows are filled as -1
| Pixel properties | Quadrant properties | ||||||
|---|---|---|---|---|---|---|---|
| Quadrant | DetID | PixID | Counts | Sigma | Mean | Median | Sigma |
| A | 10 | 83 | 422931 | 3325.36 | 620 | 608 | 127.0 |
| A | 15 | 222 | 224760 | 1764.96 | 620 | 608 | 127.0 |
| A | 7 | 3 | 22855 | 175.17 | 620 | 608 | 127.0 |
| B | 5 | 184 | 434852 | 3638.23 | 615 | 598 | 119.4 |
| B | 5 | 172 | 29463 | 241.83 | 615 | 598 | 119.4 |
| B | 0 | 230 | 20670 | 168.16 | 615 | 598 | 119.4 |
| C | 15 | 208 | 1323811 | 9480.37 | 592 | 594 | 139.6 |
| C | 15 | 214 | 231383 | 1653.52 | 592 | 594 | 139.6 |
| C | 3 | 233 | 58637 | 415.86 | 592 | 594 | 139.6 |
| D | 12 | 235 | 1613619 | 11078.0 | 597 | 580 | 145.6 |
| D | 12 | 227 | 343245 | 2353.35 | 597 | 580 | 145.6 |
| D | 1 | 47 | 168838 | 1155.56 | 597 | 580 | 145.6 |
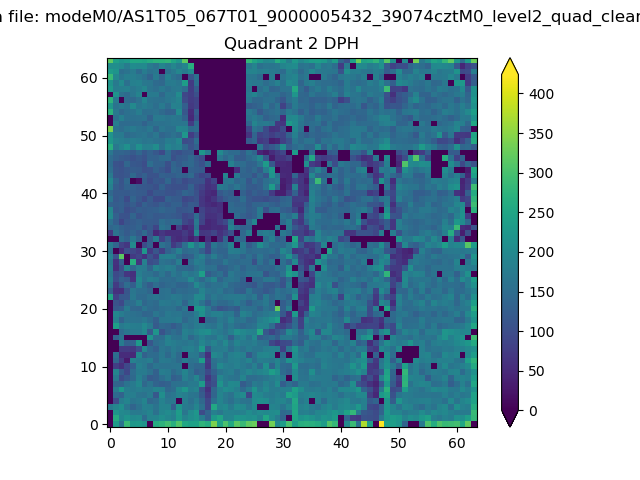
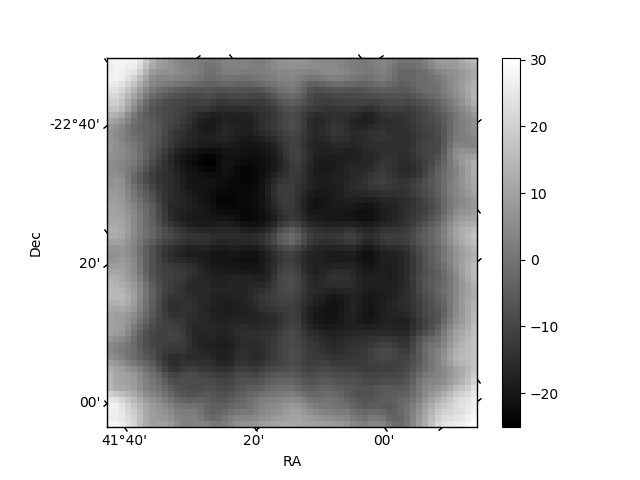
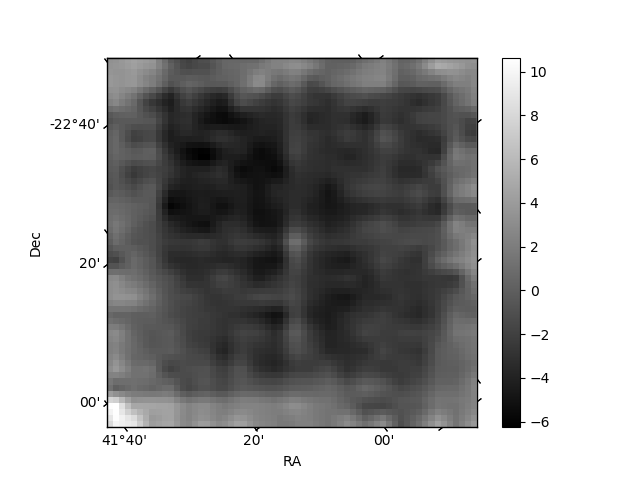
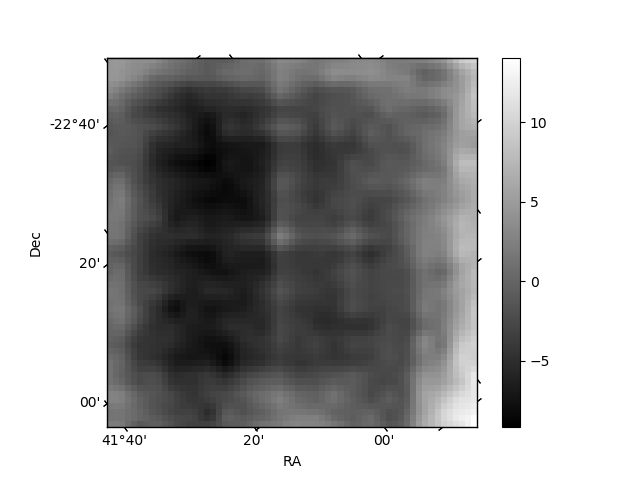
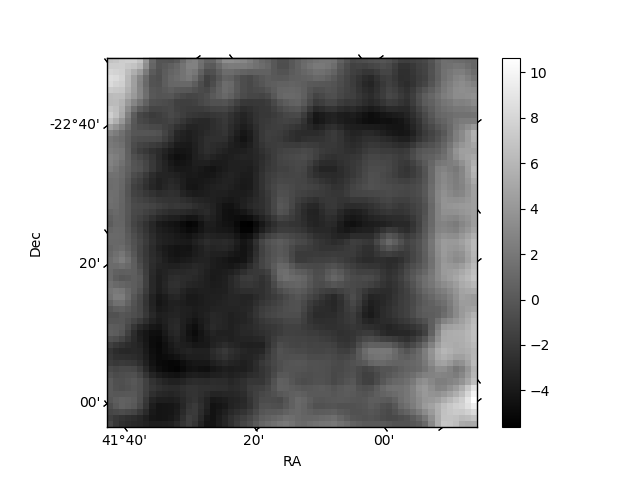
Histogram calculated using DETX and DETY for each event in the final _common_clean file
| Quadrant A | 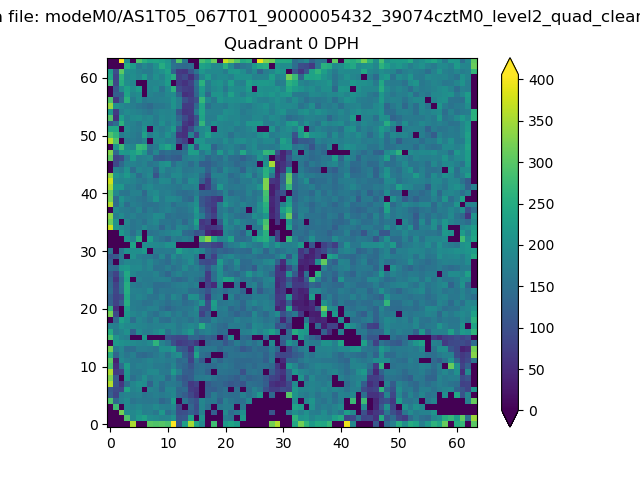 |
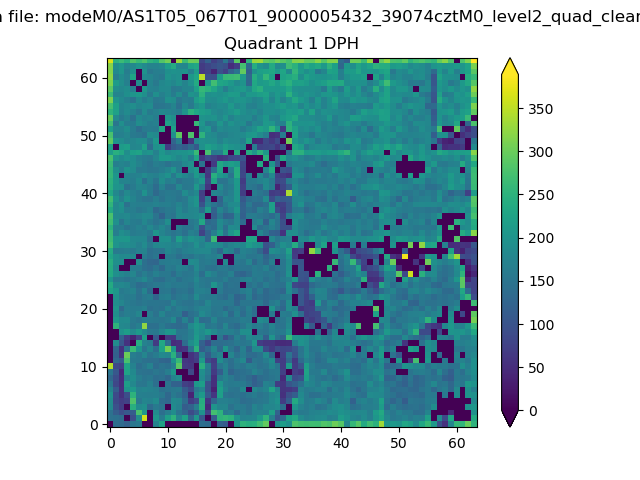 |
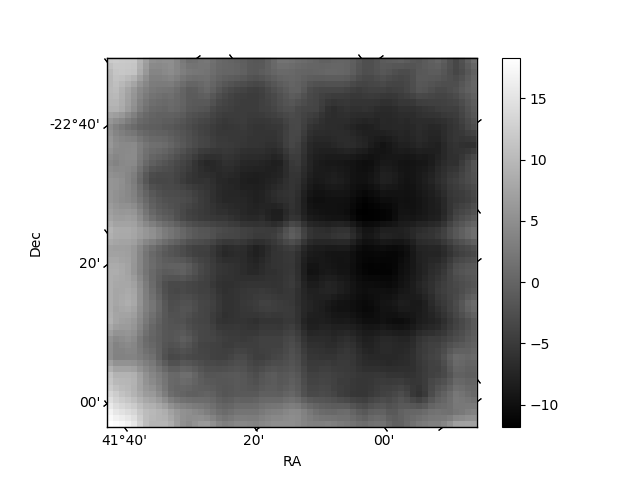
Quadrant B |
|---|---|---|---|
| Quadrant D | 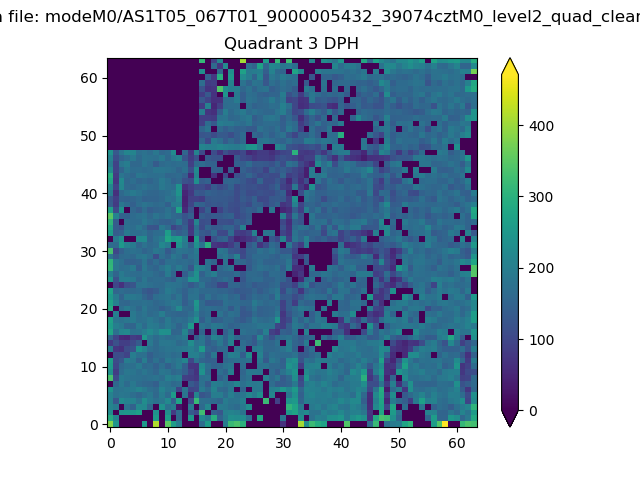 |
 |
Quadrant C |
| Plot type | Count rate plots | Images |
|---|---|---|
| Comparison with Poisson distribution Blue bars denote a histogram of data divided into 1 sec bins. Red curve is a Poisson curve with rate = median count rate of data. |
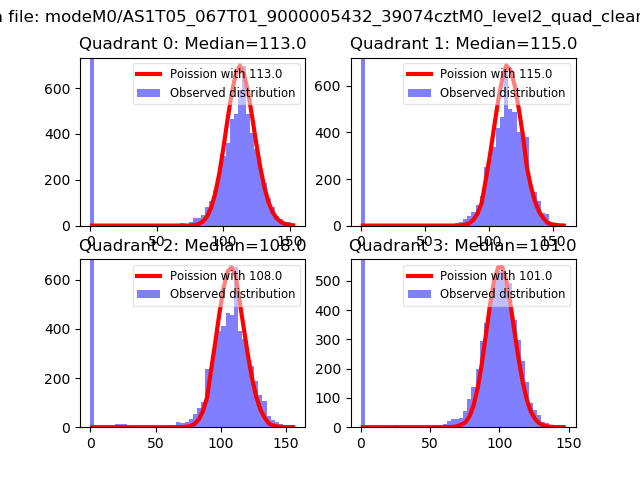 |
 |
| Quadrant-wise count rates Data is divided into 100 sec bins |
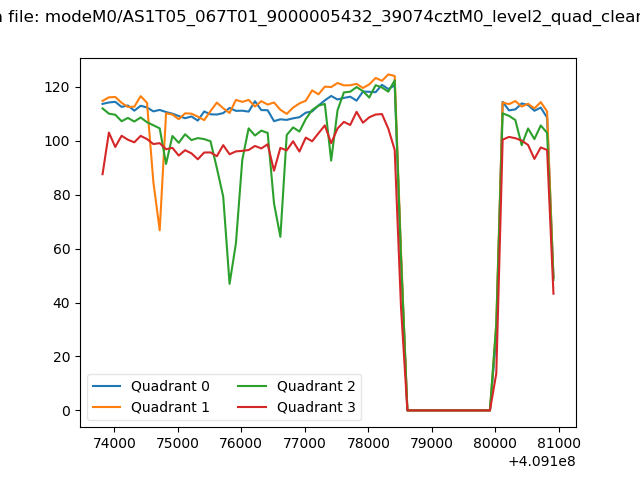 |
|
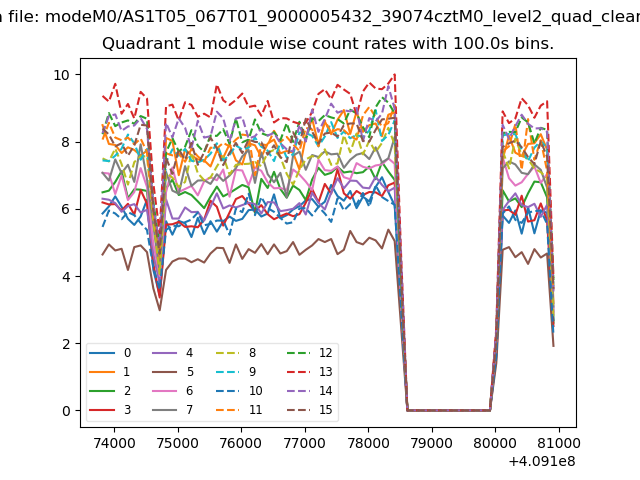
| Module-wise count rates for Quadrant A Data is divided into 100 sec bins |
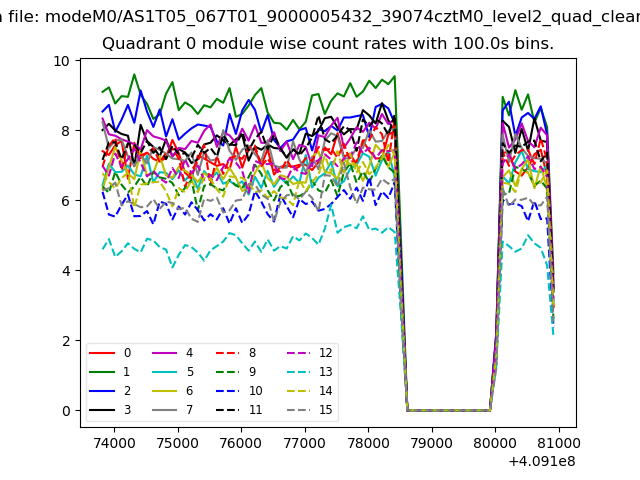 |
 |
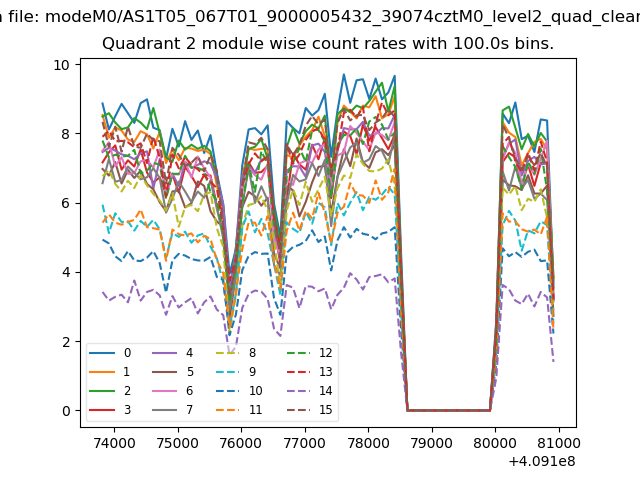
| Module-wise count rates for Quadrant B Data is divided into 100 sec bins |
 |
 |
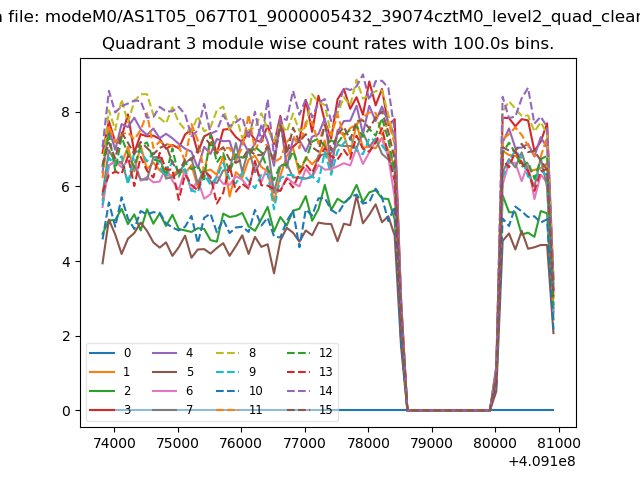
| Module-wise count rates for Quadrant C Data is divided into 100 sec bins |
 |
 |
| Module-wise count rates for Quadrant D Data is divided into 100 sec bins |
 |
 |
| Parameter | Plot |
|---|---|
| CZT HV Monitor | 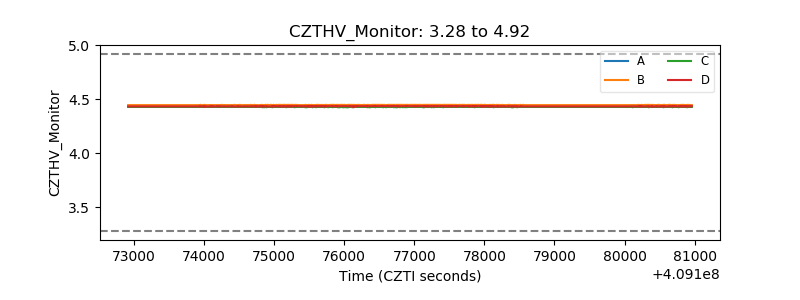 |
| D_VDD | 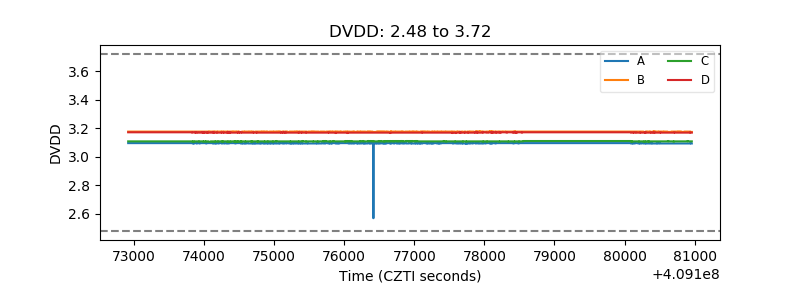 |
| Temperature 1 | 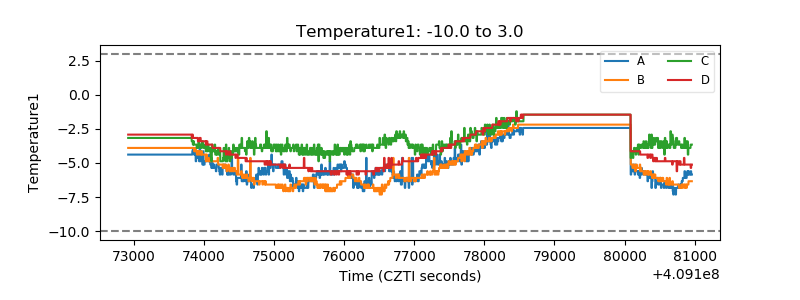 |
| Veto HV Monitor | 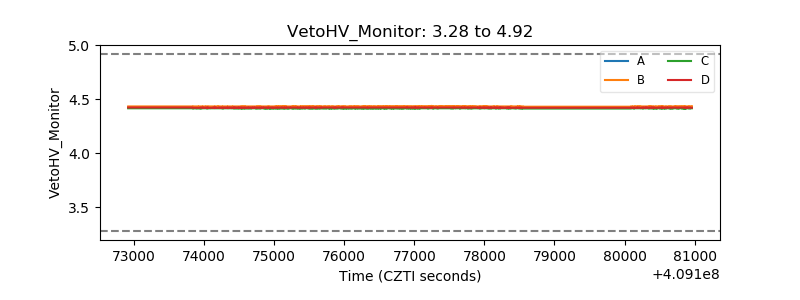 |
| Veto LLD | 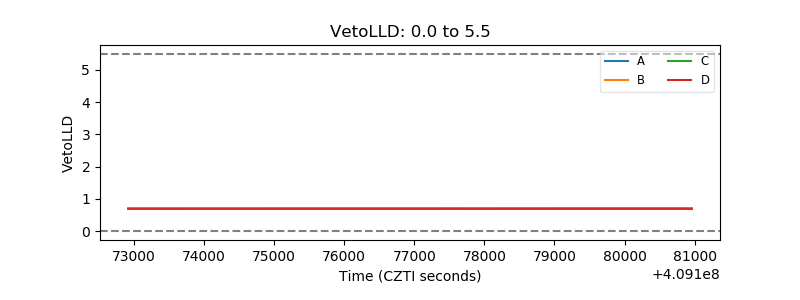 |
| Alpha Counter | 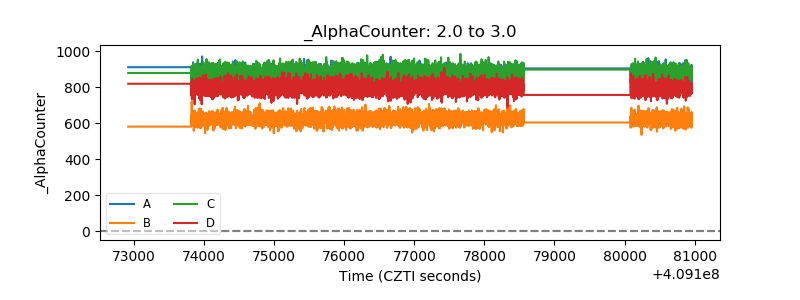 |
| _CPM_Rate | 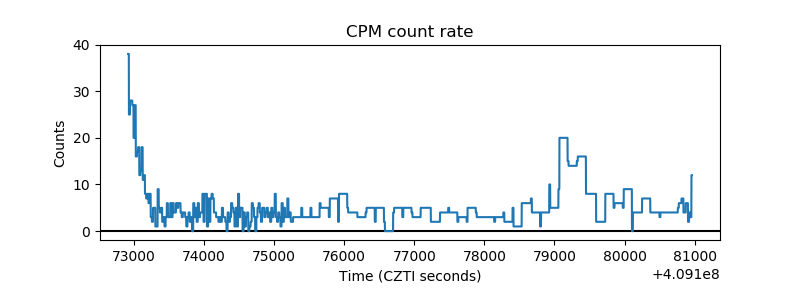 |
| CZT Counter | 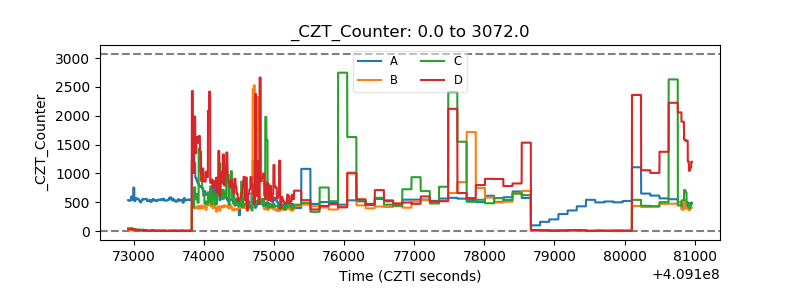 |
| +2.5 Volts monitor | 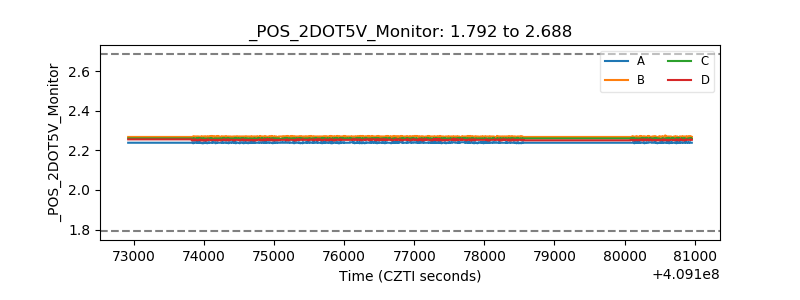 |
| +5 Volts monitor | 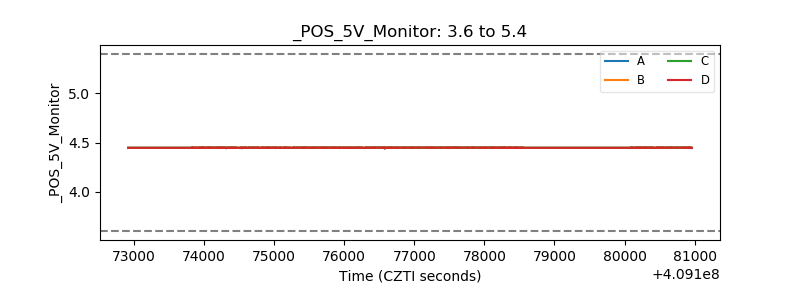 |
| _ROLL_ROT | 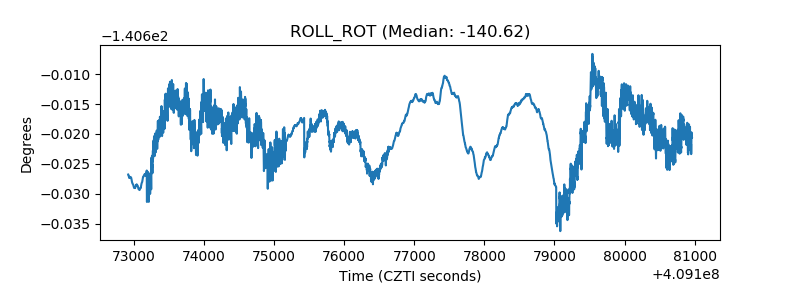 |
| _Roll_DEC | 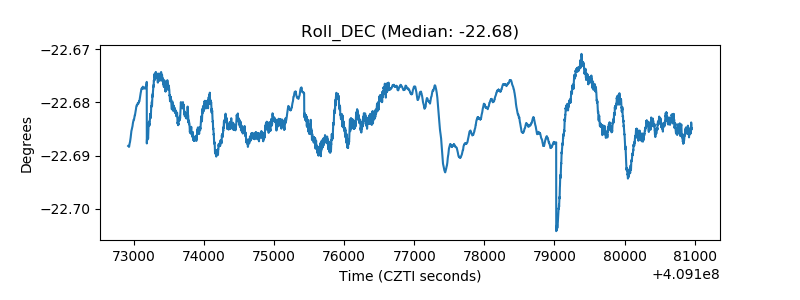 |
| _Roll_RA | 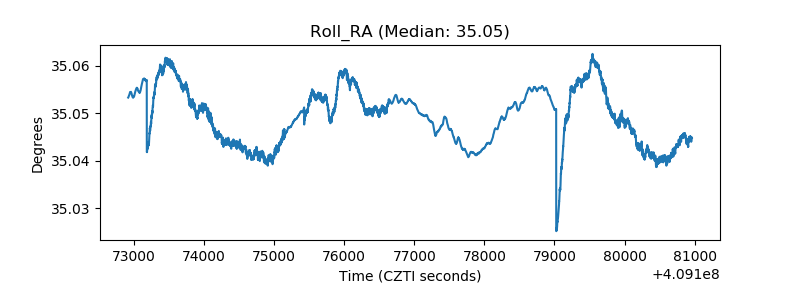 |
| Veto Counter | 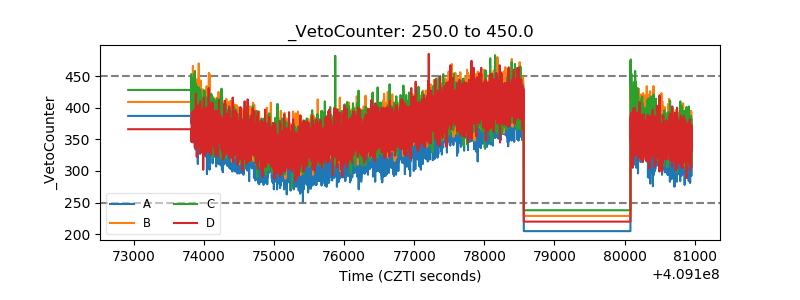 |