| Param | Original file | Final file |
|---|---|---|
| Filename | modeM0/AS1T05_067T01_9000005432_39075cztM0_level2.fits | modeM0/AS1T05_067T01_9000005432_39075cztM0_level2_quad_clean.evt |
| Size (bytes) | 439,378,560 | 101,381,760 |
| Size | 419.0 MB | 96.7 MB |
| Events in quadrant A | 3,812,479 | 685,060 |
| Events in quadrant B | 2,808,904 | 701,234 |
| Events in quadrant C | 4,252,075 | 649,705 |
| Events in quadrant D | 4,915,424 | 606,266 |
| Mode M0 | |||
|---|---|---|---|
| Quadrant | BADHDUFLAG | Total packets | Discarded packets |
| A | 0 | 15294 | 3 |
| B | 0 | 12593 | 2 |
| C | 0 | 16595 | 2 |
| D | 0 | 18763 | 2 |
| Mode SS | |||
|---|---|---|---|
| Quadrant | BADHDUFLAG | Total packets | Discarded packets |
| A | 0 | 126 | 0 |
| B | 0 | 126 | 0 |
| C | 0 | 126 | 0 |
| D | 0 | 126 | 0 |
| Mode M9 | |||
|---|---|---|---|
| Quadrant | BADHDUFLAG | Total packets | Discarded packets |
| A | 0 | 29 | 0 |
| B | 0 | 29 | 0 |
| C | 0 | 29 | 0 |
| D | 0 | 29 | 0 |
| Quadrant | Total seconds | Saturated seconds | Saturation percentage |
|---|---|---|---|
| A | 6124 | 48 | 0.783801% |
| B | 6124 | 15 | 0.244938% |
| C | 6124 | 139 | 2.269758% |
| D | 6124 | 146 | 2.384063% |
Noise dominated data is calculated using 1-second bins in cleaned event files. If a bin has >2000 counts, and if more than 50% of those come from <1% of pixels, then it is considered to be noise-dominated and hence unusable.
| Quadrant | # 1 sec bins | Bins with >0 counts | Bins with >2000 counts | High rate bins dominated by noise | Noise dominated (total time) | Noise dominated (detector-on time) | Marked lightcurve |
|---|---|---|---|---|---|---|---|
| A | 8990 | 6126 | 13 | 13 | 0.14% | 0.21% | 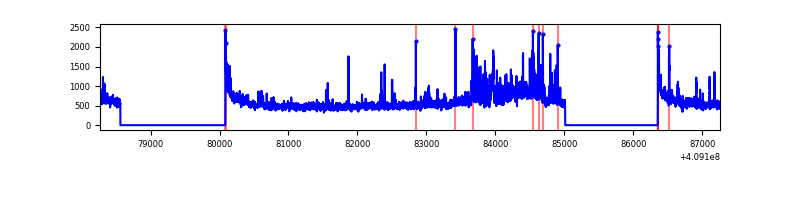 |
| B | 8990 | 6126 | 1 | 1 | 0.01% | 0.02% | 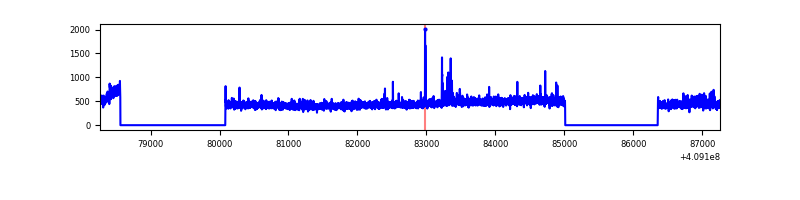 |
| C | 8990 | 6126 | 137 | 137 | 1.52% | 2.24% | 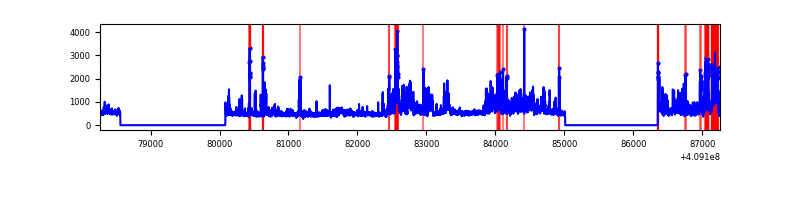 |
| D | 8990 | 6126 | 130 | 130 | 1.45% | 2.12% | 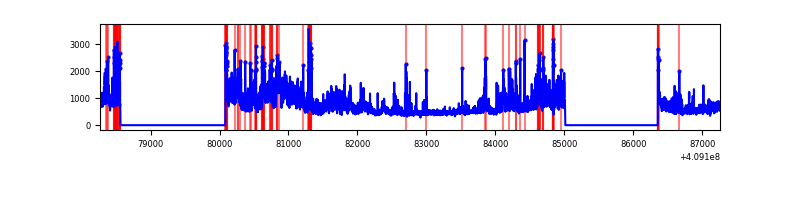 |
Top three noisy pixels from each quadrant. If the there are fewer than three noisy pixels in the level2.evt file, extra rows are filled as -1
| Pixel properties | Quadrant properties | ||||||
|---|---|---|---|---|---|---|---|
| Quadrant | DetID | PixID | Counts | Sigma | Mean | Median | Sigma |
| A | 15 | 222 | 634476 | 4552.33 | 685 | 670 | 139.2 |
| A | 10 | 83 | 444227 | 3185.86 | 685 | 670 | 139.2 |
| A | 13 | 248 | 28712 | 201.41 | 685 | 670 | 139.2 |
| B | 5 | 172 | 39084 | 288.04 | 684 | 665 | 133.4 |
| B | 5 | 184 | 38798 | 285.9 | 684 | 665 | 133.4 |
| B | 0 | 213 | 29459 | 215.88 | 684 | 665 | 133.4 |
| C | 3 | 233 | 722685 | 4616.39 | 664 | 667 | 156.4 |
| C | 15 | 208 | 673537 | 4302.15 | 664 | 667 | 156.4 |
| C | 15 | 214 | 255150 | 1627.1 | 664 | 667 | 156.4 |
| D | 12 | 235 | 1769596 | 10987.08 | 660 | 643 | 161.0 |
| D | 12 | 227 | 194158 | 1201.93 | 660 | 643 | 161.0 |
| D | 2 | 249 | 142996 | 884.16 | 660 | 643 | 161.0 |
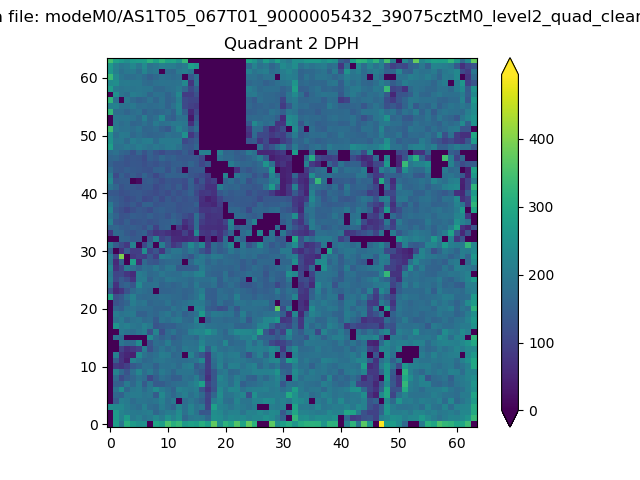
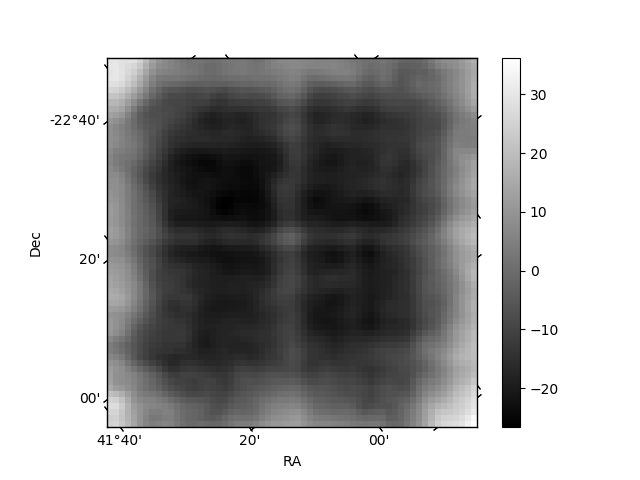
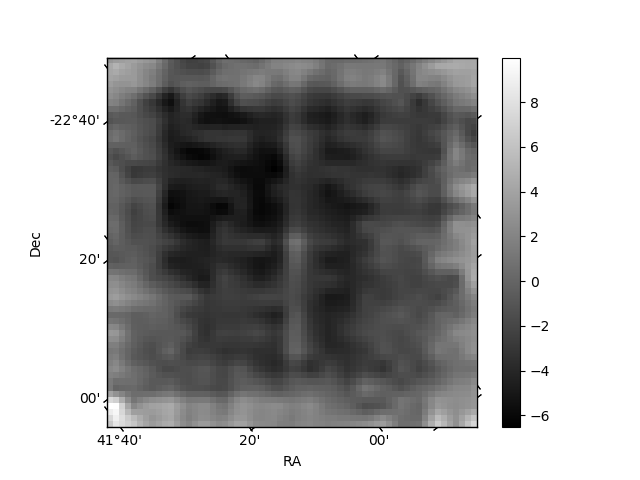
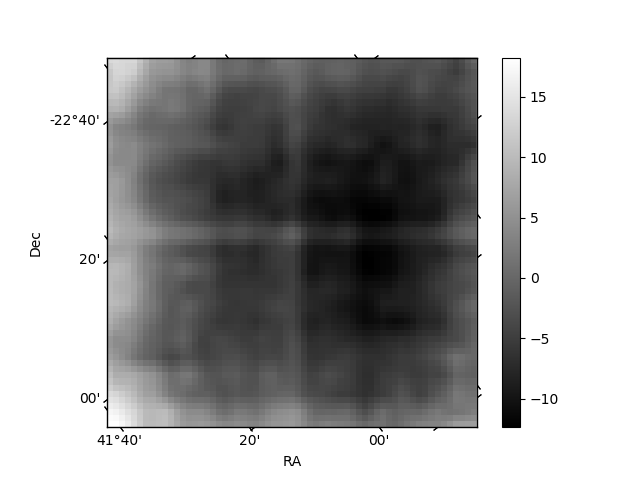
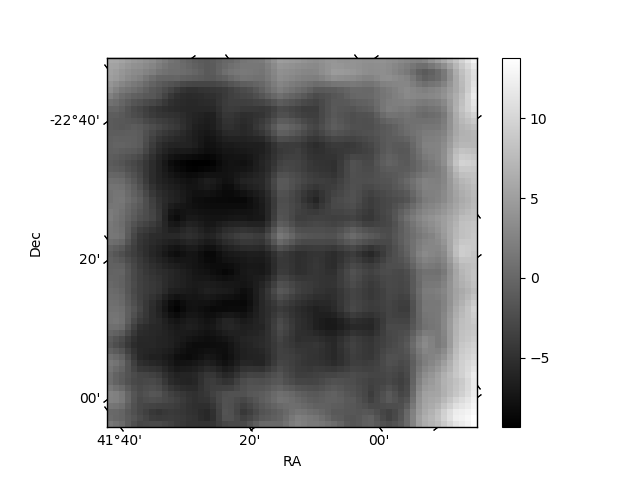
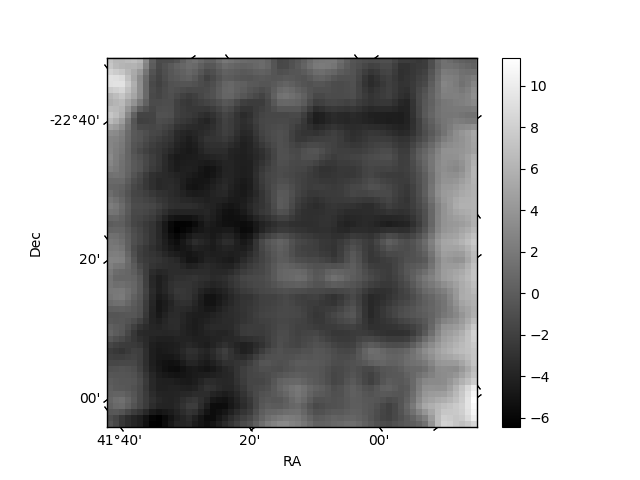
Histogram calculated using DETX and DETY for each event in the final _common_clean file
| Quadrant A | 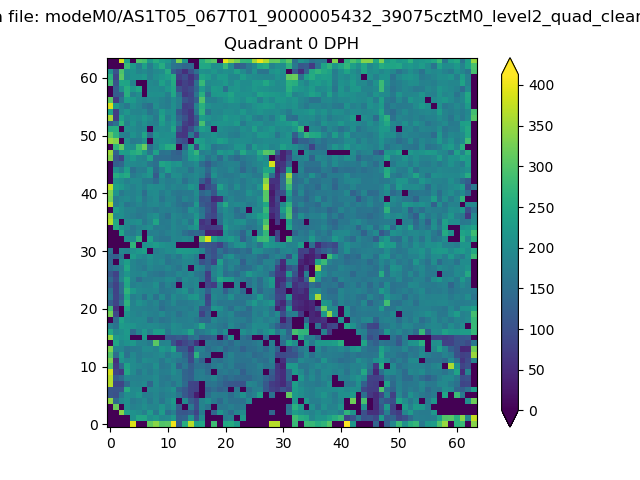 |
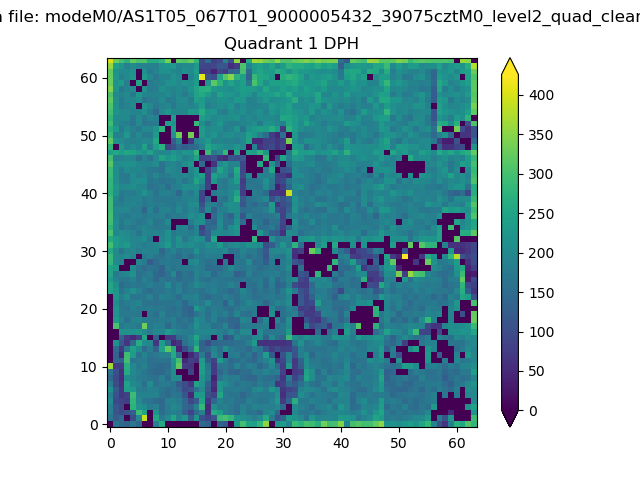 |
Quadrant B |
|---|---|---|---|
| Quadrant D | 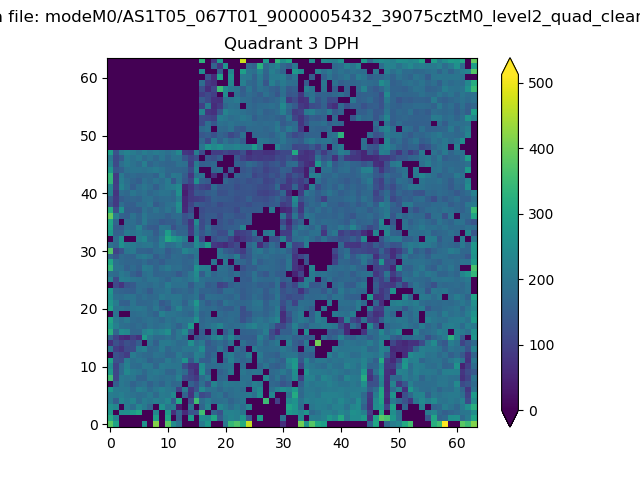 |
 |
Quadrant C |
| Plot type | Count rate plots | Images |
|---|---|---|
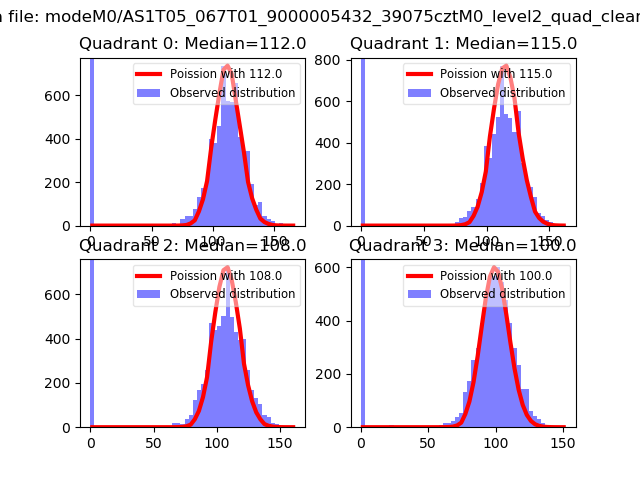
| Comparison with Poisson distribution Blue bars denote a histogram of data divided into 1 sec bins. Red curve is a Poisson curve with rate = median count rate of data. |
 |
 |
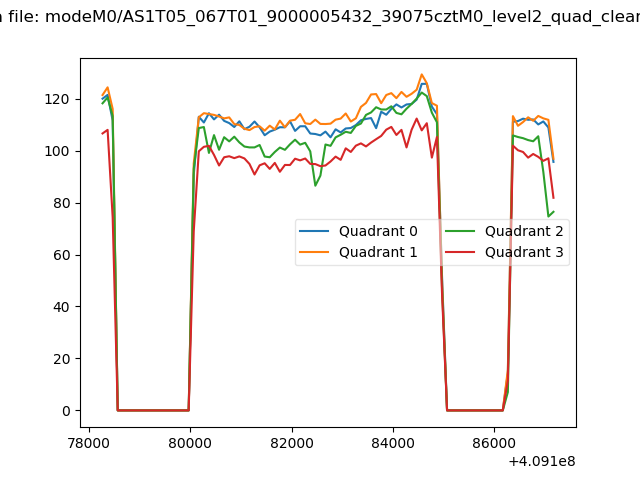
| Quadrant-wise count rates Data is divided into 100 sec bins |
 |
|
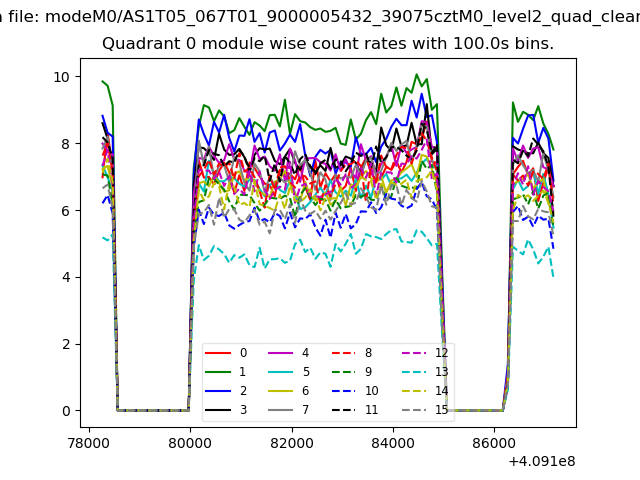
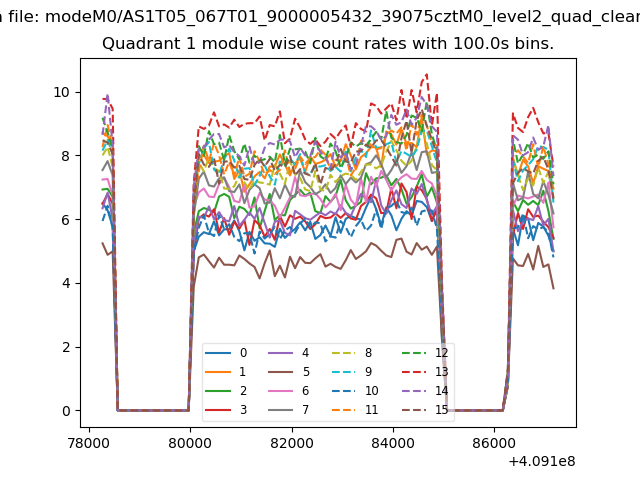
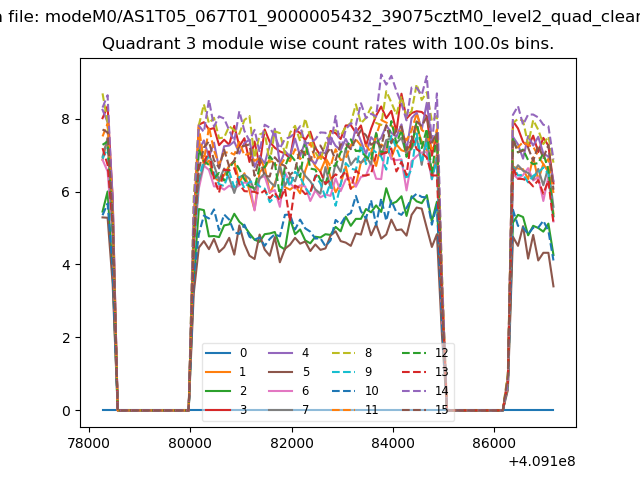
| Module-wise count rates for Quadrant A Data is divided into 100 sec bins |
 |
 |
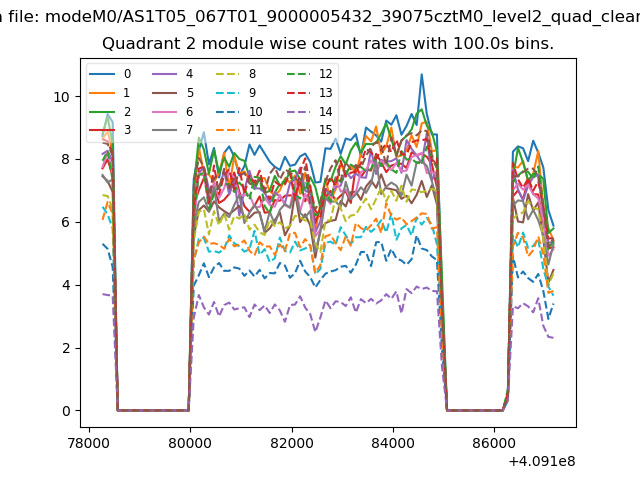
| Module-wise count rates for Quadrant B Data is divided into 100 sec bins |
 |
 |
| Module-wise count rates for Quadrant C Data is divided into 100 sec bins |
 |
 |
| Module-wise count rates for Quadrant D Data is divided into 100 sec bins |
 |
 |
| Parameter | Plot |
|---|---|
| CZT HV Monitor | 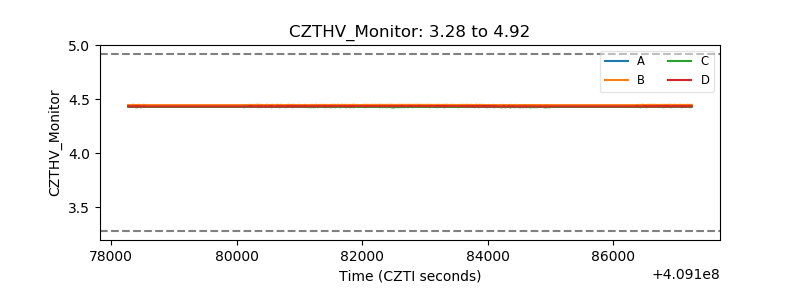 |
| D_VDD | 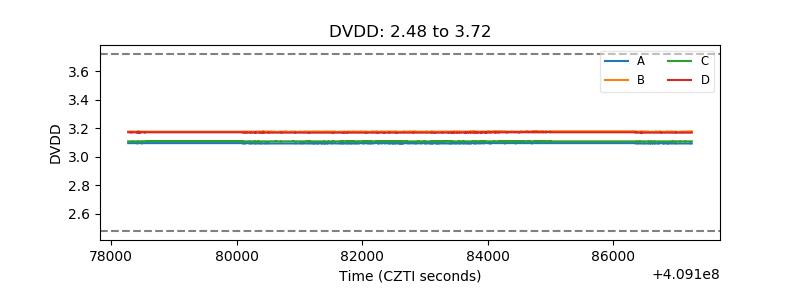 |
| Temperature 1 | 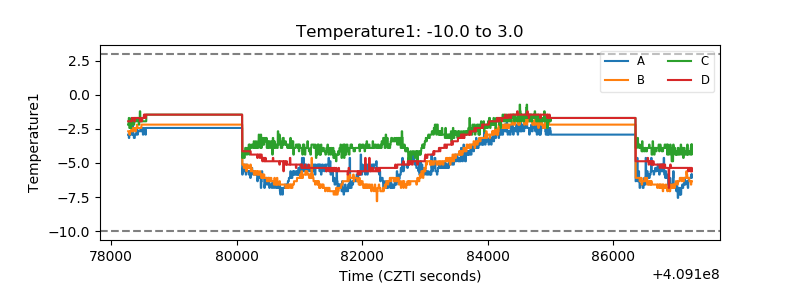 |
| Veto HV Monitor | 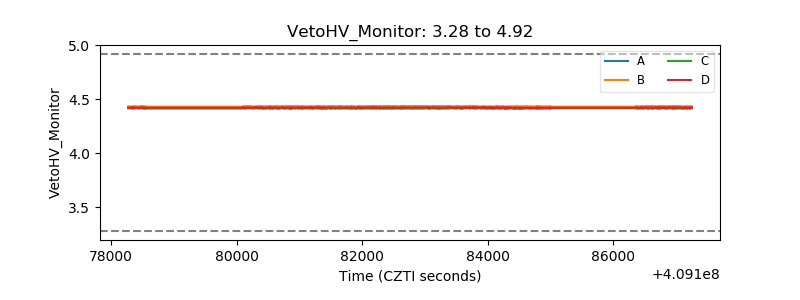 |
| Veto LLD | 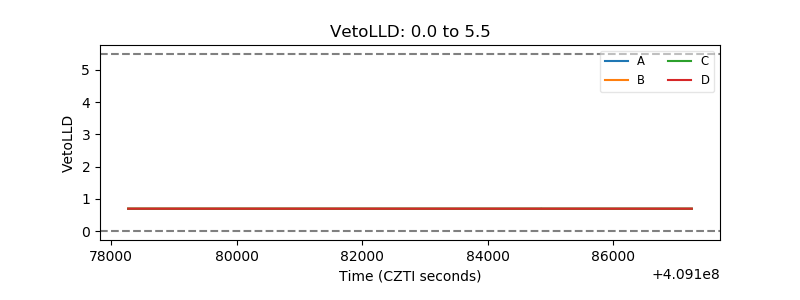 |
| Alpha Counter | 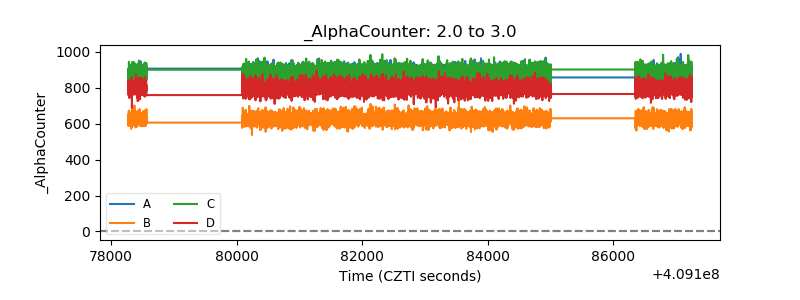 |
| _CPM_Rate | 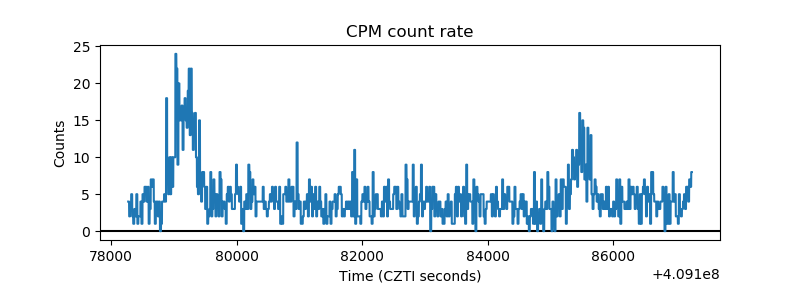 |
| CZT Counter | 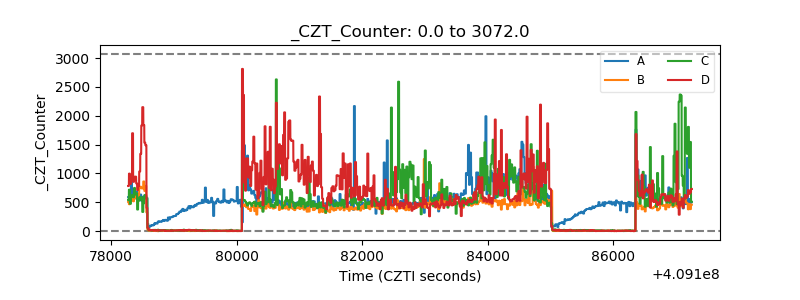 |
| +2.5 Volts monitor | 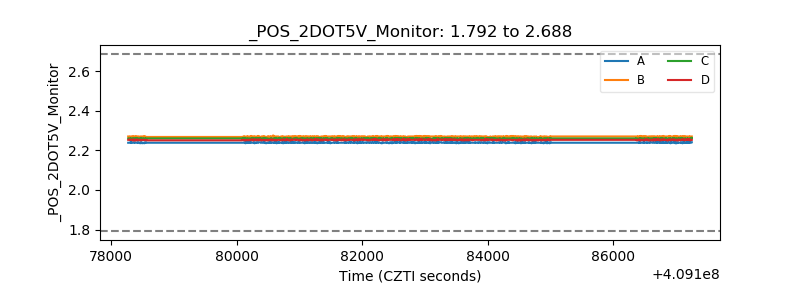 |
| +5 Volts monitor | 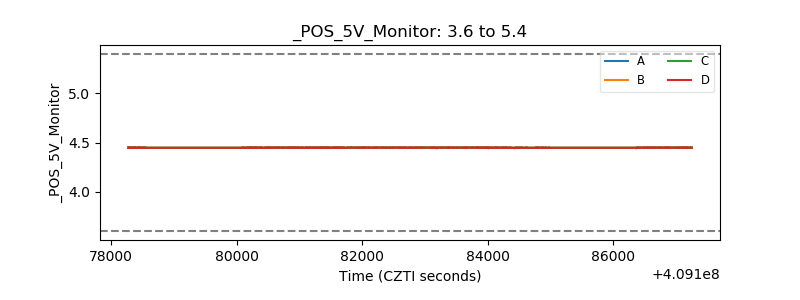 |
| _ROLL_ROT | 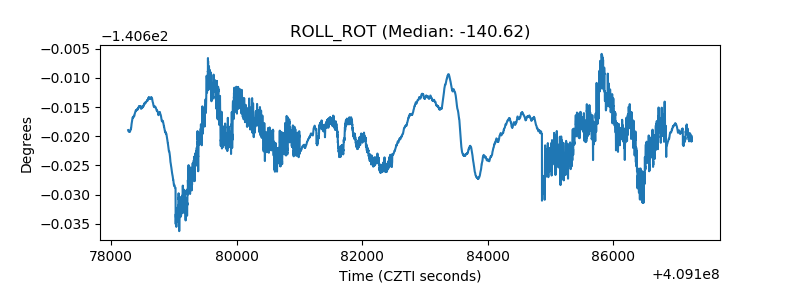 |
| _Roll_DEC | 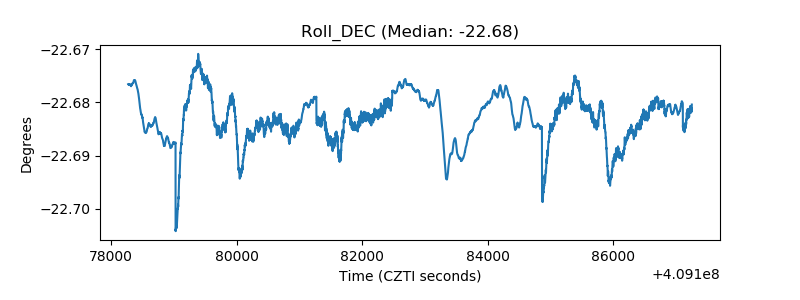 |
| _Roll_RA | 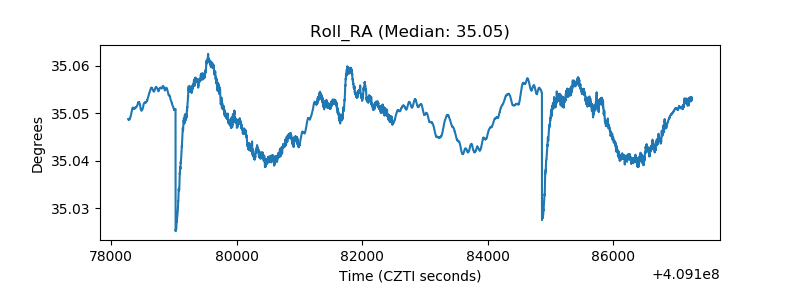 |
| Veto Counter | 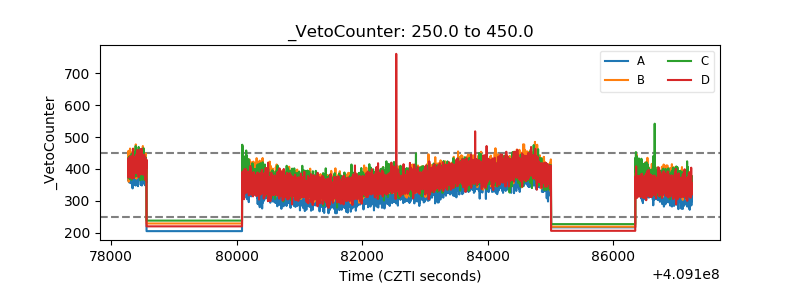 |