| Param | Original file | Final file |
|---|---|---|
| Filename | modeM0/AS1T05_067T01_9000005432_39076cztM0_level2.fits | modeM0/AS1T05_067T01_9000005432_39076cztM0_level2_quad_clean.evt |
| Size (bytes) | 525,934,080 | 103,668,480 |
| Size | 501.6 MB | 98.9 MB |
| Events in quadrant A | 4,044,251 | 716,503 |
| Events in quadrant B | 3,346,772 | 734,782 |
| Events in quadrant C | 5,277,159 | 648,056 |
| Events in quadrant D | 6,298,493 | 588,865 |
| Mode M0 | |||
|---|---|---|---|
| Quadrant | BADHDUFLAG | Total packets | Discarded packets |
| A | 0 | 16289 | 3 |
| B | 0 | 14213 | 2 |
| C | 0 | 19983 | 2 |
| D | 0 | 23168 | 2 |
| Mode SS | |||
|---|---|---|---|
| Quadrant | BADHDUFLAG | Total packets | Discarded packets |
| A | 0 | 130 | 0 |
| B | 0 | 130 | 0 |
| C | 0 | 130 | 0 |
| D | 0 | 130 | 0 |
| Mode M9 | |||
|---|---|---|---|
| Quadrant | BADHDUFLAG | Total packets | Discarded packets |
| A | 0 | 28 | 0 |
| B | 0 | 28 | 0 |
| C | 0 | 28 | 0 |
| D | 0 | 28 | 0 |
| Quadrant | Total seconds | Saturated seconds | Saturation percentage |
|---|---|---|---|
| A | 6472 | 44 | 0.679852% |
| B | 6472 | 13 | 0.200865% |
| C | 6472 | 469 | 7.246601% |
| D | 6472 | 643 | 9.935105% |
Noise dominated data is calculated using 1-second bins in cleaned event files. If a bin has >2000 counts, and if more than 50% of those come from <1% of pixels, then it is considered to be noise-dominated and hence unusable.
| Quadrant | # 1 sec bins | Bins with >0 counts | Bins with >2000 counts | High rate bins dominated by noise | Noise dominated (total time) | Noise dominated (detector-on time) | Marked lightcurve |
|---|---|---|---|---|---|---|---|
| A | 9128 | 6474 | 25 | 25 | 0.27% | 0.39% | 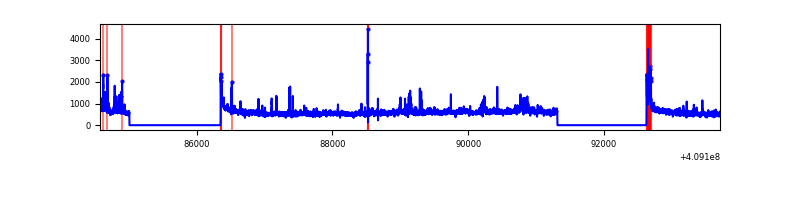 |
| B | 9128 | 6474 | 1 | 1 | 0.01% | 0.02% | 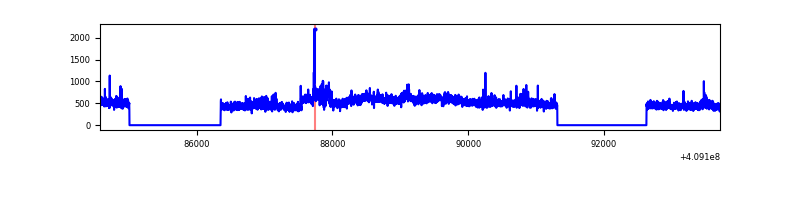 |
| C | 9128 | 6474 | 428 | 428 | 4.69% | 6.61% |  |
| D | 9128 | 6474 | 554 | 554 | 6.07% | 8.56% | 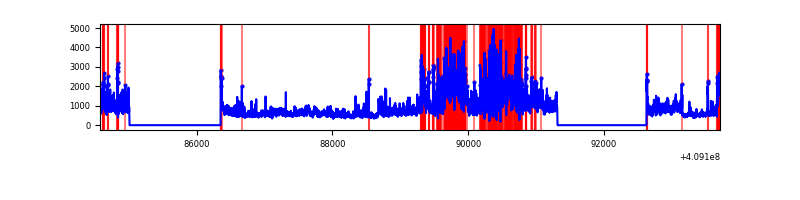 |
Top three noisy pixels from each quadrant. If the there are fewer than three noisy pixels in the level2.evt file, extra rows are filled as -1
| Pixel properties | Quadrant properties | ||||||
|---|---|---|---|---|---|---|---|
| Quadrant | DetID | PixID | Counts | Sigma | Mean | Median | Sigma |
| A | 15 | 222 | 669331 | 4540.87 | 726 | 714 | 147.2 |
| A | 10 | 83 | 468315 | 3175.68 | 726 | 714 | 147.2 |
| A | 9 | 143 | 33739 | 224.29 | 726 | 714 | 147.2 |
| B | 5 | 184 | 424404 | 3013.44 | 722 | 703 | 140.6 |
| B | 0 | 213 | 45873 | 321.26 | 722 | 703 | 140.6 |
| B | 12 | 111 | 17961 | 122.74 | 722 | 703 | 140.6 |
| C | 15 | 208 | 1515437 | 9410.28 | 682 | 687 | 161.0 |
| C | 3 | 233 | 818087 | 5078.04 | 682 | 687 | 161.0 |
| C | 15 | 214 | 266180 | 1649.36 | 682 | 687 | 161.0 |
| D | 12 | 235 | 1917330 | 11736.49 | 670 | 653 | 163.3 |
| D | 2 | 249 | 1013127 | 6199.73 | 670 | 653 | 163.3 |
| D | 12 | 227 | 287170 | 1754.44 | 670 | 653 | 163.3 |
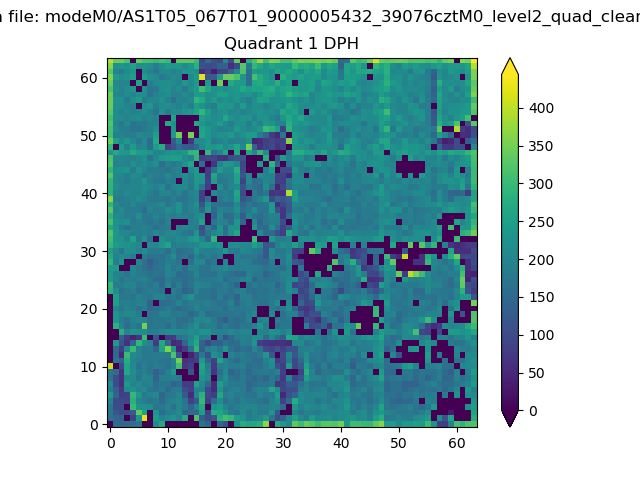
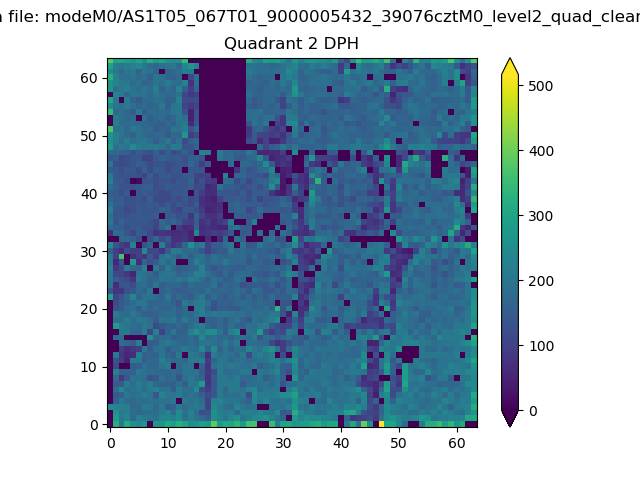
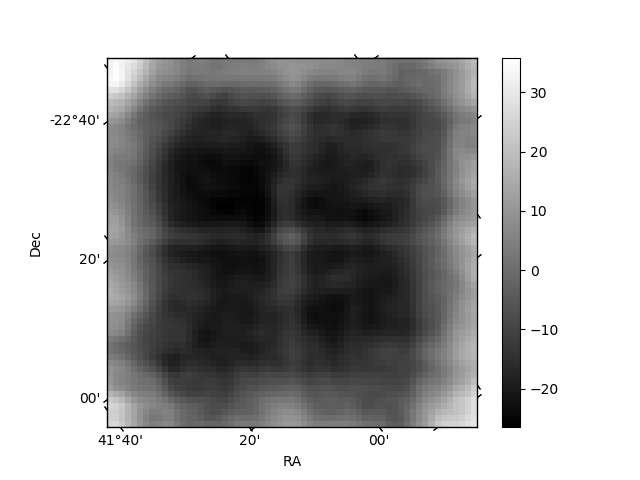
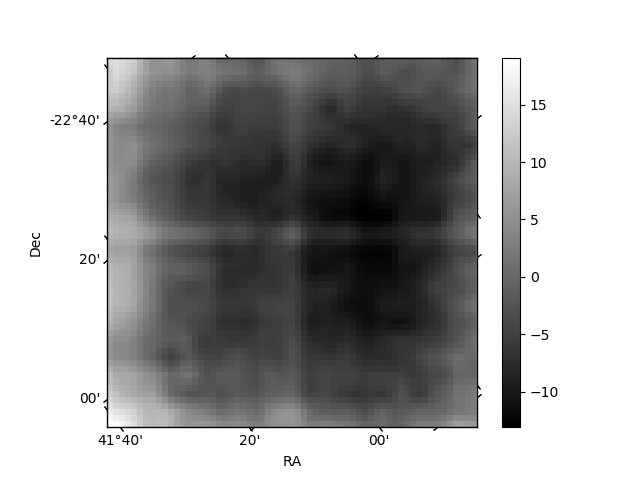
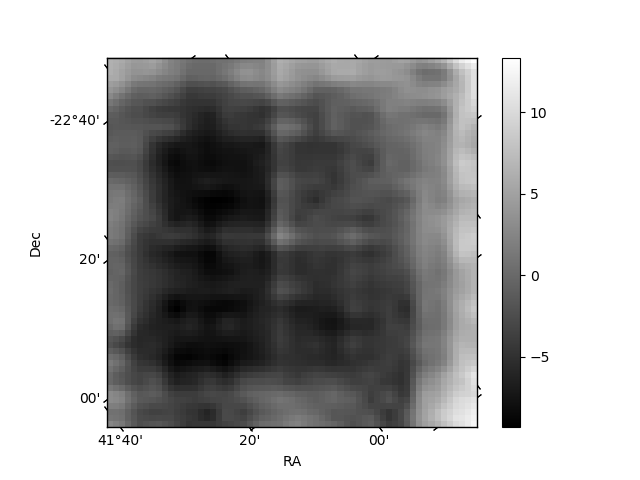
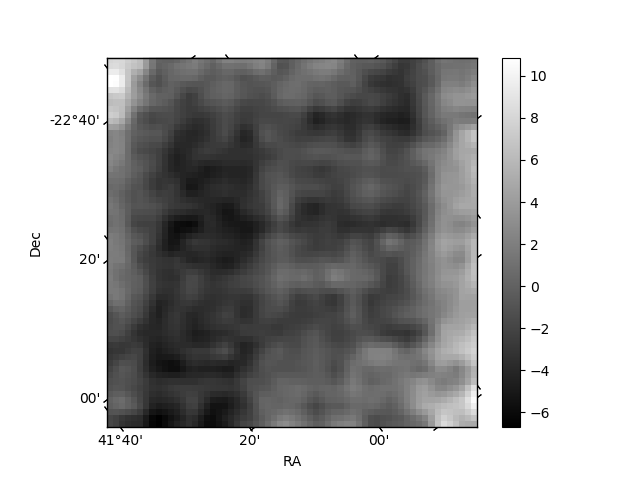
Histogram calculated using DETX and DETY for each event in the final _common_clean file
| Quadrant A | 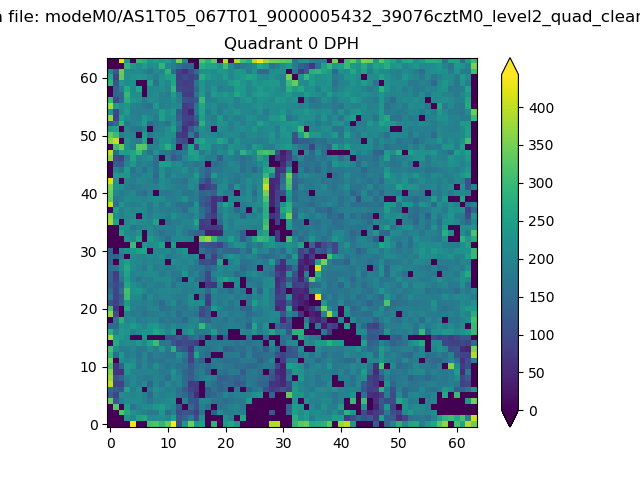 |
 |
Quadrant B |
|---|---|---|---|
| Quadrant D | 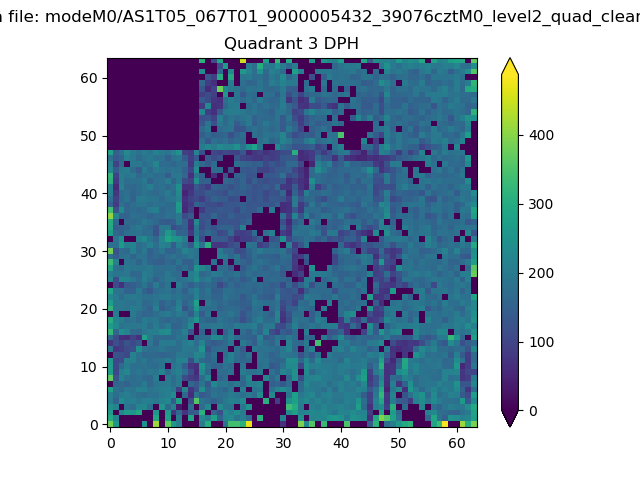 |
 |
Quadrant C |
| Plot type | Count rate plots | Images |
|---|---|---|
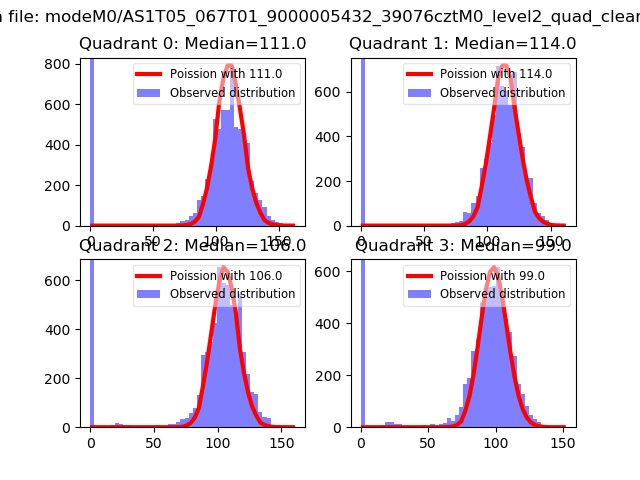
| Comparison with Poisson distribution Blue bars denote a histogram of data divided into 1 sec bins. Red curve is a Poisson curve with rate = median count rate of data. |
 |
 |
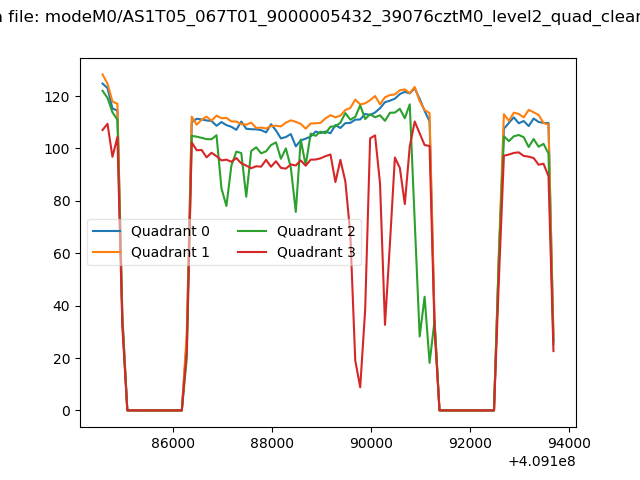
| Quadrant-wise count rates Data is divided into 100 sec bins |
 |
|
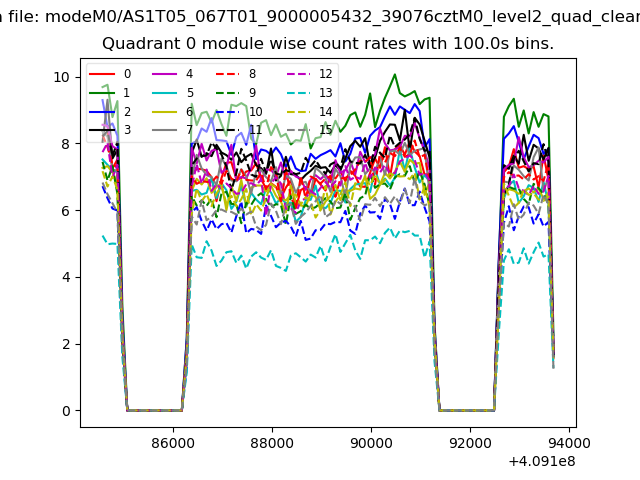
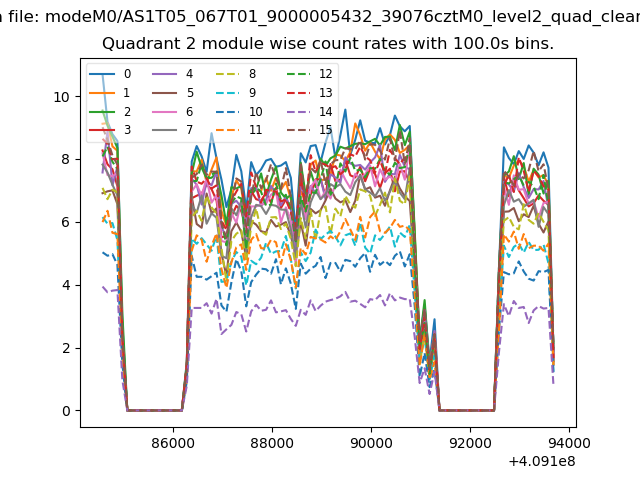
| Module-wise count rates for Quadrant A Data is divided into 100 sec bins |
 |
 |
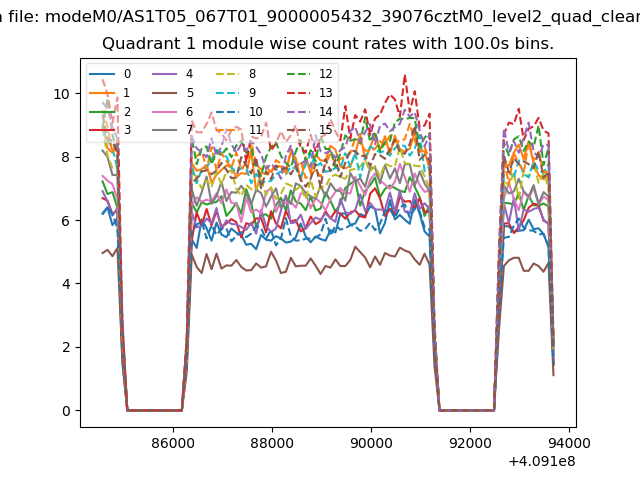
| Module-wise count rates for Quadrant B Data is divided into 100 sec bins |
 |
 |
| Module-wise count rates for Quadrant C Data is divided into 100 sec bins |
 |
 |
| Module-wise count rates for Quadrant D Data is divided into 100 sec bins |
 |
 |
| Parameter | Plot |
|---|---|
| CZT HV Monitor | 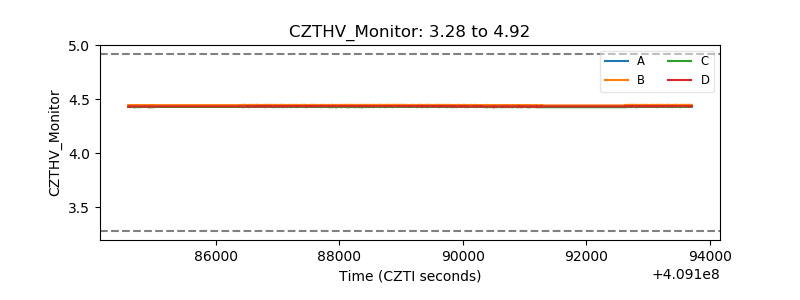 |
| D_VDD | 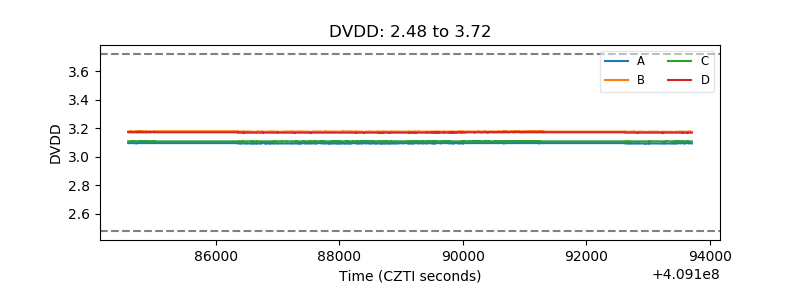 |
| Temperature 1 | 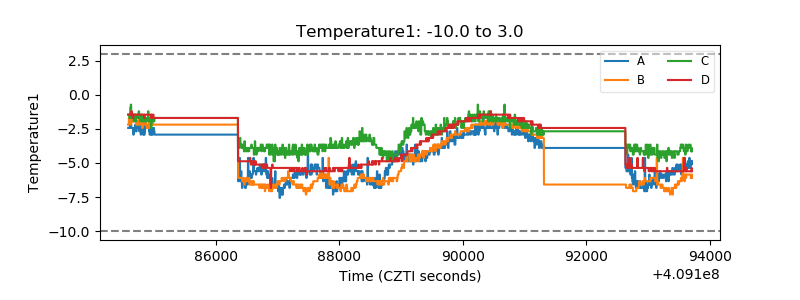 |
| Veto HV Monitor | 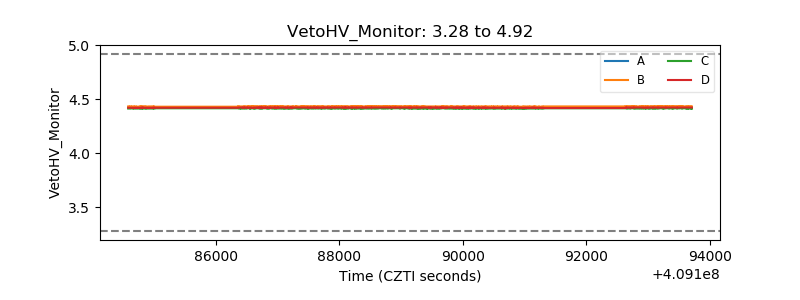 |
| Veto LLD | 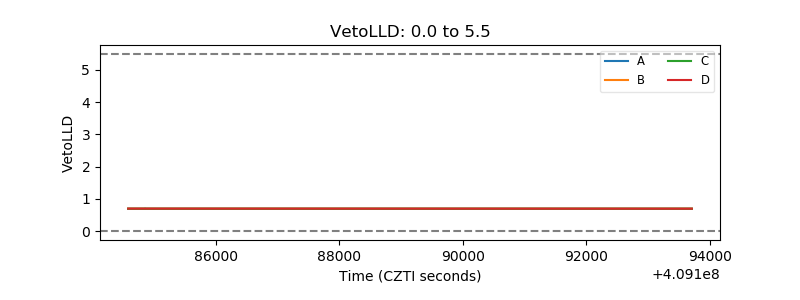 |
| Alpha Counter | 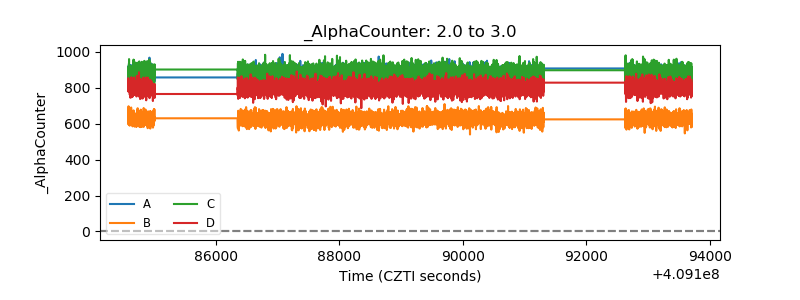 |
| _CPM_Rate | 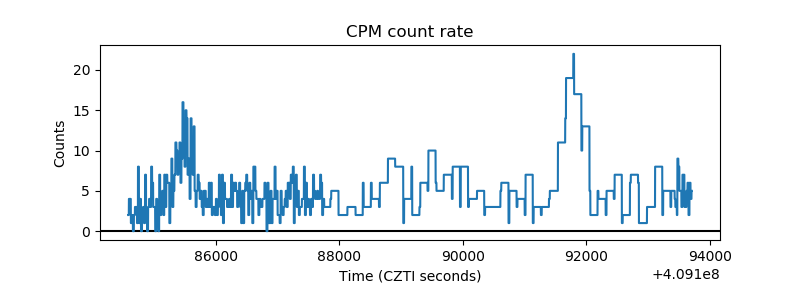 |
| CZT Counter | 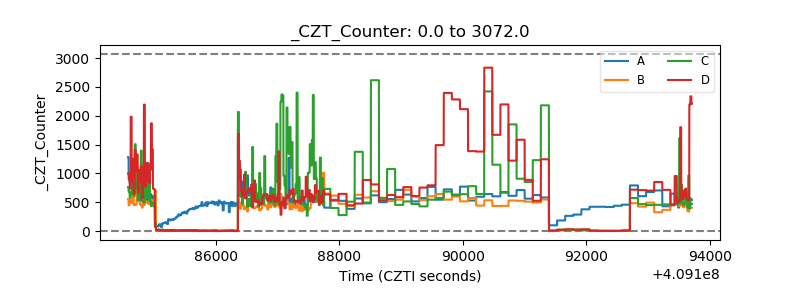 |
| +2.5 Volts monitor | 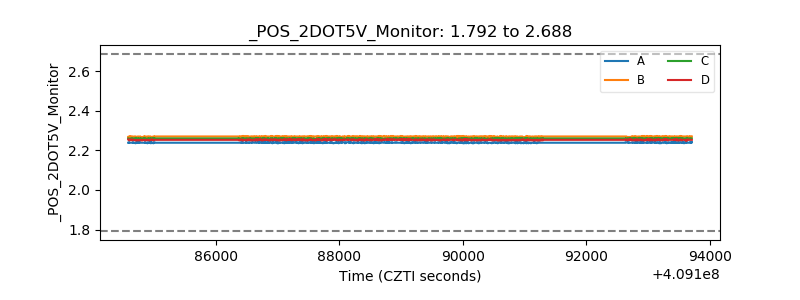 |
| +5 Volts monitor | 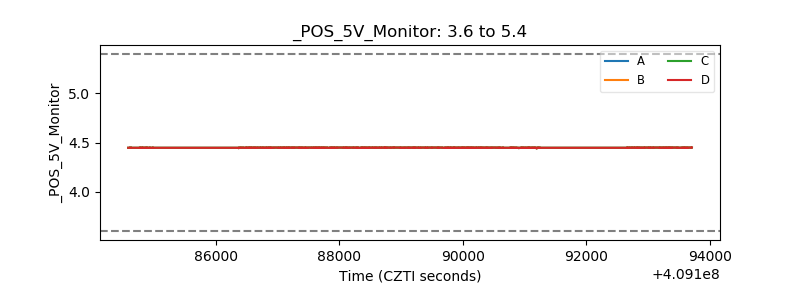 |
| _ROLL_ROT | 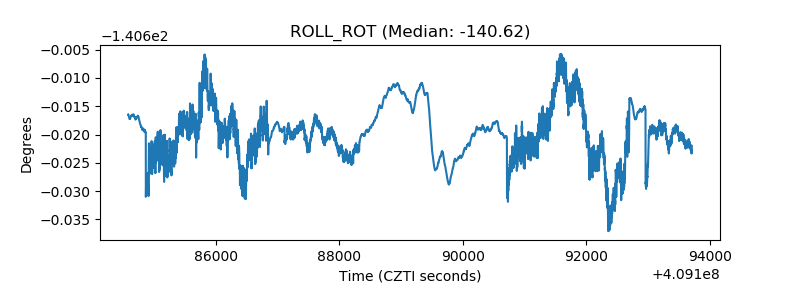 |
| _Roll_DEC | 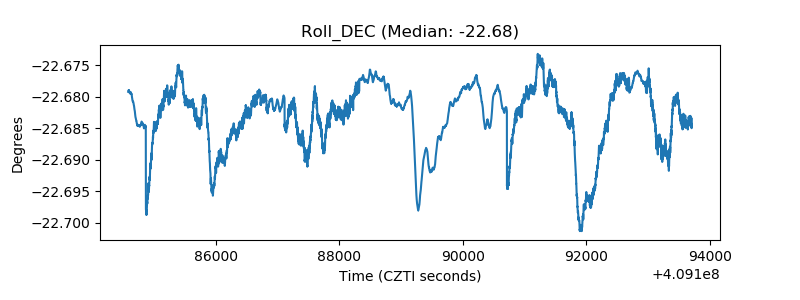 |
| _Roll_RA | 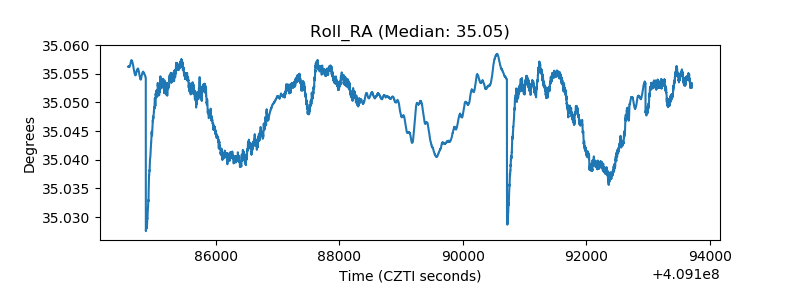 |
| Veto Counter | 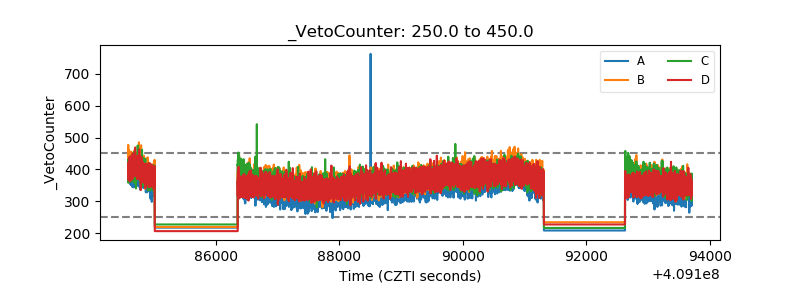 |