| Param | Original file | Final file |
|---|---|---|
| Filename | modeM0/AS1T05_067T01_9000005432_39078cztM0_level2.fits | modeM0/AS1T05_067T01_9000005432_39078cztM0_level2_quad_clean.evt |
| Size (bytes) | 806,855,040 | 184,181,760 |
| Size | 769.5 MB | 175.6 MB |
| Events in quadrant A | 6,412,801 | 1,244,725 |
| Events in quadrant B | 5,294,593 | 1,281,789 |
| Events in quadrant C | 8,313,954 | 1,163,362 |
| Events in quadrant D | 8,969,226 | 1,102,917 |
| Mode M0 | |||
|---|---|---|---|
| Quadrant | BADHDUFLAG | Total packets | Discarded packets |
| A | 0 | 25910 | 4 |
| B | 0 | 23278 | 3 |
| C | 0 | 32066 | 3 |
| D | 0 | 34153 | 3 |
| Mode SS | |||
|---|---|---|---|
| Quadrant | BADHDUFLAG | Total packets | Discarded packets |
| A | 0 | 232 | 0 |
| B | 0 | 232 | 0 |
| C | 0 | 232 | 0 |
| D | 0 | 232 | 0 |
| Mode M9 | |||
|---|---|---|---|
| Quadrant | BADHDUFLAG | Total packets | Discarded packets |
| A | 0 | 42 | 0 |
| B | 0 | 42 | 0 |
| C | 0 | 42 | 0 |
| D | 0 | 42 | 0 |
| Quadrant | Total seconds | Saturated seconds | Saturation percentage |
|---|---|---|---|
| A | 11328 | 74 | 0.653249% |
| B | 11328 | 33 | 0.291314% |
| C | 11328 | 481 | 4.246116% |
| D | 11328 | 379 | 3.345692% |
Noise dominated data is calculated using 1-second bins in cleaned event files. If a bin has >2000 counts, and if more than 50% of those come from <1% of pixels, then it is considered to be noise-dominated and hence unusable.
| Quadrant | # 1 sec bins | Bins with >0 counts | Bins with >2000 counts | High rate bins dominated by noise | Noise dominated (total time) | Noise dominated (detector-on time) | Marked lightcurve |
|---|---|---|---|---|---|---|---|
| A | 15477 | 11331 | 47 | 47 | 0.30% | 0.41% | 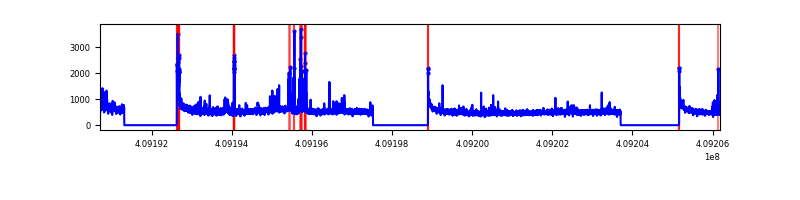 |
| B | 15477 | 11331 | 12 | 12 | 0.08% | 0.11% | 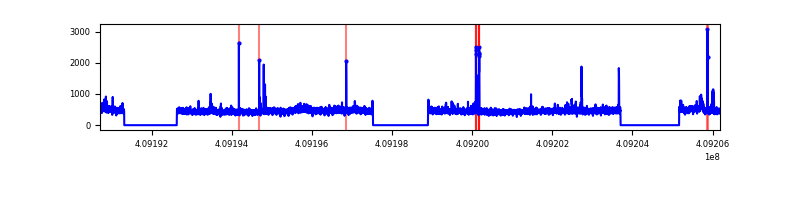 |
| C | 15477 | 11331 | 404 | 404 | 2.61% | 3.57% | 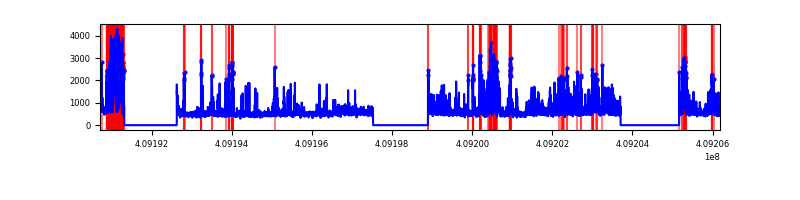 |
| D | 15477 | 11331 | 395 | 395 | 2.55% | 3.49% | 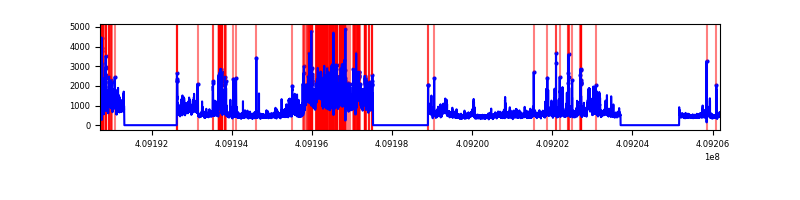 |
Top three noisy pixels from each quadrant. If the there are fewer than three noisy pixels in the level2.evt file, extra rows are filled as -1
| Pixel properties | Quadrant properties | ||||||
|---|---|---|---|---|---|---|---|
| Quadrant | DetID | PixID | Counts | Sigma | Mean | Median | Sigma |
| A | 10 | 83 | 774251 | 3009.94 | 1270 | 1244 | 256.8 |
| A | 15 | 222 | 602660 | 2341.8 | 1270 | 1244 | 256.8 |
| A | 13 | 248 | 69610 | 266.2 | 1270 | 1244 | 256.8 |
| B | 5 | 184 | 169512 | 686.59 | 1266 | 1232 | 245.1 |
| B | 5 | 172 | 48454 | 192.67 | 1266 | 1232 | 245.1 |
| B | 0 | 213 | 46672 | 185.4 | 1266 | 1232 | 245.1 |
| C | 15 | 208 | 2891645 | 10185.88 | 1215 | 1220 | 283.8 |
| C | 15 | 214 | 467716 | 1643.94 | 1215 | 1220 | 283.8 |
| C | 3 | 233 | 190980 | 668.72 | 1215 | 1220 | 283.8 |
| D | 12 | 235 | 3184312 | 10719.04 | 1223 | 1189 | 297.0 |
| D | 12 | 227 | 380728 | 1278.08 | 1223 | 1189 | 297.0 |
| D | 13 | 249 | 285101 | 956.06 | 1223 | 1189 | 297.0 |
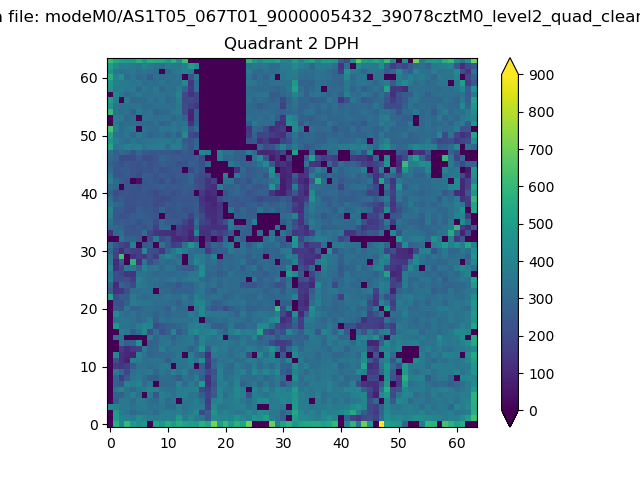
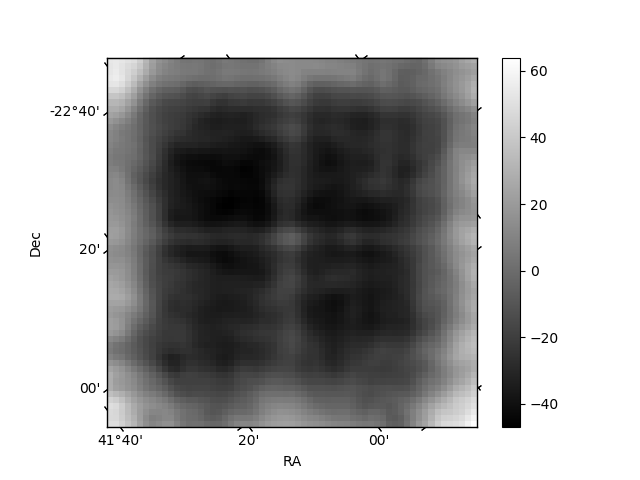
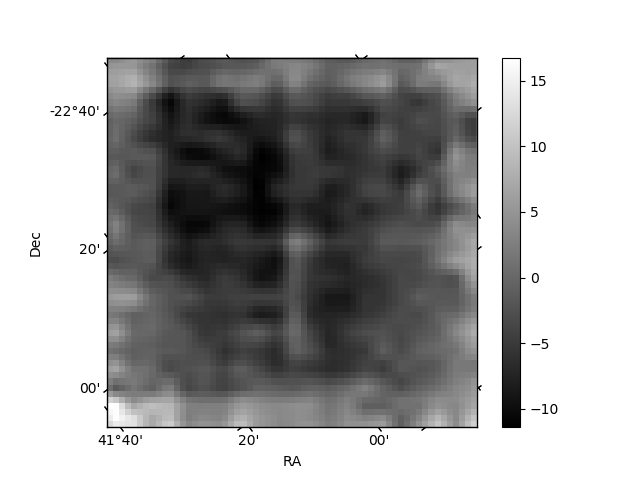
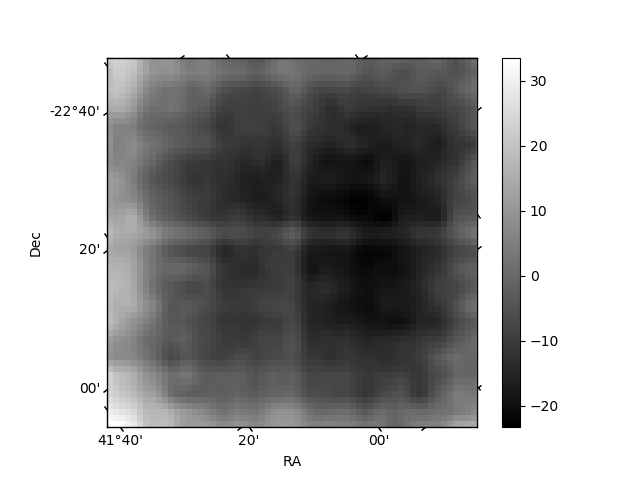
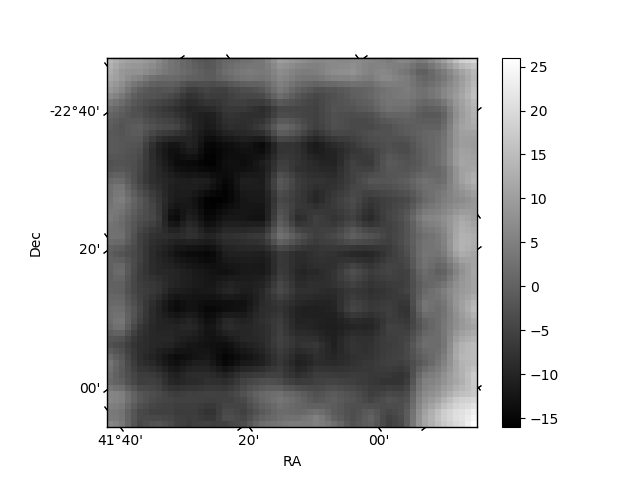
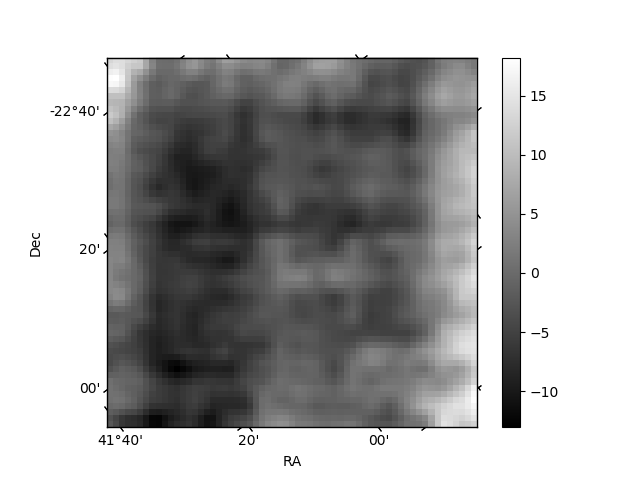
Histogram calculated using DETX and DETY for each event in the final _common_clean file
| Quadrant A | 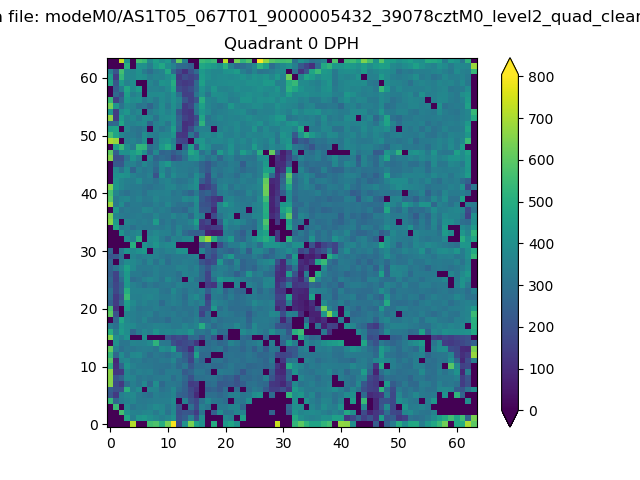 |
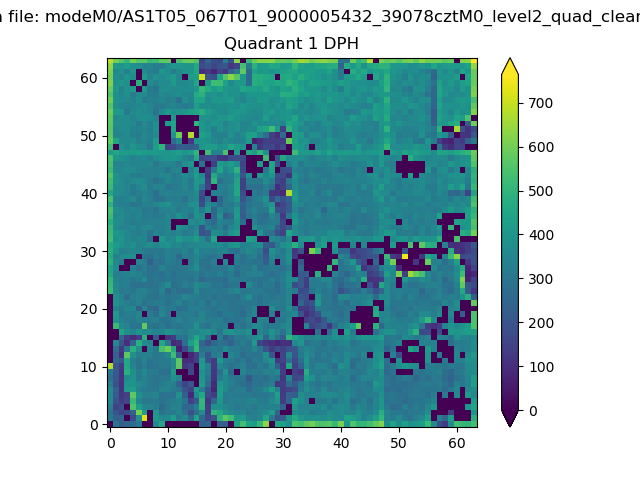 |
Quadrant B |
|---|---|---|---|
| Quadrant D | 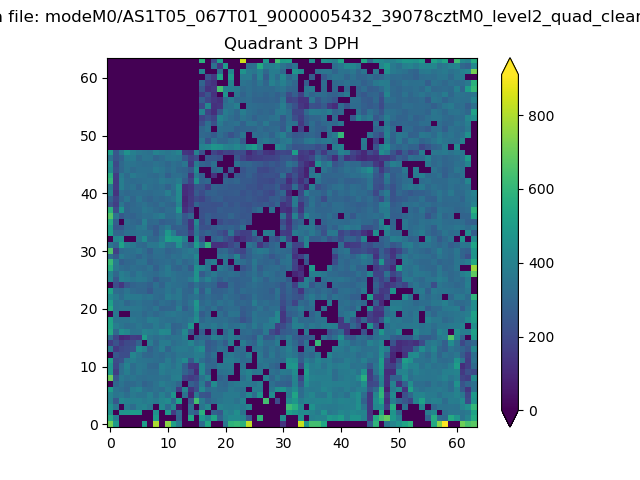 |
 |
Quadrant C |
| Plot type | Count rate plots | Images |
|---|---|---|
| Comparison with Poisson distribution Blue bars denote a histogram of data divided into 1 sec bins. Red curve is a Poisson curve with rate = median count rate of data. |
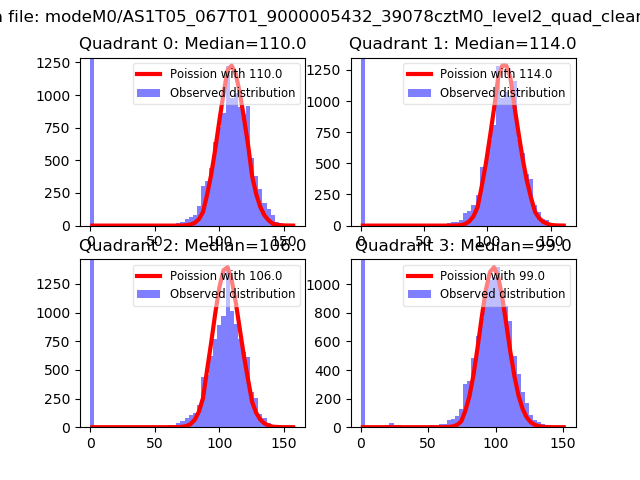 |
 |
| Quadrant-wise count rates Data is divided into 100 sec bins |
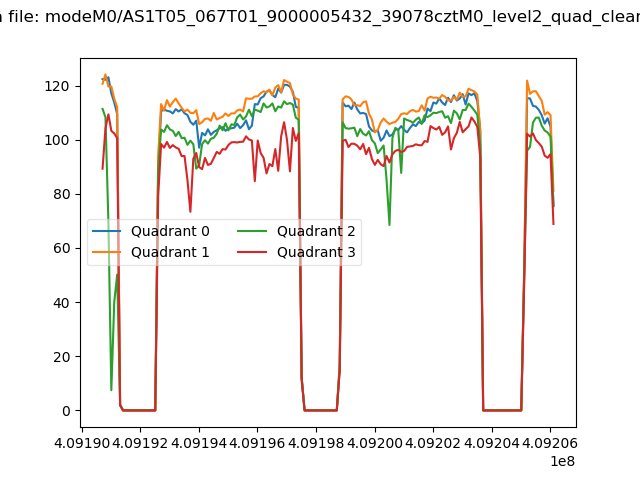 |
|
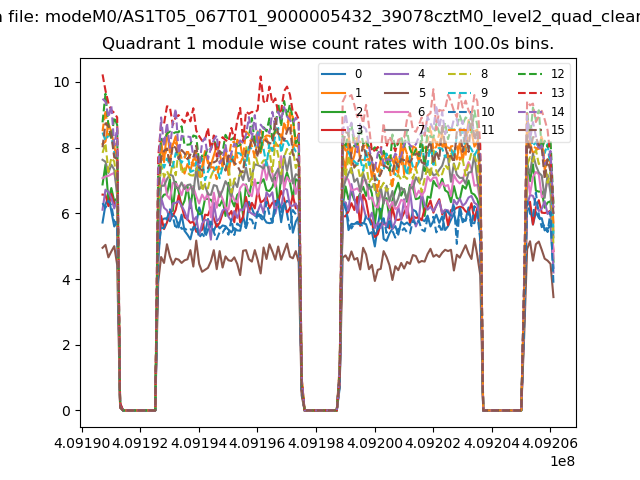
| Module-wise count rates for Quadrant A Data is divided into 100 sec bins |
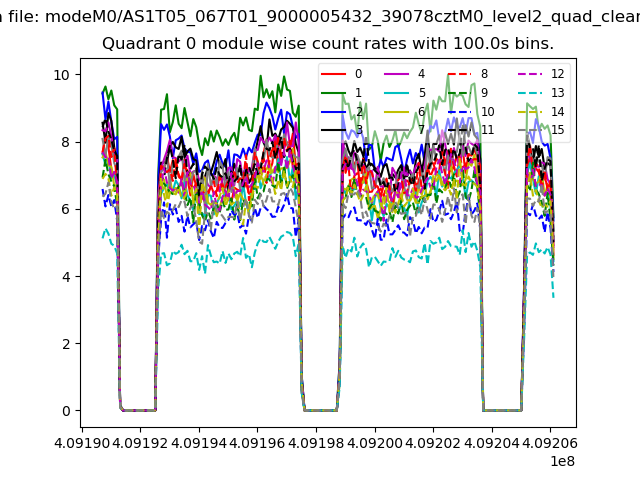 |
 |
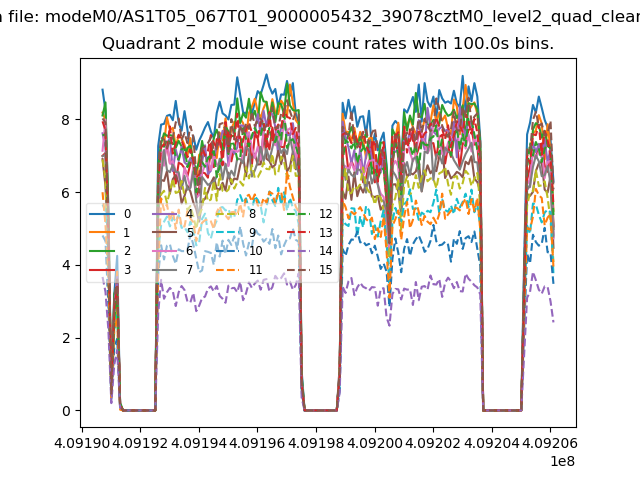
| Module-wise count rates for Quadrant B Data is divided into 100 sec bins |
 |
 |
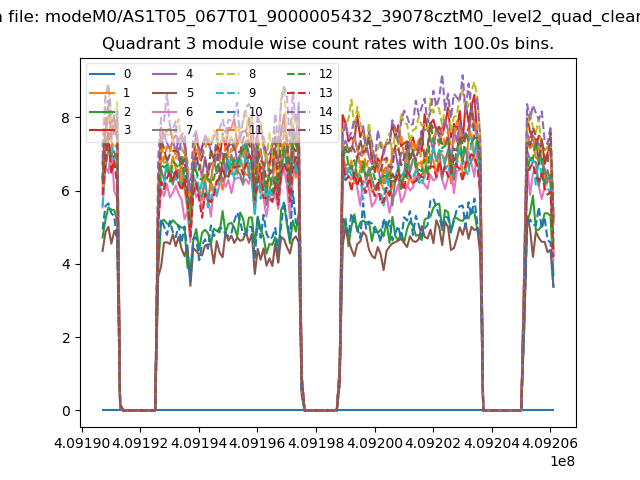
| Module-wise count rates for Quadrant C Data is divided into 100 sec bins |
 |
 |
| Module-wise count rates for Quadrant D Data is divided into 100 sec bins |
 |
 |
| Parameter | Plot |
|---|---|
| CZT HV Monitor | 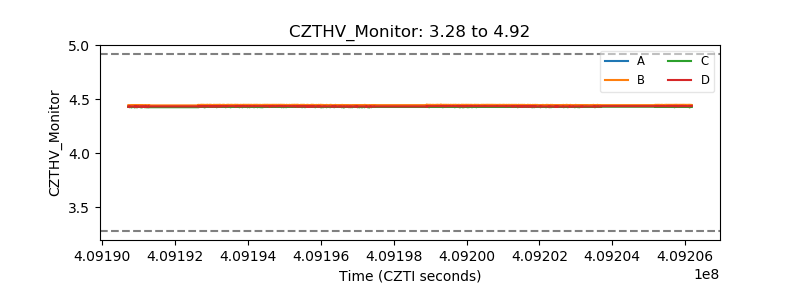 |
| D_VDD | 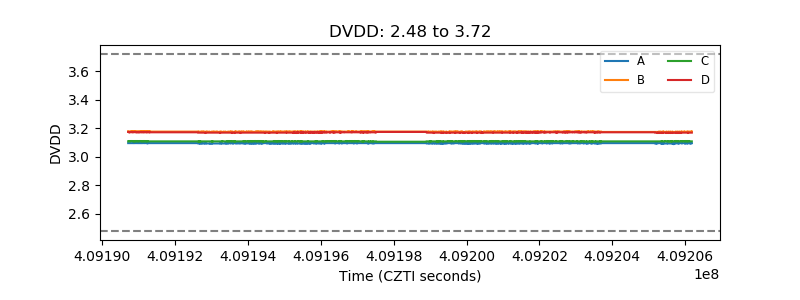 |
| Temperature 1 | 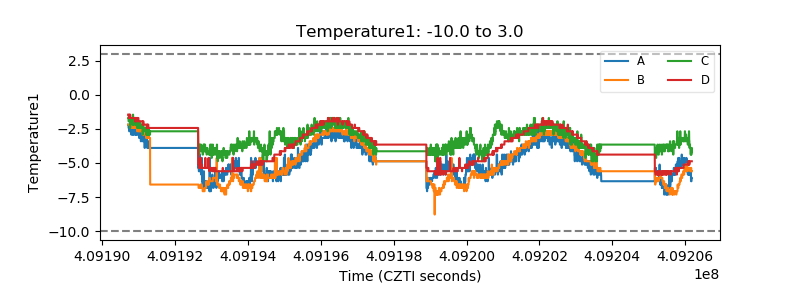 |
| Veto HV Monitor | 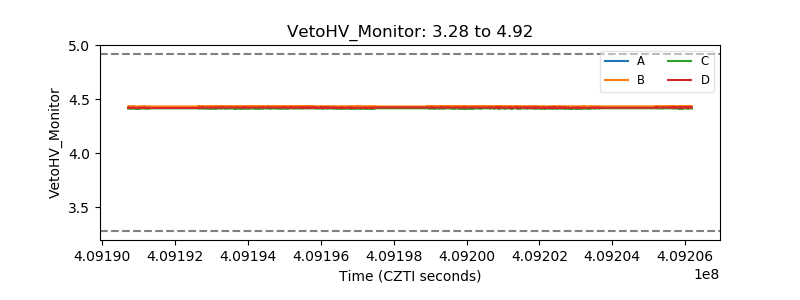 |
| Veto LLD | 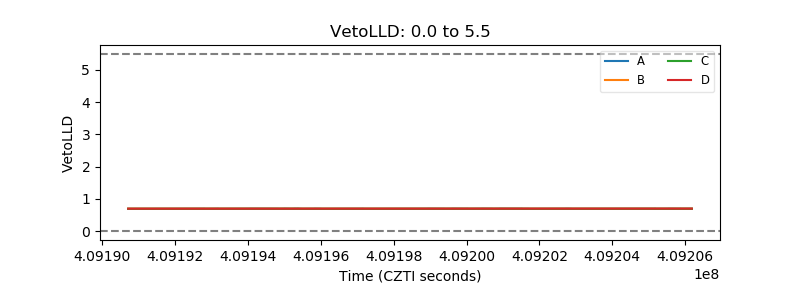 |
| Alpha Counter | 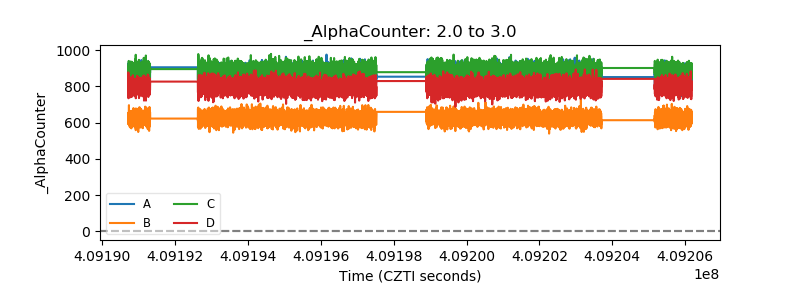 |
| _CPM_Rate | 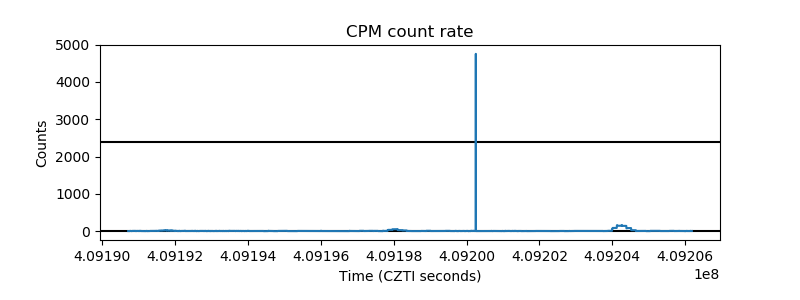 |
| CZT Counter | 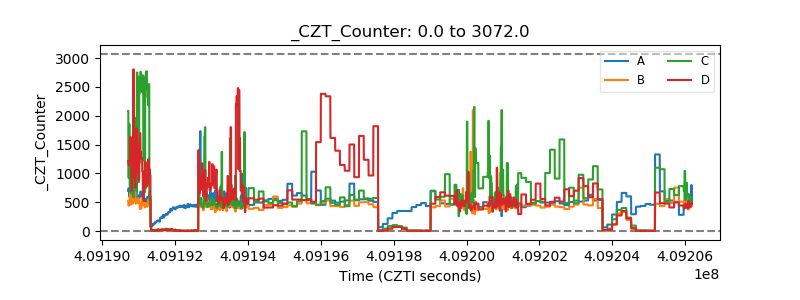 |
| +2.5 Volts monitor | 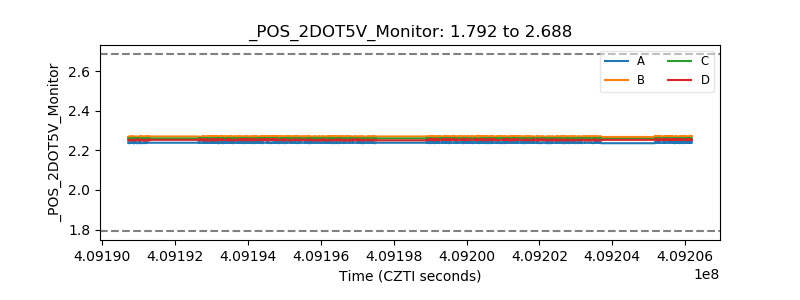 |
| +5 Volts monitor | 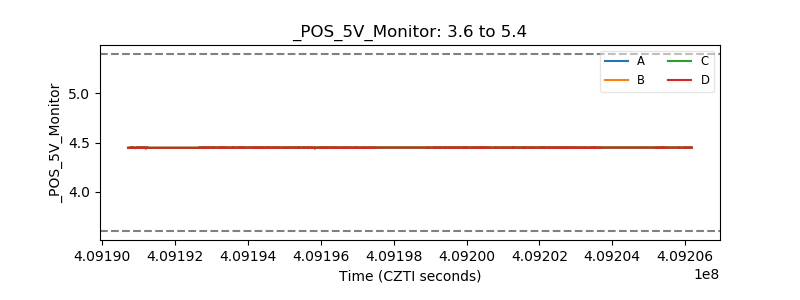 |
| _ROLL_ROT | 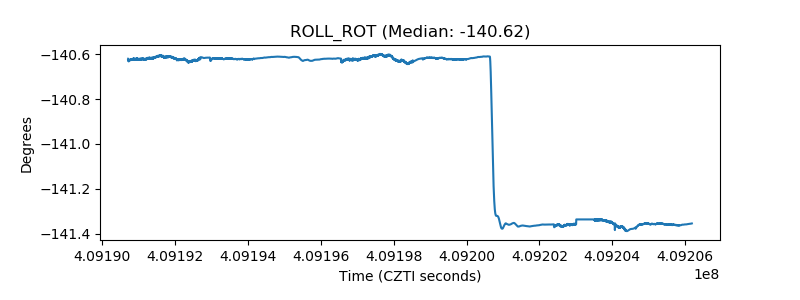 |
| _Roll_DEC | 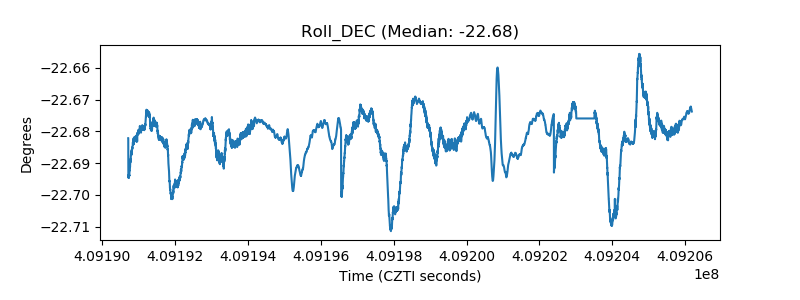 |
| _Roll_RA | 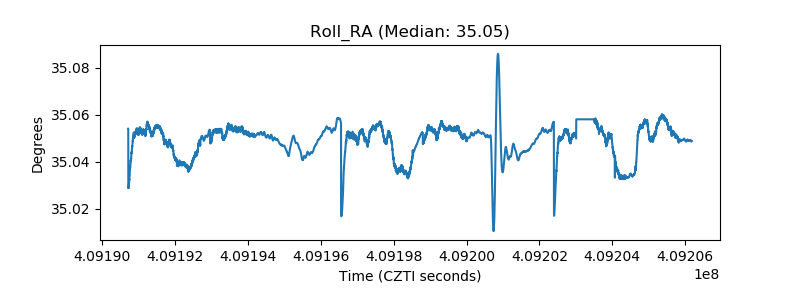 |
| Veto Counter | 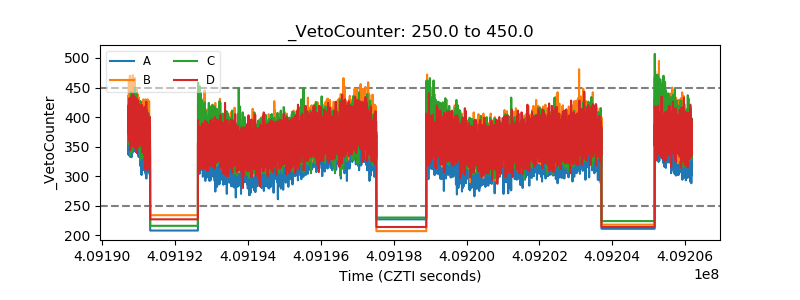 |