| Param | Original file | Final file |
|---|---|---|
| Filename | modeM0/AS1T05_067T01_9000005432_39079cztM0_level2.fits | modeM0/AS1T05_067T01_9000005432_39079cztM0_level2_quad_clean.evt |
| Size (bytes) | 406,693,440 | 89,064,000 |
| Size | 387.9 MB | 84.9 MB |
| Events in quadrant A | 2,875,312 | 610,525 |
| Events in quadrant B | 2,662,233 | 632,032 |
| Events in quadrant C | 5,772,696 | 516,682 |
| Events in quadrant D | 3,314,396 | 550,998 |
| Mode M0 | |||
|---|---|---|---|
| Quadrant | BADHDUFLAG | Total packets | Discarded packets |
| A | 0 | 11887 | 3 |
| B | 0 | 11525 | 2 |
| C | 0 | 20751 | 2 |
| D | 0 | 13405 | 2 |
| Mode SS | |||
|---|---|---|---|
| Quadrant | BADHDUFLAG | Total packets | Discarded packets |
| A | 0 | 112 | 0 |
| B | 0 | 112 | 0 |
| C | 0 | 112 | 0 |
| D | 0 | 112 | 0 |
| Mode M9 | |||
|---|---|---|---|
| Quadrant | BADHDUFLAG | Total packets | Discarded packets |
| A | 0 | 27 | 0 |
| B | 0 | 27 | 0 |
| C | 0 | 27 | 0 |
| D | 0 | 28 | 0 |
| Quadrant | Total seconds | Saturated seconds | Saturation percentage |
|---|---|---|---|
| A | 5524 | 15 | 0.271542% |
| B | 5524 | 10 | 0.181028% |
| C | 5524 | 917 | 16.600290% |
| D | 5524 | 39 | 0.706010% |
Noise dominated data is calculated using 1-second bins in cleaned event files. If a bin has >2000 counts, and if more than 50% of those come from <1% of pixels, then it is considered to be noise-dominated and hence unusable.
| Quadrant | # 1 sec bins | Bins with >0 counts | Bins with >2000 counts | High rate bins dominated by noise | Noise dominated (total time) | Noise dominated (detector-on time) | Marked lightcurve |
|---|---|---|---|---|---|---|---|
| A | 7108 | 5525 | 8 | 8 | 0.11% | 0.14% | 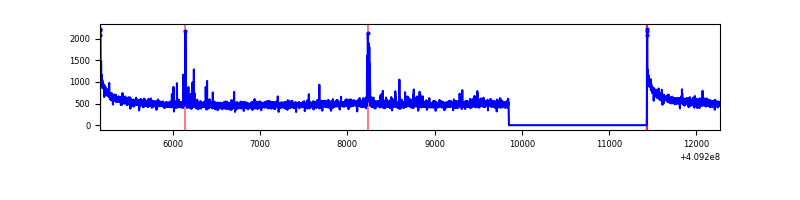 |
| B | 7108 | 5525 | 2 | 2 | 0.03% | 0.04% | 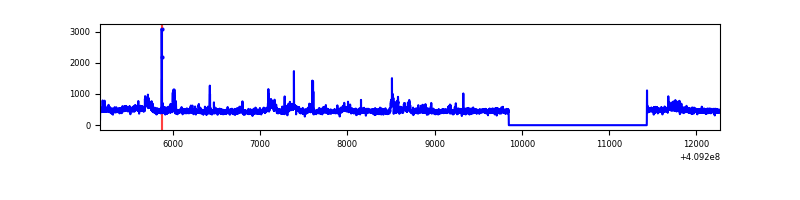 |
| C | 7108 | 5525 | 818 | 818 | 11.51% | 14.81% | 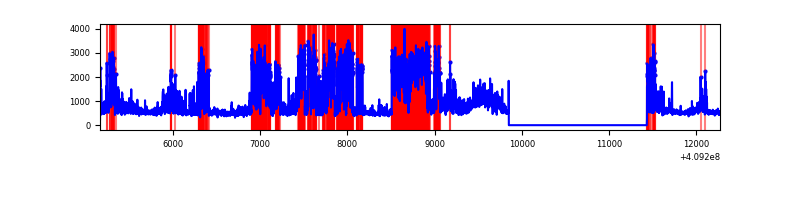 |
| D | 7108 | 5525 | 31 | 31 | 0.44% | 0.56% | 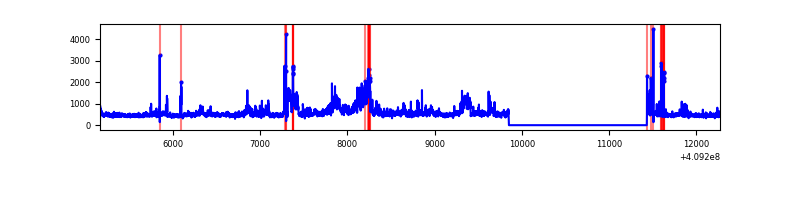 |
Top three noisy pixels from each quadrant. If the there are fewer than three noisy pixels in the level2.evt file, extra rows are filled as -1
| Pixel properties | Quadrant properties | ||||||
|---|---|---|---|---|---|---|---|
| Quadrant | DetID | PixID | Counts | Sigma | Mean | Median | Sigma |
| A | 10 | 83 | 415287 | 3329.4 | 617 | 604 | 124.6 |
| A | 13 | 248 | 40175 | 317.71 | 617 | 604 | 124.6 |
| A | 7 | 3 | 15483 | 119.46 | 617 | 604 | 124.6 |
| B | 5 | 184 | 163572 | 1368.74 | 615 | 598 | 119.1 |
| B | 5 | 172 | 33216 | 273.94 | 615 | 598 | 119.1 |
| B | 0 | 190 | 32147 | 264.97 | 615 | 598 | 119.1 |
| C | 15 | 208 | 3091299 | 23132.02 | 575 | 578 | 133.6 |
| C | 15 | 214 | 225947 | 1686.74 | 575 | 578 | 133.6 |
| C | 3 | 233 | 177912 | 1327.23 | 575 | 578 | 133.6 |
| D | 12 | 235 | 830026 | 5662.07 | 601 | 583 | 146.5 |
| D | 13 | 249 | 96411 | 654.16 | 601 | 583 | 146.5 |
| D | 12 | 233 | 35656 | 239.42 | 601 | 583 | 146.5 |
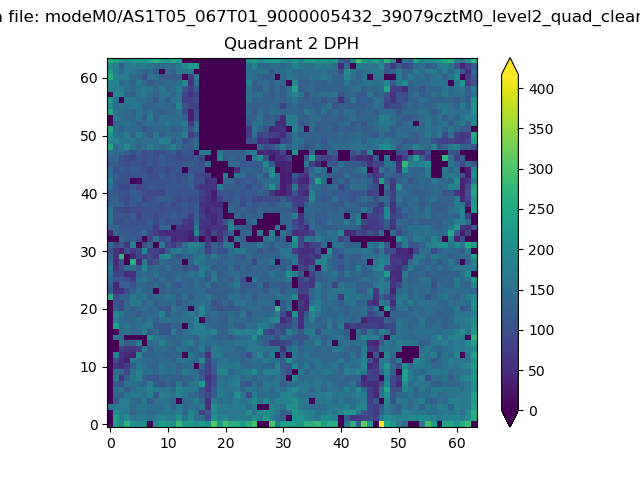
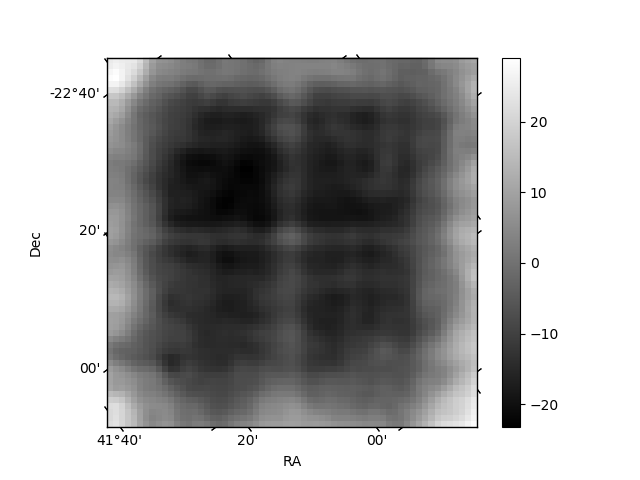
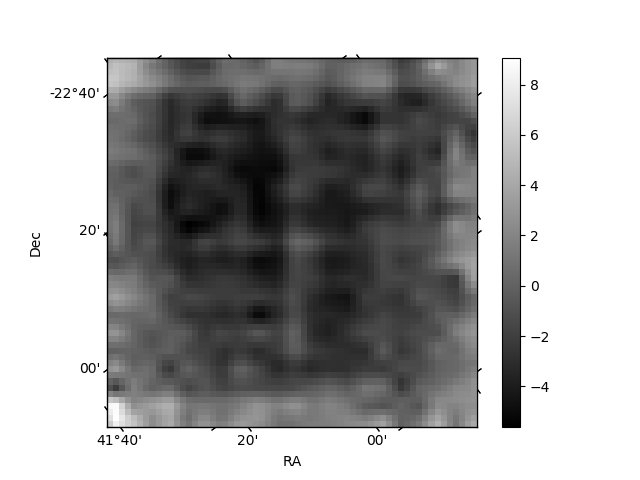
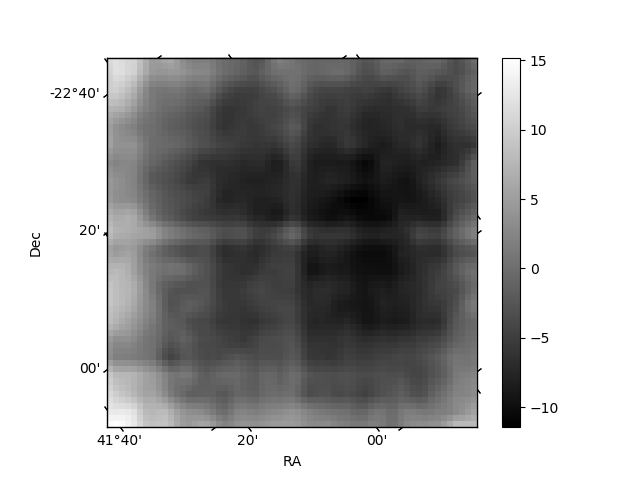
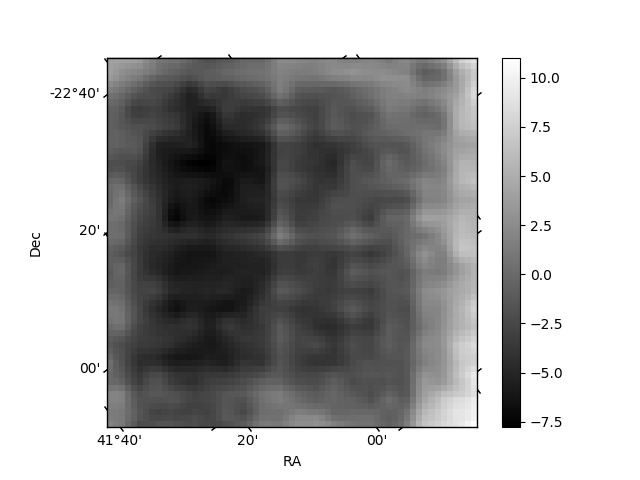
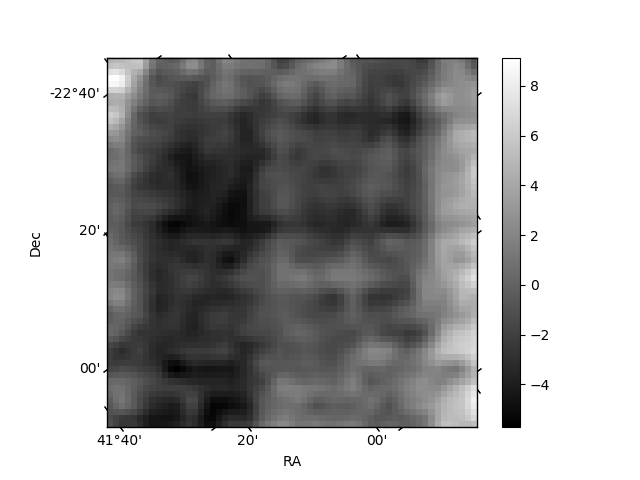
Histogram calculated using DETX and DETY for each event in the final _common_clean file
| Quadrant A | 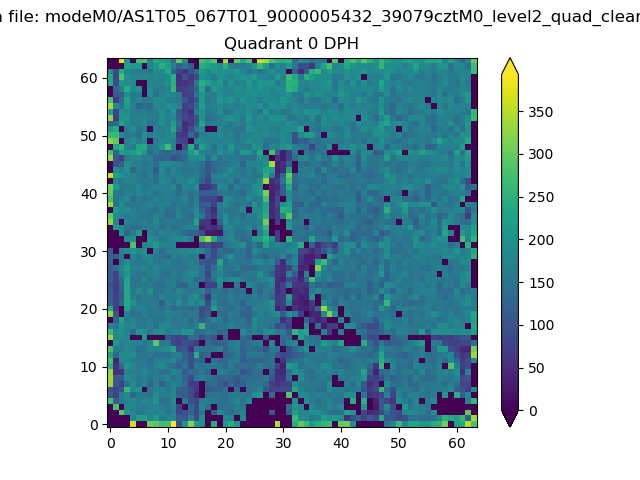 |
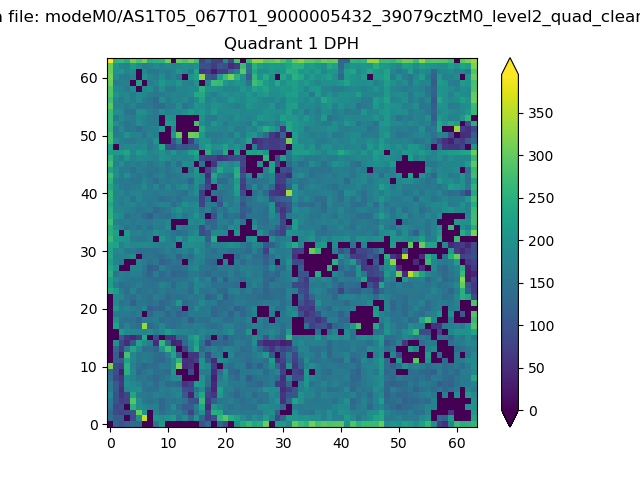 |
Quadrant B |
|---|---|---|---|
| Quadrant D | 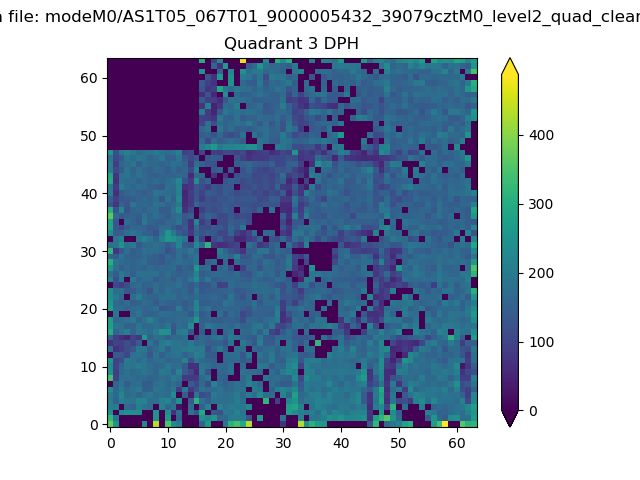 |
 |
Quadrant C |
| Plot type | Count rate plots | Images |
|---|---|---|
| Comparison with Poisson distribution Blue bars denote a histogram of data divided into 1 sec bins. Red curve is a Poisson curve with rate = median count rate of data. |
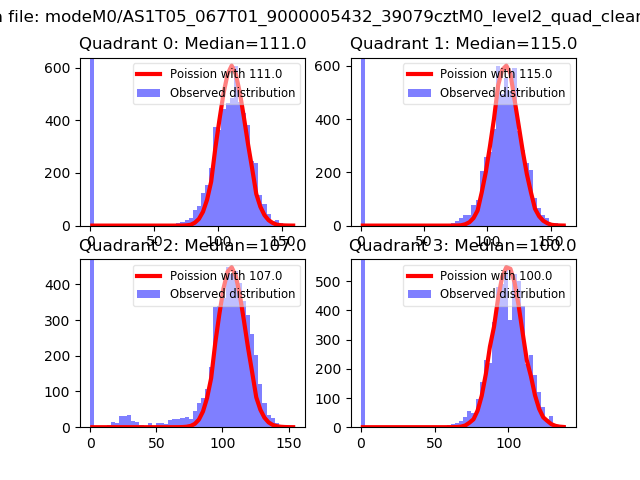 |
 |
| Quadrant-wise count rates Data is divided into 100 sec bins |
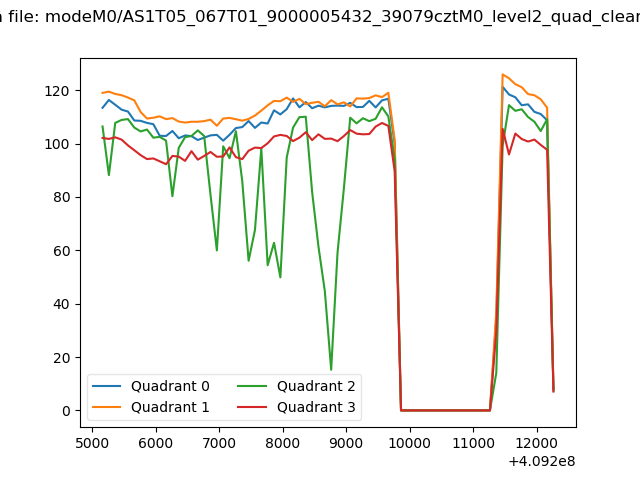 |
|
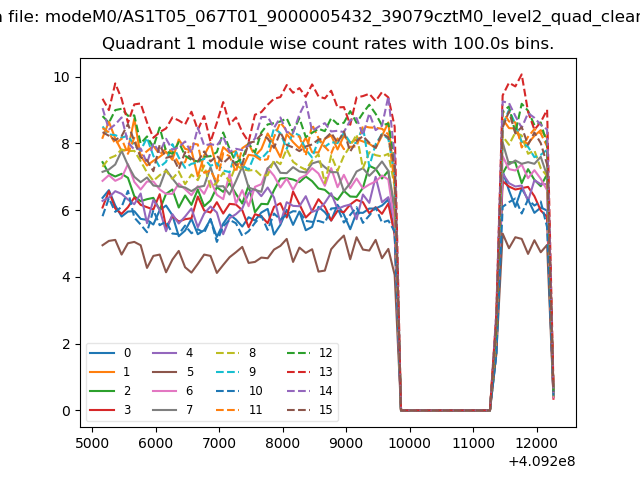
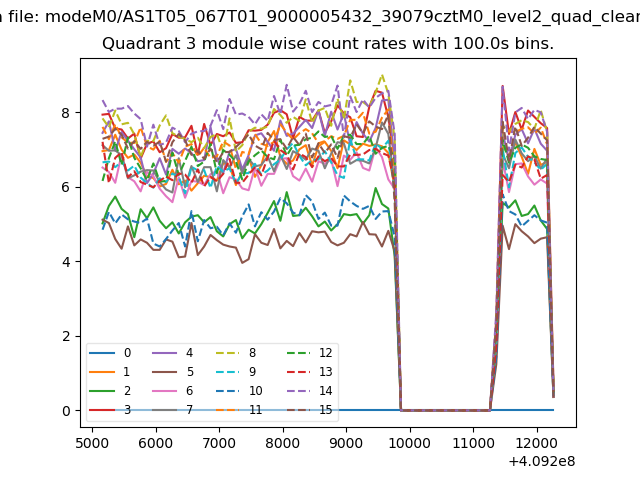
| Module-wise count rates for Quadrant A Data is divided into 100 sec bins |
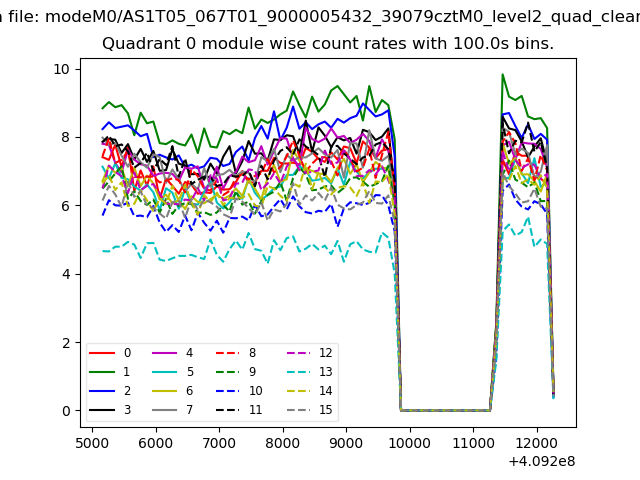 |
 |
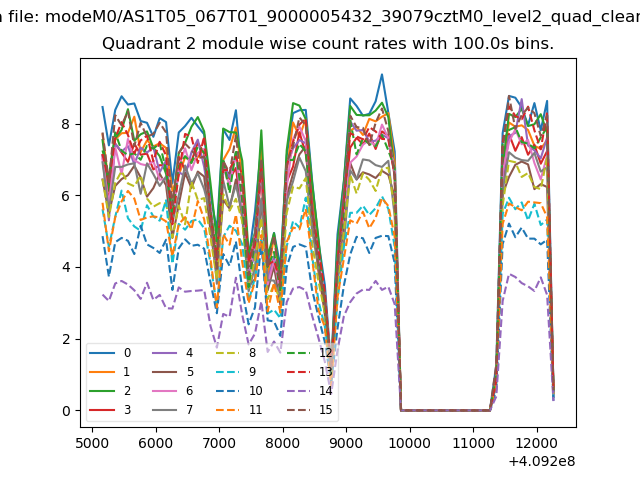
| Module-wise count rates for Quadrant B Data is divided into 100 sec bins |
 |
 |
| Module-wise count rates for Quadrant C Data is divided into 100 sec bins |
 |
 |
| Module-wise count rates for Quadrant D Data is divided into 100 sec bins |
 |
 |
| Parameter | Plot |
|---|---|
| CZT HV Monitor | 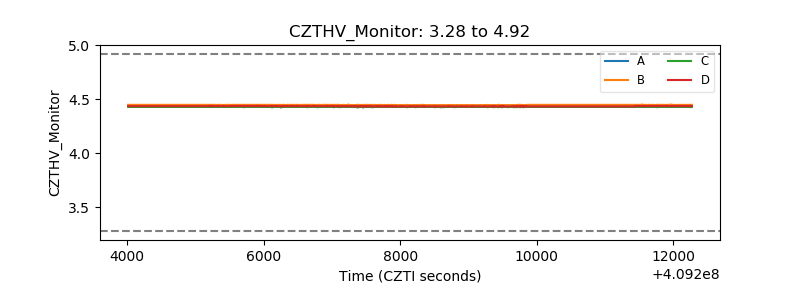 |
| D_VDD | 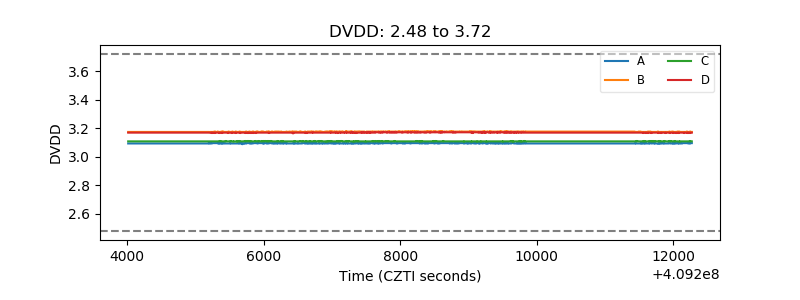 |
| Temperature 1 | 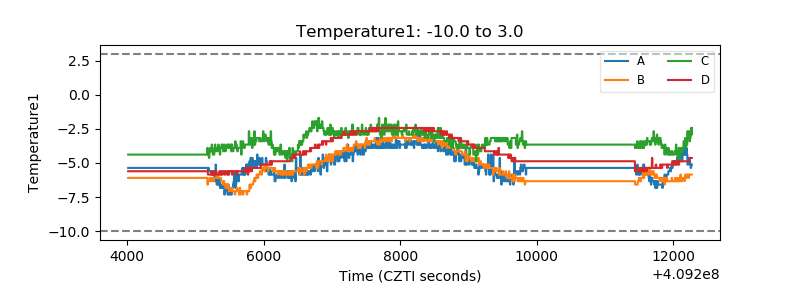 |
| Veto HV Monitor | 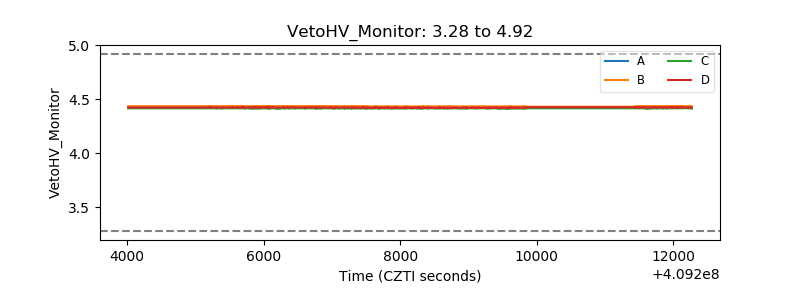 |
| Veto LLD | 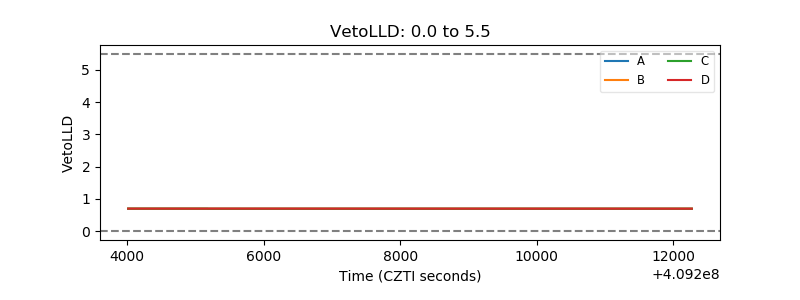 |
| Alpha Counter | 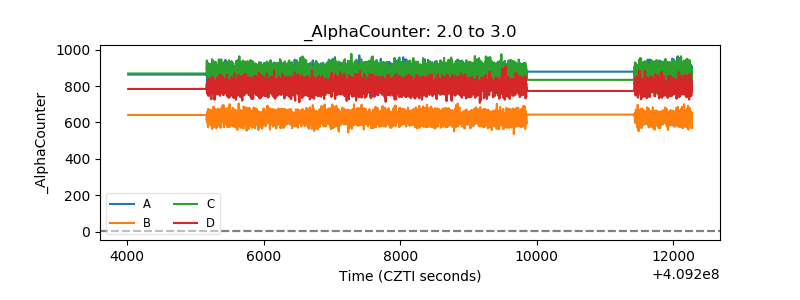 |
| _CPM_Rate | 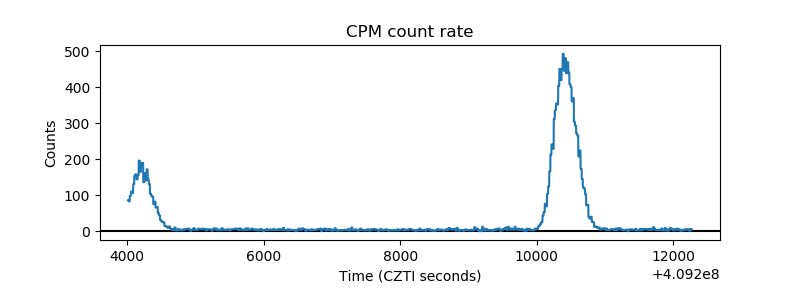 |
| CZT Counter | 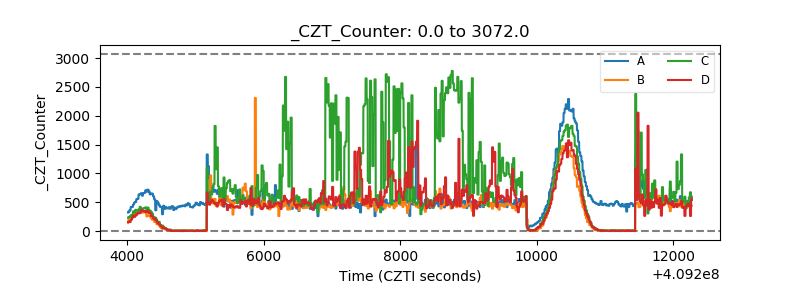 |
| +2.5 Volts monitor | 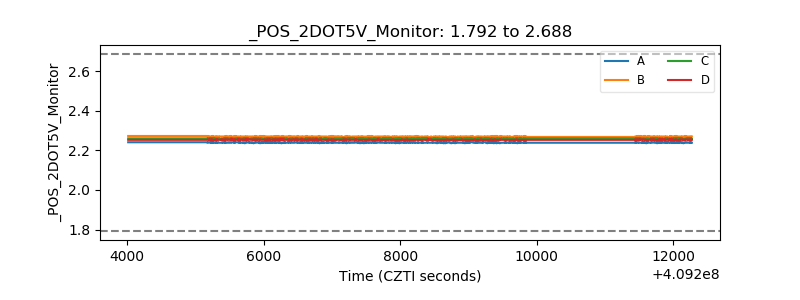 |
| +5 Volts monitor | 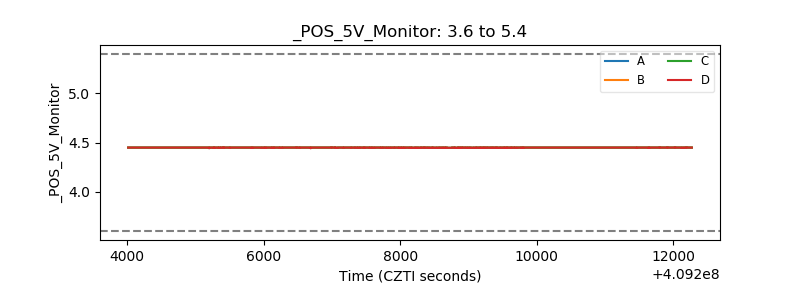 |
| _ROLL_ROT | 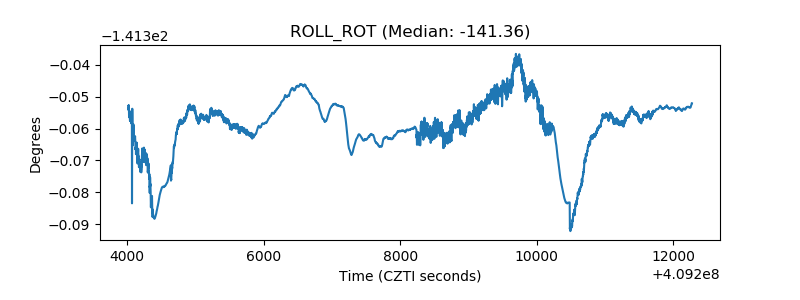 |
| _Roll_DEC | 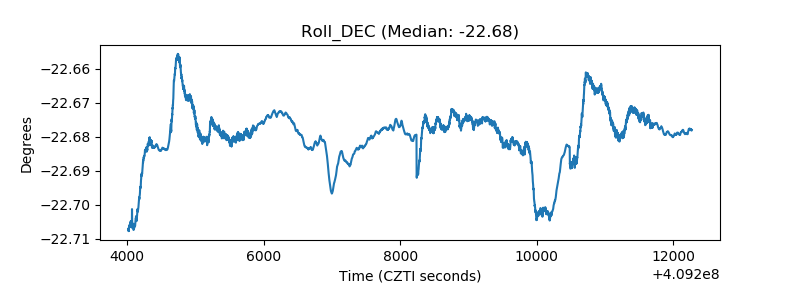 |
| _Roll_RA | 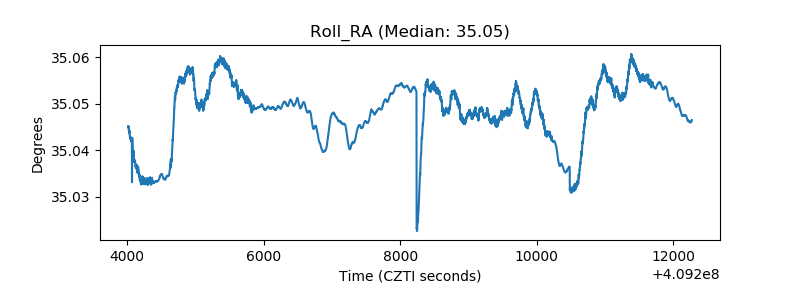 |
| Veto Counter | 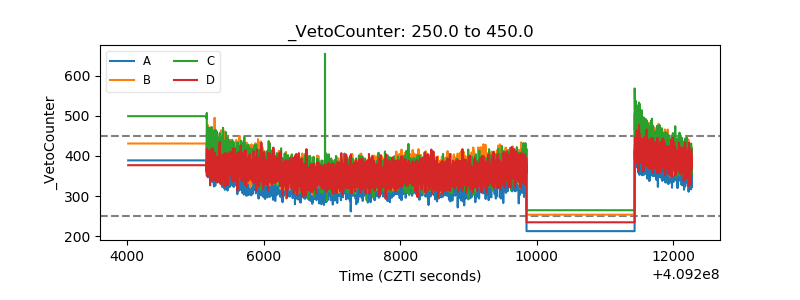 |