| Param | Original file | Final file |
|---|---|---|
| Filename | modeM0/AS1T05_067T01_9000005432_39080cztM0_level2.fits | modeM0/AS1T05_067T01_9000005432_39080cztM0_level2_quad_clean.evt |
| Size (bytes) | 391,377,600 | 92,632,320 |
| Size | 373.2 MB | 88.3 MB |
| Events in quadrant A | 2,883,373 | 623,924 |
| Events in quadrant B | 2,515,655 | 645,747 |
| Events in quadrant C | 5,262,085 | 590,035 |
| Events in quadrant D | 3,400,361 | 561,937 |
| Mode M0 | |||
|---|---|---|---|
| Quadrant | BADHDUFLAG | Total packets | Discarded packets |
| A | 0 | 11907 | 3 |
| B | 0 | 11115 | 2 |
| C | 0 | 19285 | 2 |
| D | 0 | 13696 | 2 |
| Mode SS | |||
|---|---|---|---|
| Quadrant | BADHDUFLAG | Total packets | Discarded packets |
| A | 0 | 110 | 0 |
| B | 0 | 110 | 0 |
| C | 0 | 110 | 0 |
| D | 0 | 110 | 0 |
| Mode M9 | |||
|---|---|---|---|
| Quadrant | BADHDUFLAG | Total packets | Discarded packets |
| A | 0 | 24 | 0 |
| B | 0 | 24 | 0 |
| C | 0 | 24 | 0 |
| D | 0 | 25 | 0 |
| Quadrant | Total seconds | Saturated seconds | Saturation percentage |
|---|---|---|---|
| A | 5480 | 14 | 0.255474% |
| B | 5480 | 8 | 0.145985% |
| C | 5480 | 368 | 6.715328% |
| D | 5480 | 89 | 1.624088% |
Noise dominated data is calculated using 1-second bins in cleaned event files. If a bin has >2000 counts, and if more than 50% of those come from <1% of pixels, then it is considered to be noise-dominated and hence unusable.
| Quadrant | # 1 sec bins | Bins with >0 counts | Bins with >2000 counts | High rate bins dominated by noise | Noise dominated (total time) | Noise dominated (detector-on time) | Marked lightcurve |
|---|---|---|---|---|---|---|---|
| A | 7152 | 5481 | 5 | 5 | 0.07% | 0.09% | 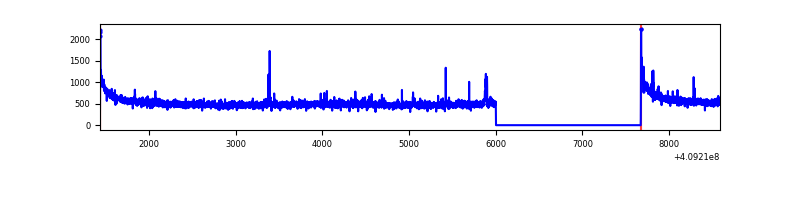 |
| B | 7152 | 5481 | 0 | 0 | 0.00% | 0.00% |  |
| C | 7152 | 5481 | 378 | 378 | 5.29% | 6.90% | 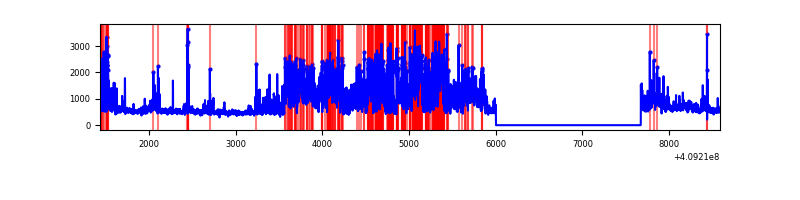 |
| D | 7152 | 5481 | 65 | 65 | 0.91% | 1.19% | 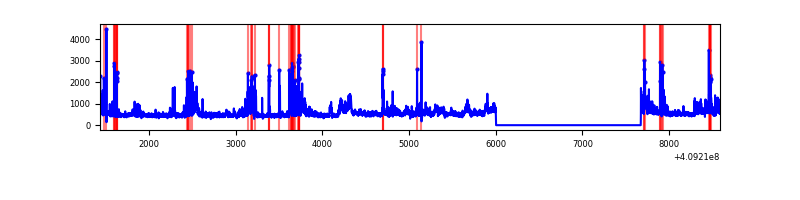 |
Top three noisy pixels from each quadrant. If the there are fewer than three noisy pixels in the level2.evt file, extra rows are filled as -1
| Pixel properties | Quadrant properties | ||||||
|---|---|---|---|---|---|---|---|
| Quadrant | DetID | PixID | Counts | Sigma | Mean | Median | Sigma |
| A | 10 | 83 | 418663 | 3306.66 | 623 | 611 | 126.4 |
| A | 13 | 248 | 17074 | 130.22 | 623 | 611 | 126.4 |
| A | 5 | 168 | 15134 | 114.87 | 623 | 611 | 126.4 |
| B | 5 | 184 | 42270 | 345.58 | 620 | 602 | 120.6 |
| B | 12 | 111 | 15316 | 122.03 | 620 | 602 | 120.6 |
| B | 11 | 111 | 14249 | 113.18 | 620 | 602 | 120.6 |
| C | 15 | 208 | 2465077 | 17775.0 | 597 | 601 | 138.6 |
| C | 15 | 214 | 229608 | 1651.71 | 597 | 601 | 138.6 |
| C | 3 | 233 | 193669 | 1392.5 | 597 | 601 | 138.6 |
| D | 12 | 235 | 513189 | 3506.87 | 602 | 585 | 146.2 |
| D | 12 | 227 | 146053 | 995.19 | 602 | 585 | 146.2 |
| D | 12 | 233 | 128017 | 871.8 | 602 | 585 | 146.2 |
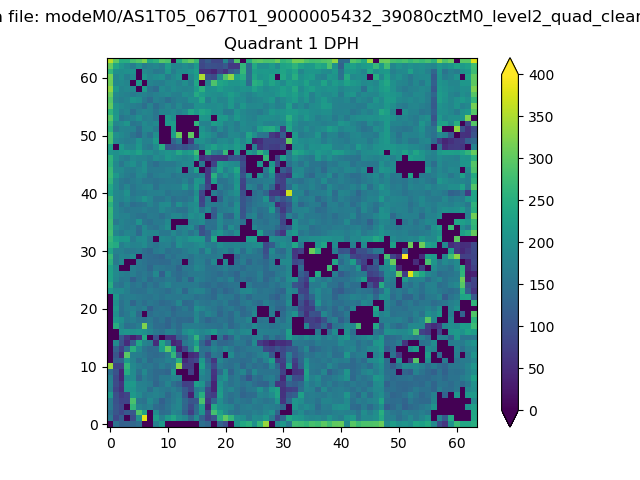
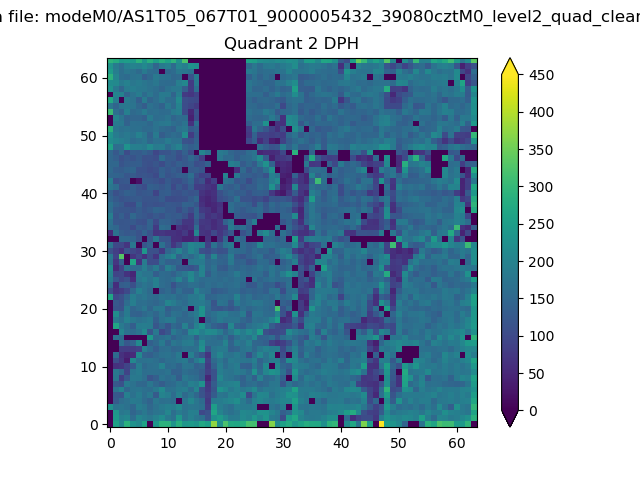
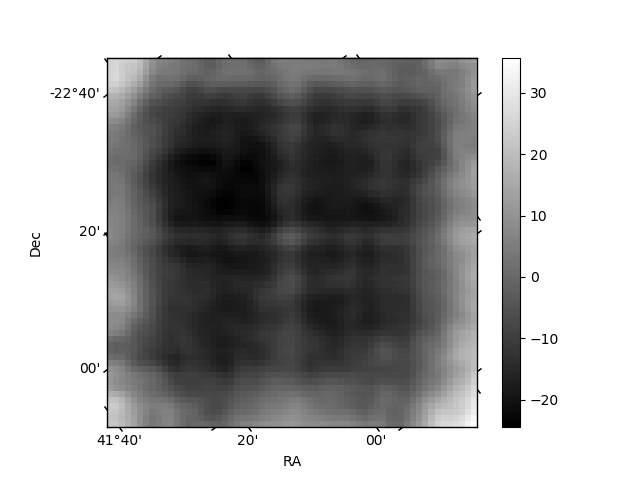
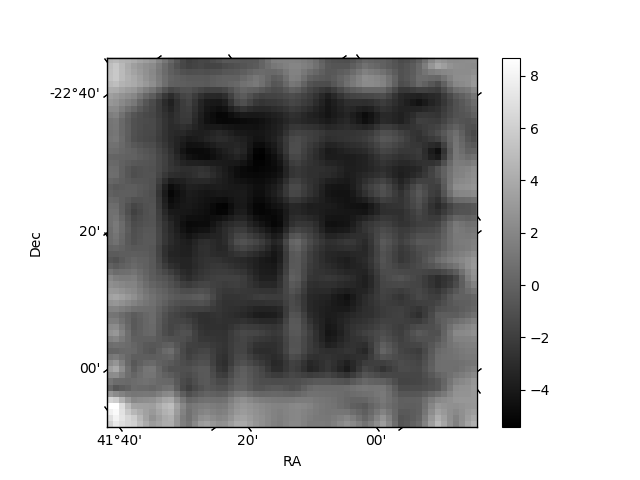
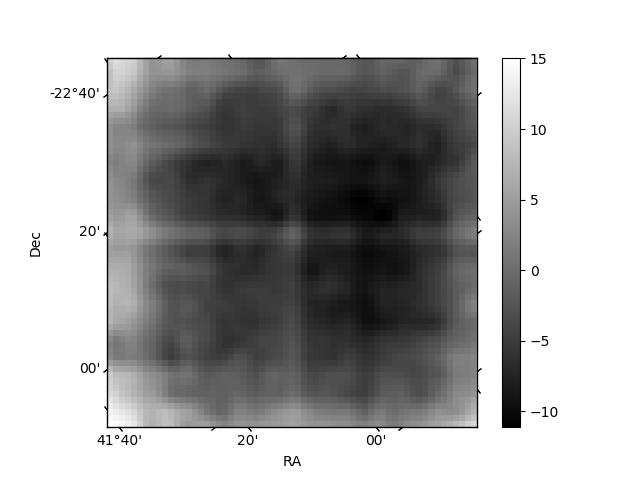
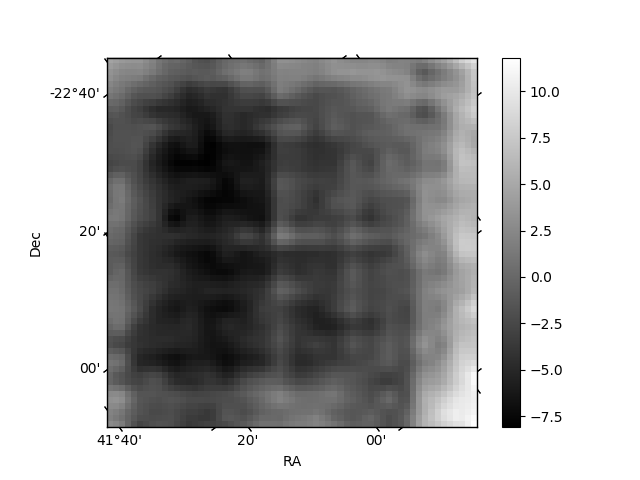
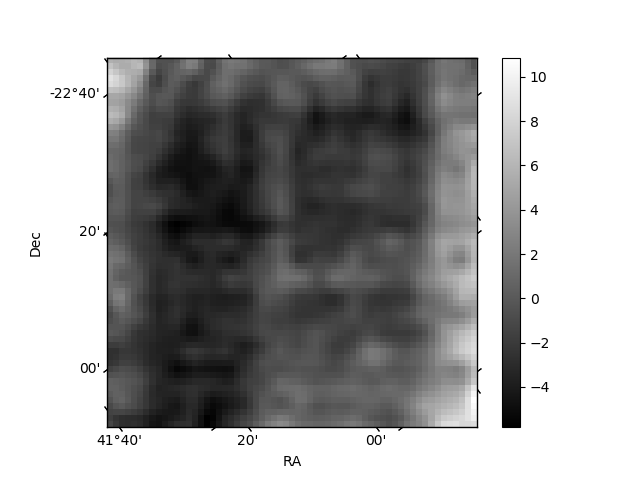
Histogram calculated using DETX and DETY for each event in the final _common_clean file
| Quadrant A | 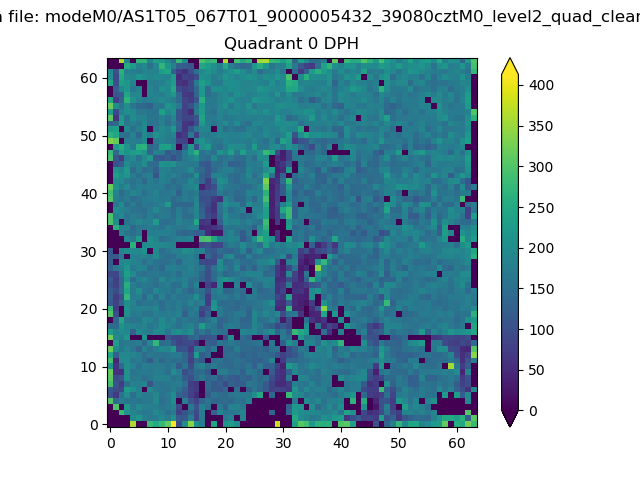 |
 |
Quadrant B |
|---|---|---|---|
| Quadrant D | 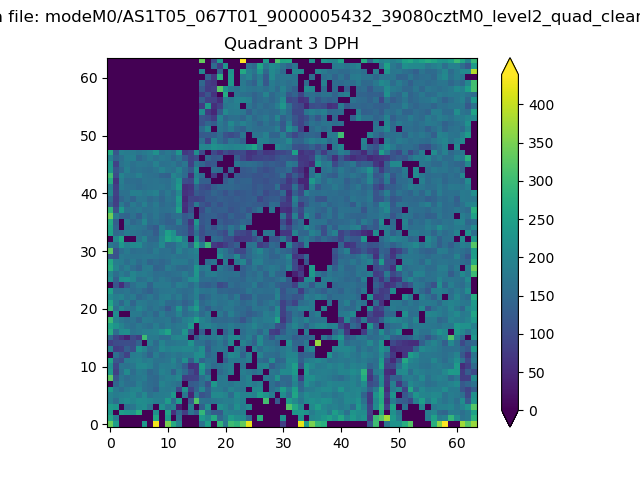 |
 |
Quadrant C |
| Plot type | Count rate plots | Images |
|---|---|---|
| Comparison with Poisson distribution Blue bars denote a histogram of data divided into 1 sec bins. Red curve is a Poisson curve with rate = median count rate of data. |
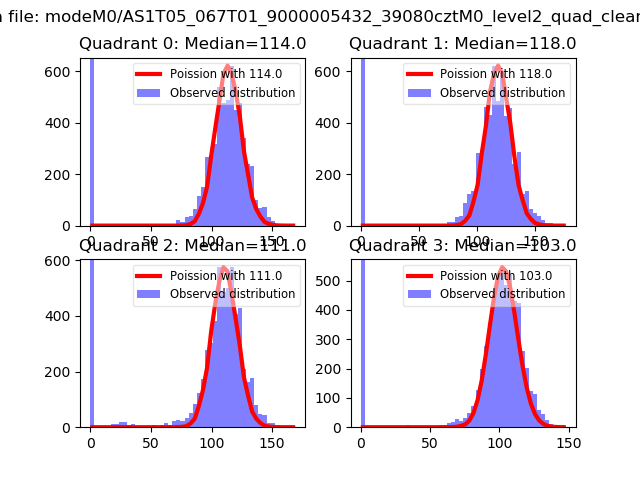 |
 |
| Quadrant-wise count rates Data is divided into 100 sec bins |
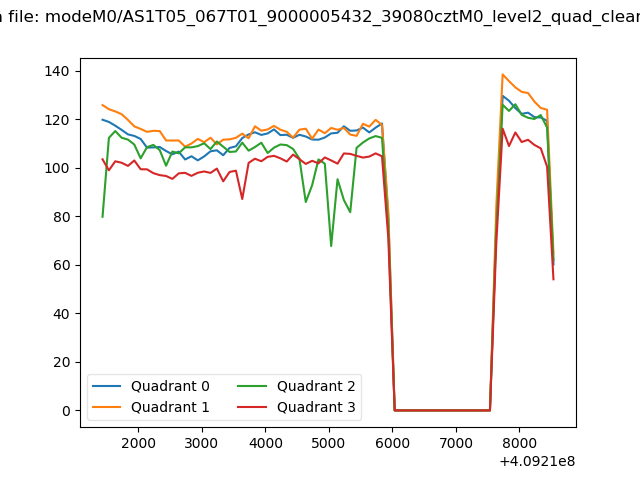 |
|
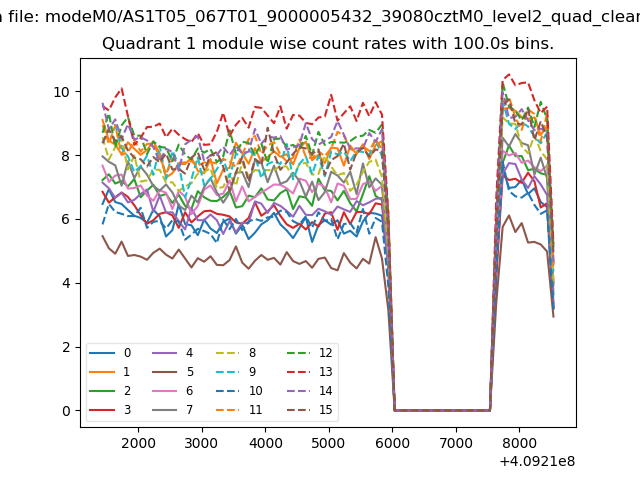
| Module-wise count rates for Quadrant A Data is divided into 100 sec bins |
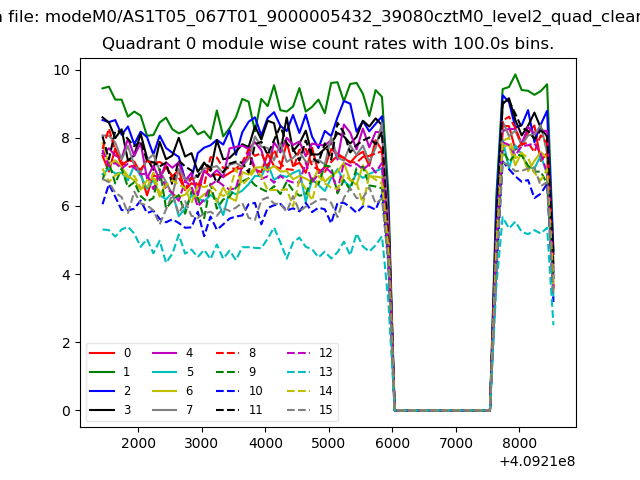 |
 |
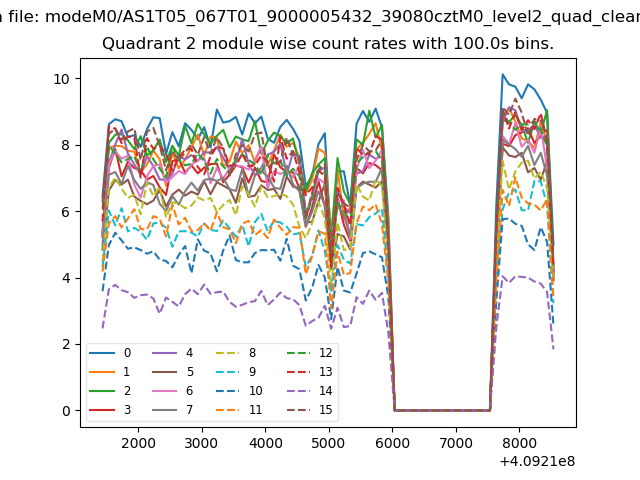
| Module-wise count rates for Quadrant B Data is divided into 100 sec bins |
 |
 |
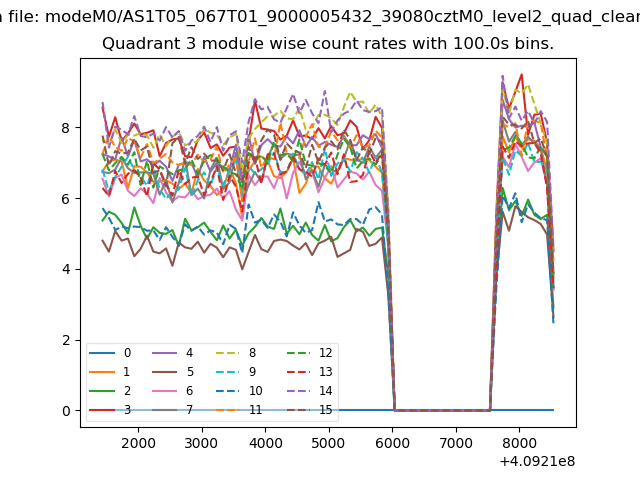
| Module-wise count rates for Quadrant C Data is divided into 100 sec bins |
 |
 |
| Module-wise count rates for Quadrant D Data is divided into 100 sec bins |
 |
 |
| Parameter | Plot |
|---|---|
| CZT HV Monitor | 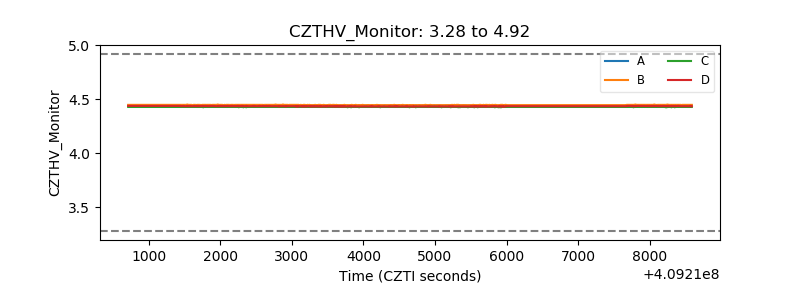 |
| D_VDD | 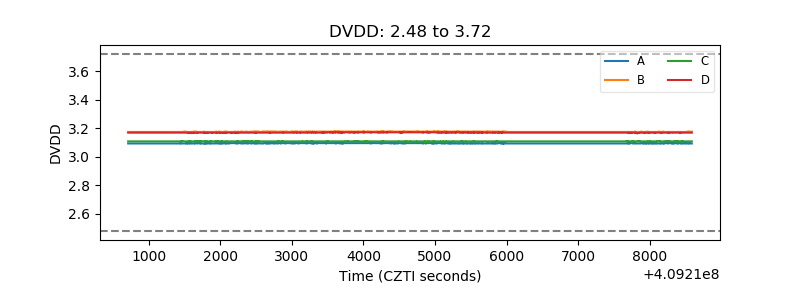 |
| Temperature 1 | 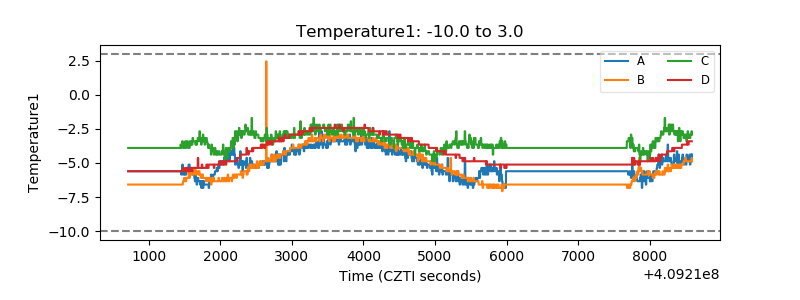 |
| Veto HV Monitor | 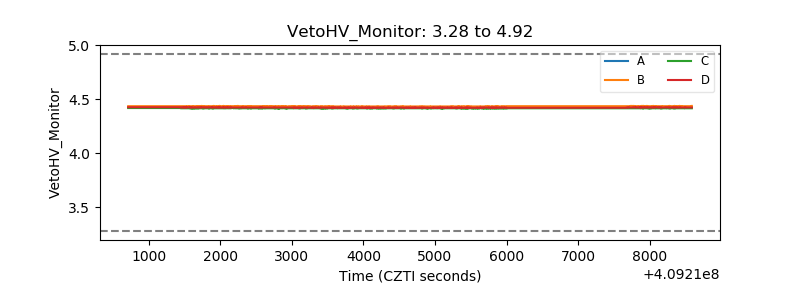 |
| Veto LLD | 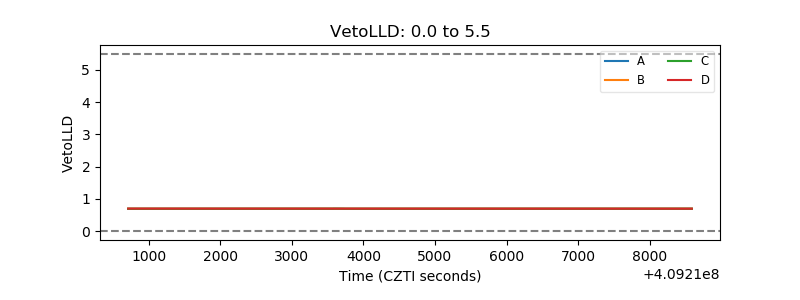 |
| Alpha Counter | 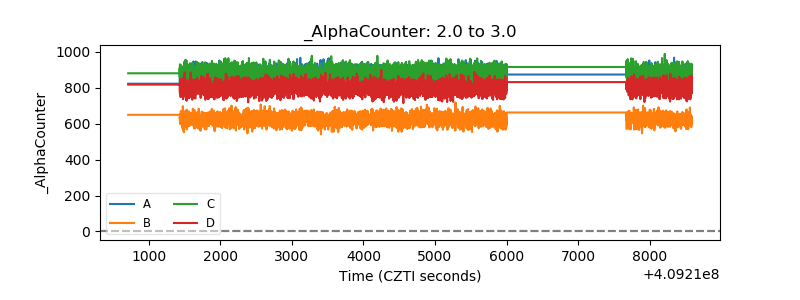 |
| _CPM_Rate | 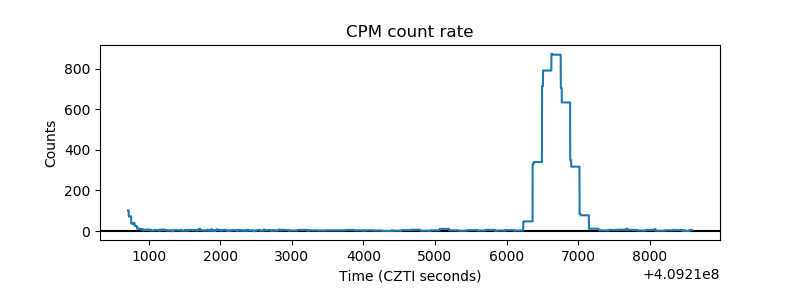 |
| CZT Counter | 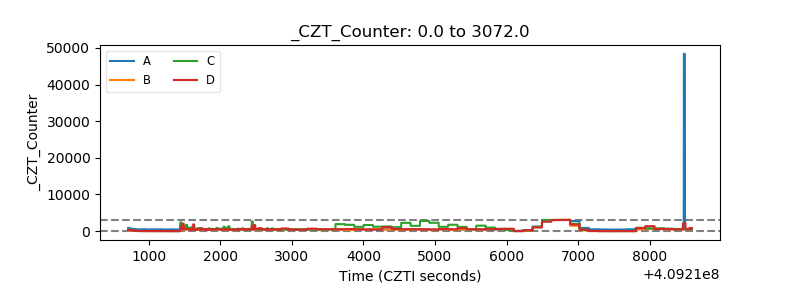 |
| +2.5 Volts monitor | 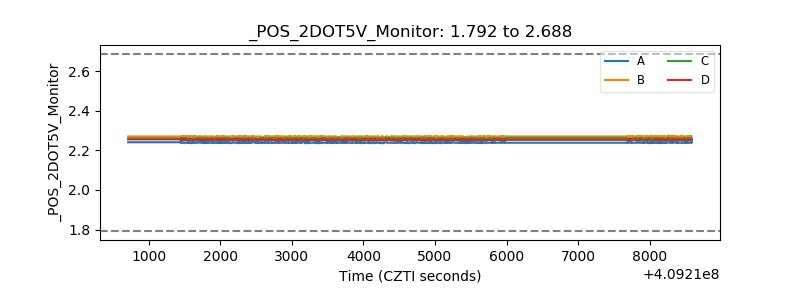 |
| +5 Volts monitor | 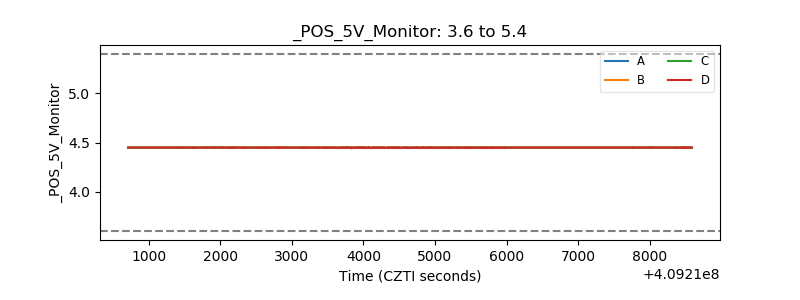 |
| _ROLL_ROT | 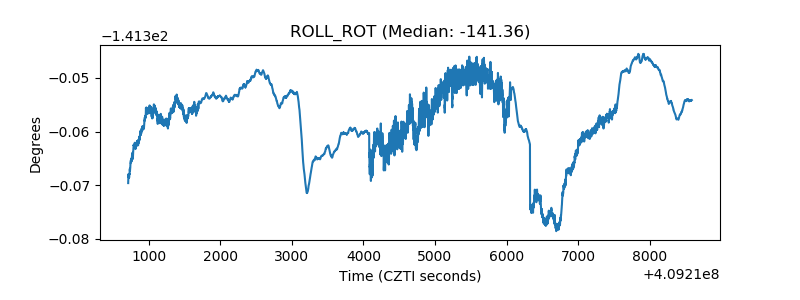 |
| _Roll_DEC | 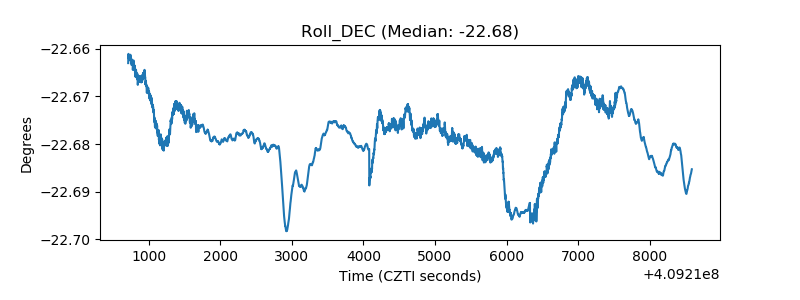 |
| _Roll_RA | 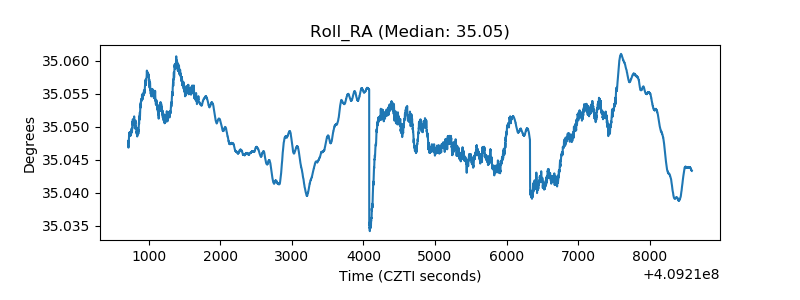 |
| Veto Counter | 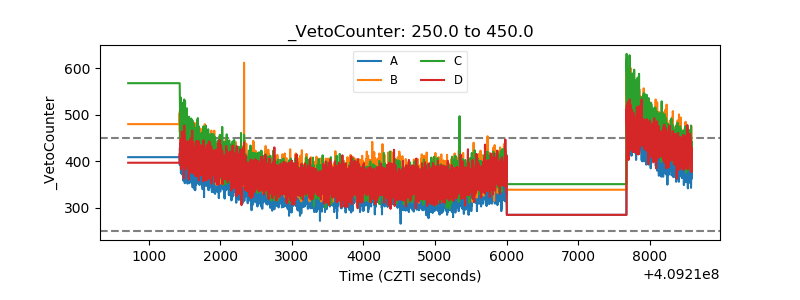 |