| Param | Original file | Final file |
|---|---|---|
| Filename | modeM0/AS1T05_067T01_9000005432_39082cztM0_level2.fits | modeM0/AS1T05_067T01_9000005432_39082cztM0_level2_quad_clean.evt |
| Size (bytes) | 360,944,640 | 95,074,560 |
| Size | 344.2 MB | 90.7 MB |
| Events in quadrant A | 2,904,132 | 642,687 |
| Events in quadrant B | 2,606,159 | 664,970 |
| Events in quadrant C | 3,287,260 | 623,762 |
| Events in quadrant D | 4,150,036 | 575,407 |
| Mode M0 | |||
|---|---|---|---|
| Quadrant | BADHDUFLAG | Total packets | Discarded packets |
| A | 0 | 11891 | 3 |
| B | 0 | 11123 | 2 |
| C | 0 | 13257 | 2 |
| D | 0 | 15990 | 2 |
| Mode SS | |||
|---|---|---|---|
| Quadrant | BADHDUFLAG | Total packets | Discarded packets |
| A | 0 | 108 | 0 |
| B | 0 | 108 | 0 |
| C | 0 | 108 | 0 |
| D | 0 | 108 | 0 |
| Mode M9 | |||
|---|---|---|---|
| Quadrant | BADHDUFLAG | Total packets | Discarded packets |
| A | 0 | 25 | 0 |
| B | 0 | 25 | 0 |
| C | 0 | 25 | 0 |
| D | 0 | 26 | 0 |
| Quadrant | Total seconds | Saturated seconds | Saturation percentage |
|---|---|---|---|
| A | 5315 | 21 | 0.395108% |
| B | 5315 | 11 | 0.206961% |
| C | 5315 | 65 | 1.222954% |
| D | 5315 | 82 | 1.542803% |
Noise dominated data is calculated using 1-second bins in cleaned event files. If a bin has >2000 counts, and if more than 50% of those come from <1% of pixels, then it is considered to be noise-dominated and hence unusable.
| Quadrant | # 1 sec bins | Bins with >0 counts | Bins with >2000 counts | High rate bins dominated by noise | Noise dominated (total time) | Noise dominated (detector-on time) | Marked lightcurve |
|---|---|---|---|---|---|---|---|
| A | 7138 | 5316 | 5 | 5 | 0.07% | 0.09% | 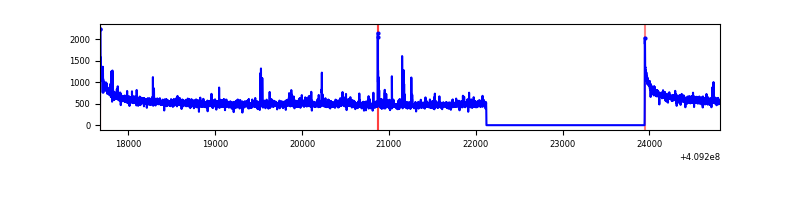 |
| B | 7138 | 5316 | 1 | 1 | 0.01% | 0.02% | 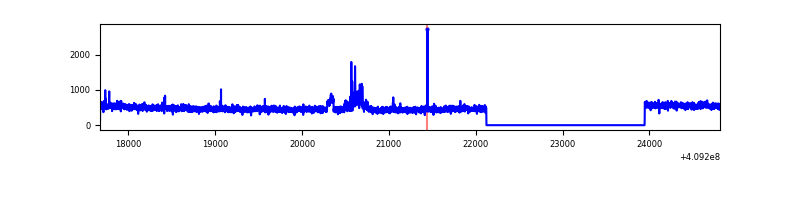 |
| C | 7138 | 5316 | 49 | 49 | 0.69% | 0.92% | 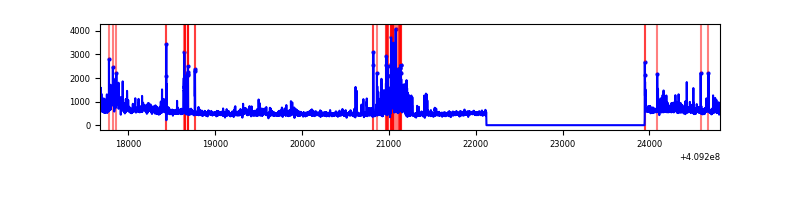 |
| D | 7138 | 5316 | 76 | 76 | 1.06% | 1.43% | 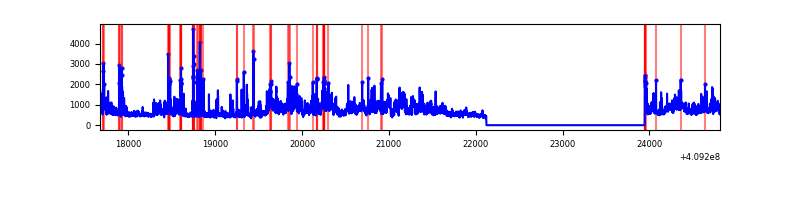 |
Top three noisy pixels from each quadrant. If the there are fewer than three noisy pixels in the level2.evt file, extra rows are filled as -1
| Pixel properties | Quadrant properties | ||||||
|---|---|---|---|---|---|---|---|
| Quadrant | DetID | PixID | Counts | Sigma | Mean | Median | Sigma |
| A | 10 | 83 | 406599 | 3196.15 | 627 | 616 | 127.0 |
| A | 13 | 248 | 24903 | 191.2 | 627 | 616 | 127.0 |
| A | 7 | 3 | 16618 | 125.98 | 627 | 616 | 127.0 |
| B | 5 | 184 | 91104 | 754.06 | 622 | 605 | 120.0 |
| B | 0 | 213 | 25701 | 209.11 | 622 | 605 | 120.0 |
| B | 0 | 230 | 21625 | 175.14 | 622 | 605 | 120.0 |
| C | 15 | 208 | 525451 | 3740.88 | 603 | 608 | 140.3 |
| C | 15 | 214 | 223043 | 1585.43 | 603 | 608 | 140.3 |
| C | 3 | 233 | 180237 | 1280.33 | 603 | 608 | 140.3 |
| D | 12 | 235 | 897789 | 6177.52 | 602 | 585 | 145.2 |
| D | 12 | 227 | 481108 | 3308.54 | 602 | 585 | 145.2 |
| D | 2 | 249 | 214498 | 1472.85 | 602 | 585 | 145.2 |
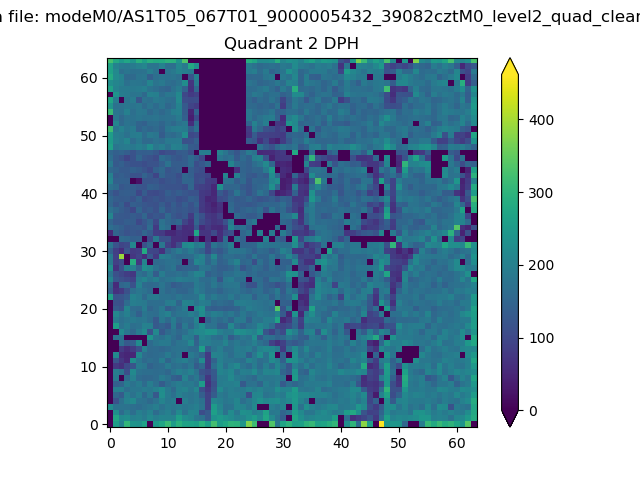
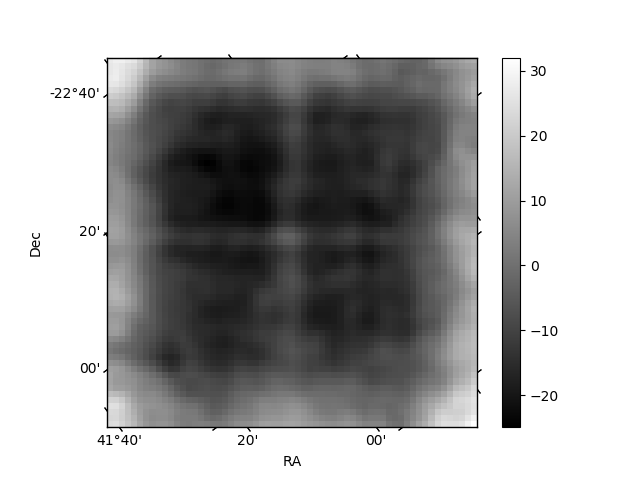
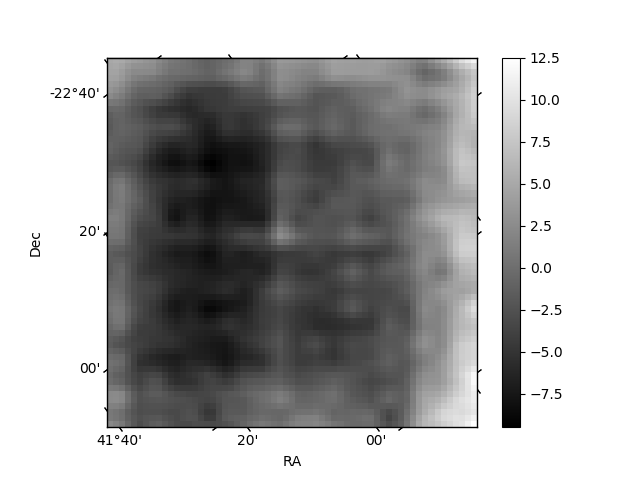
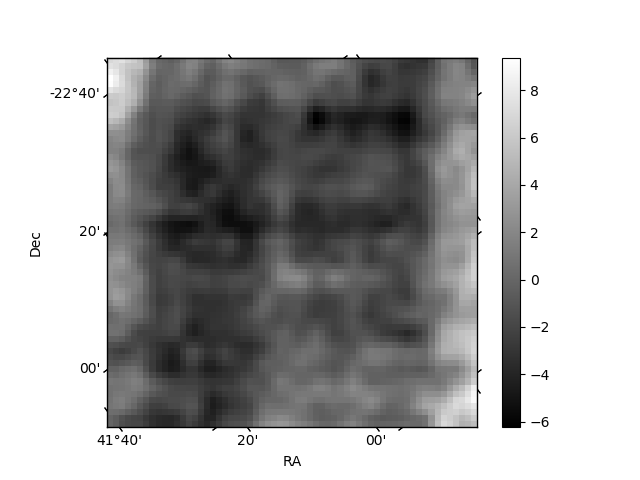
Histogram calculated using DETX and DETY for each event in the final _common_clean file
| Quadrant A | 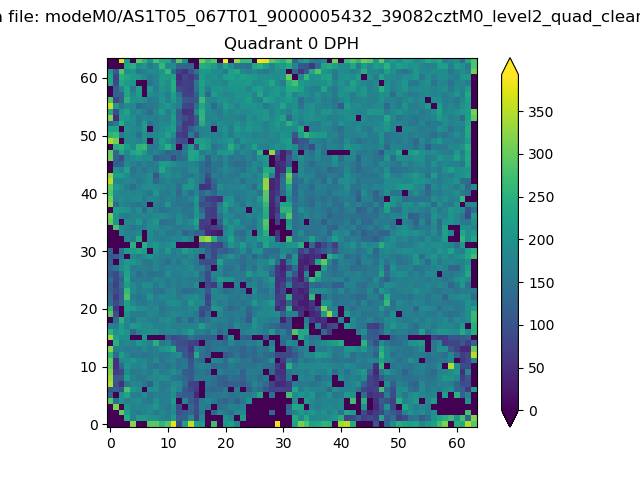 |
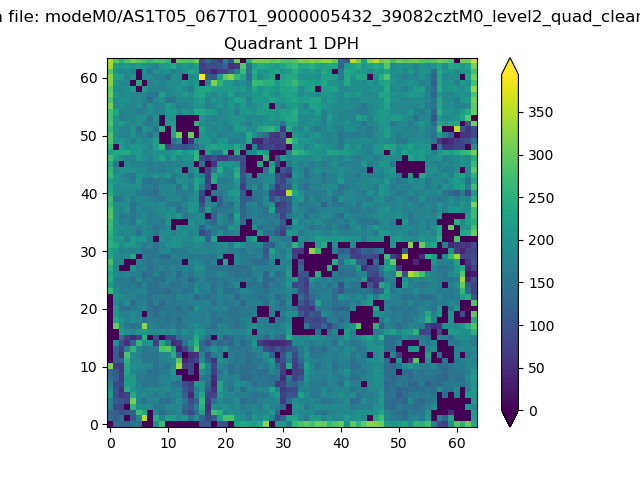 |
Quadrant B |
|---|---|---|---|
| Quadrant D | 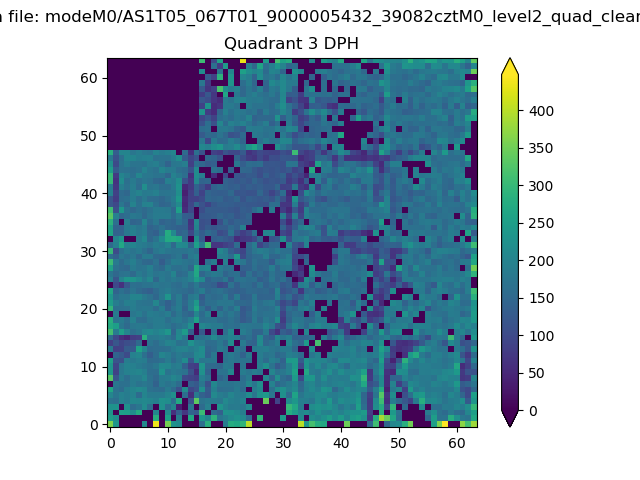 |
 |
Quadrant C |
| Plot type | Count rate plots | Images |
|---|---|---|
| Comparison with Poisson distribution Blue bars denote a histogram of data divided into 1 sec bins. Red curve is a Poisson curve with rate = median count rate of data. |
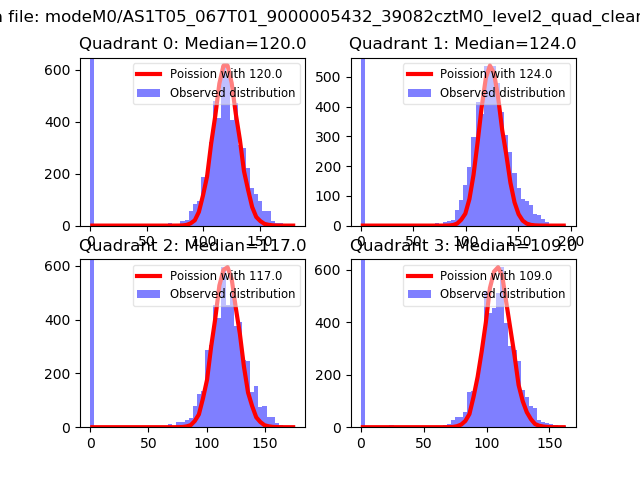 |
 |
| Quadrant-wise count rates Data is divided into 100 sec bins |
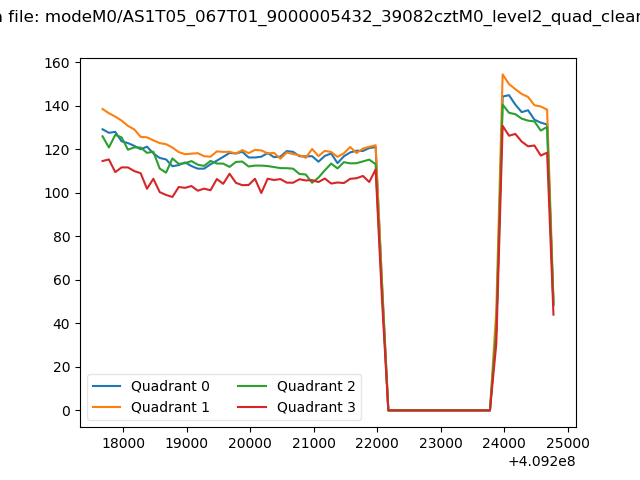 |
|
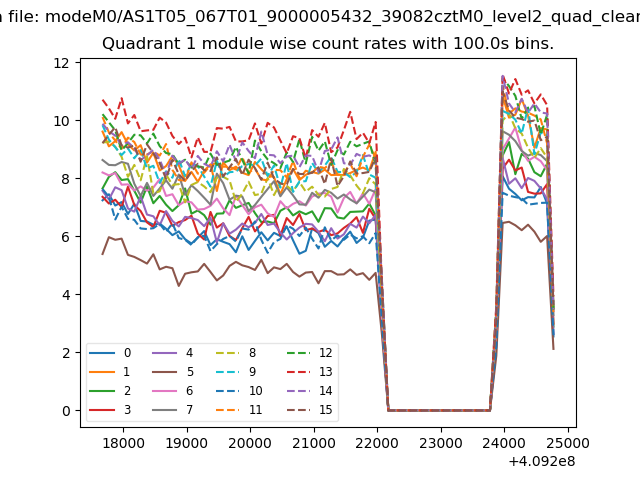
| Module-wise count rates for Quadrant A Data is divided into 100 sec bins |
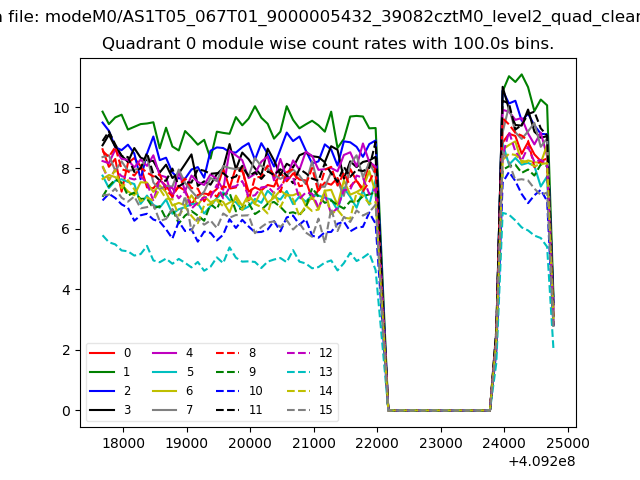 |
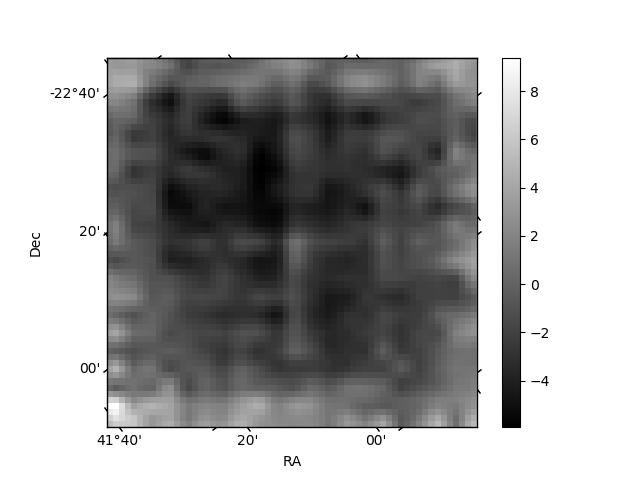 |
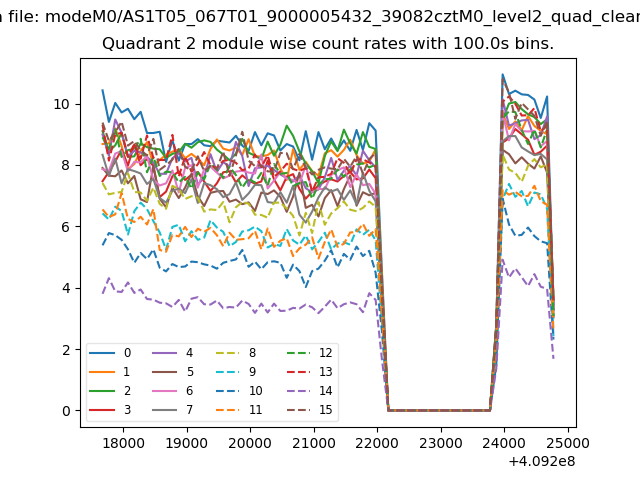
| Module-wise count rates for Quadrant B Data is divided into 100 sec bins |
 |
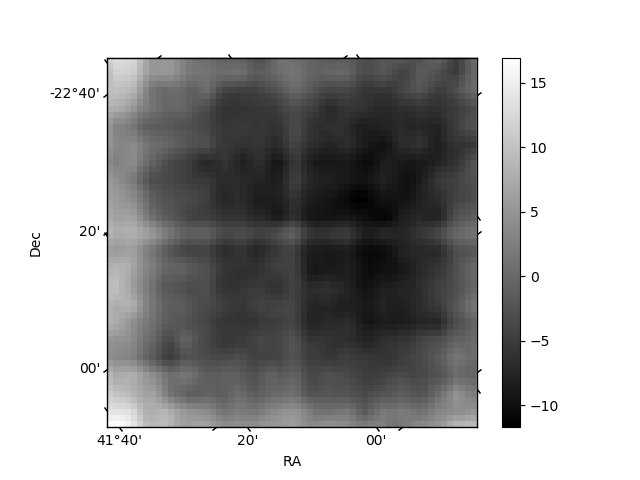 |
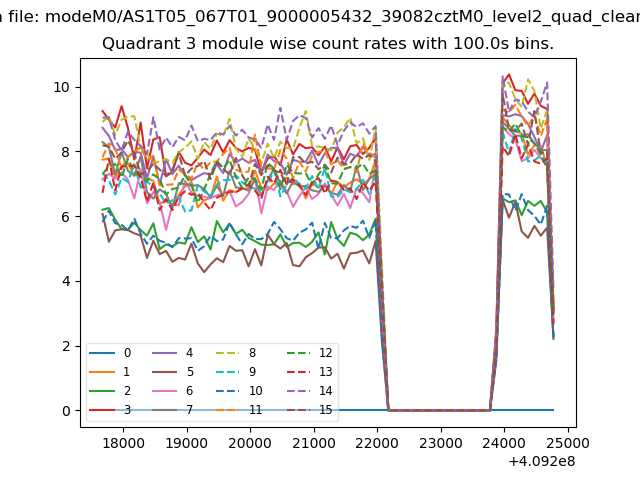
| Module-wise count rates for Quadrant C Data is divided into 100 sec bins |
 |
 |
| Module-wise count rates for Quadrant D Data is divided into 100 sec bins |
 |
 |
| Parameter | Plot |
|---|---|
| CZT HV Monitor | 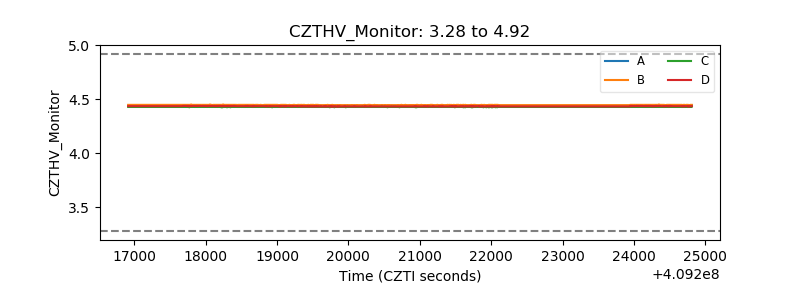 |
| D_VDD | 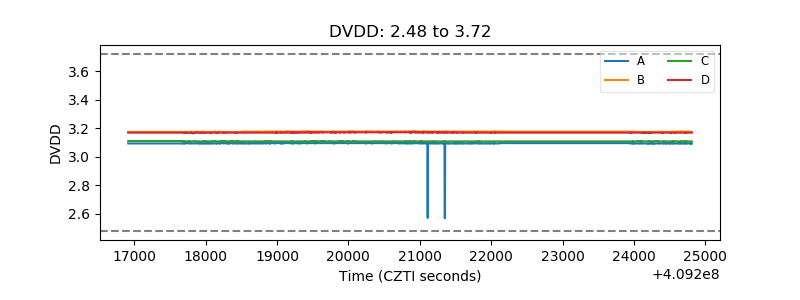 |
| Temperature 1 | 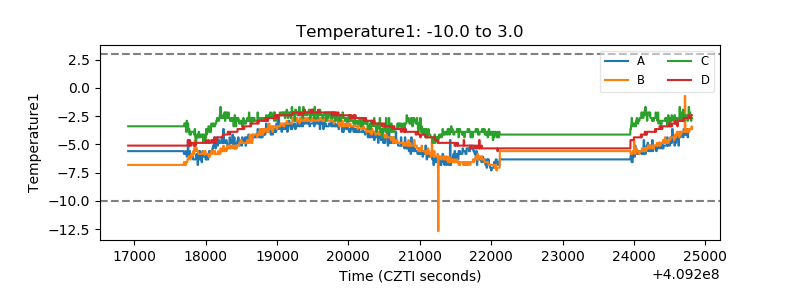 |
| Veto HV Monitor | 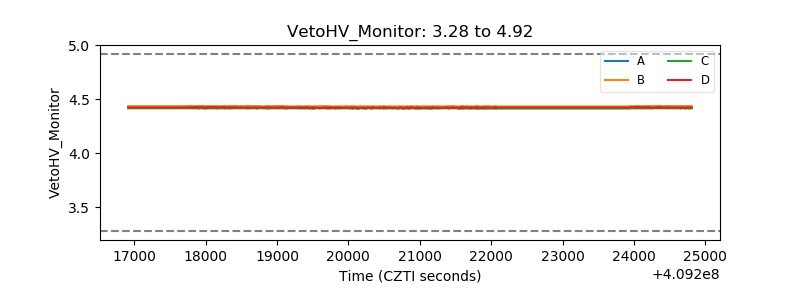 |
| Veto LLD | 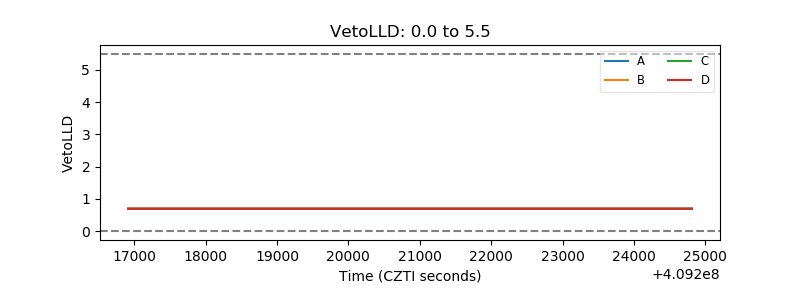 |
| Alpha Counter | 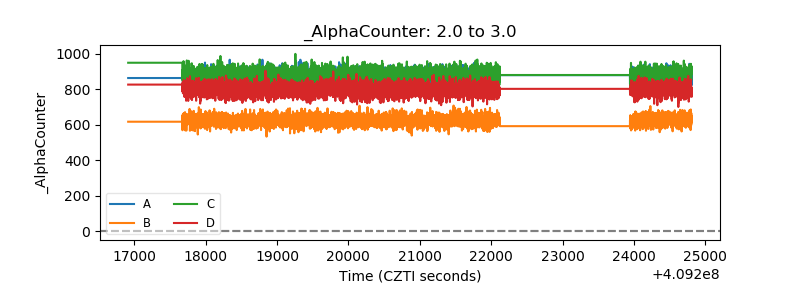 |
| _CPM_Rate | 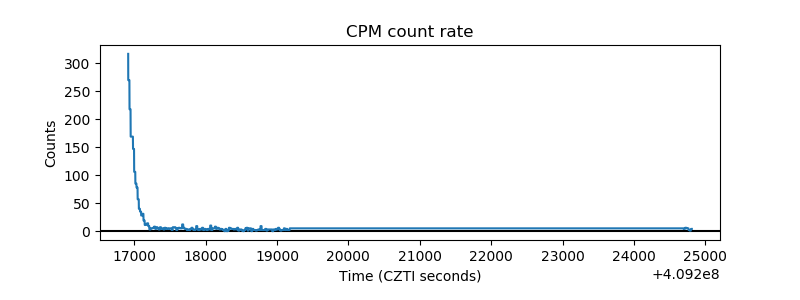 |
| CZT Counter | 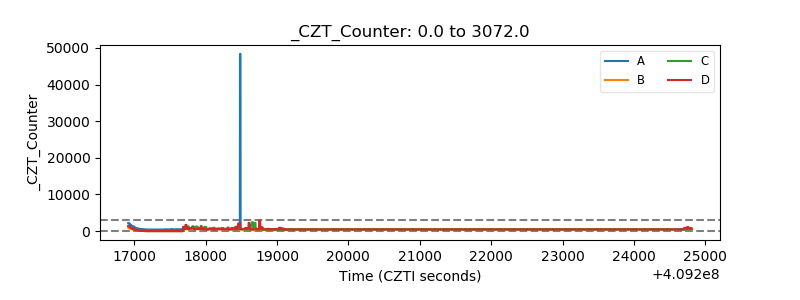 |
| +2.5 Volts monitor | 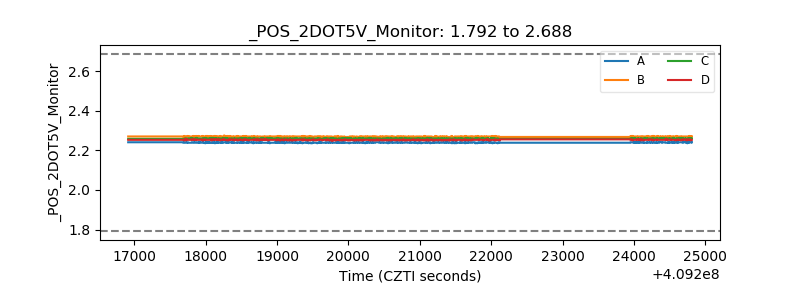 |
| +5 Volts monitor | 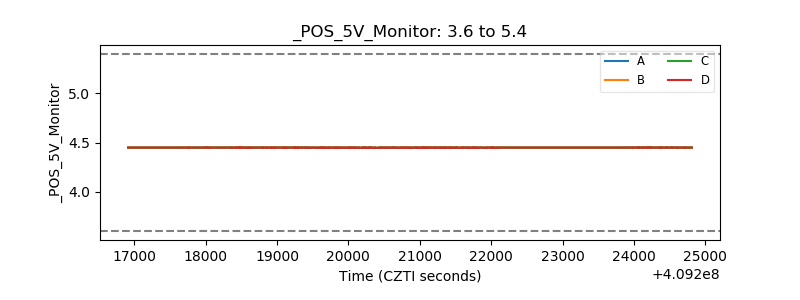 |
| _ROLL_ROT | 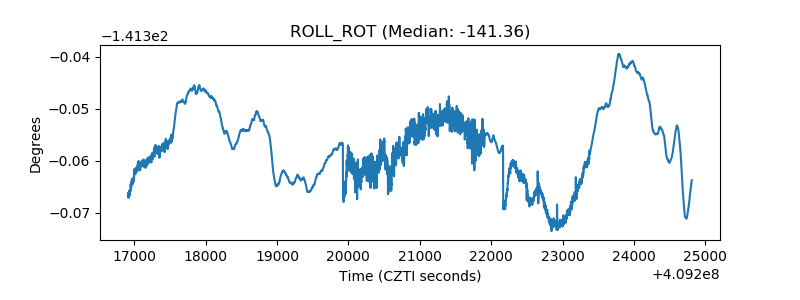 |
| _Roll_DEC | 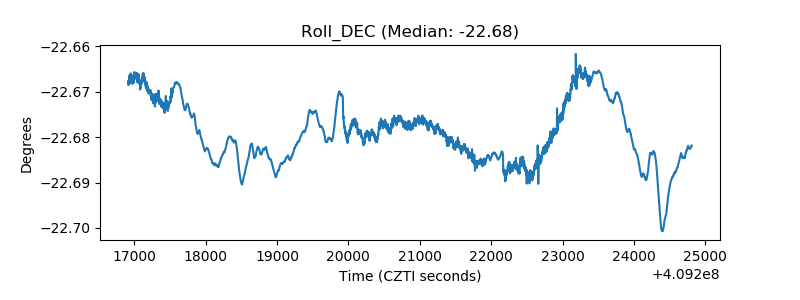 |
| _Roll_RA | 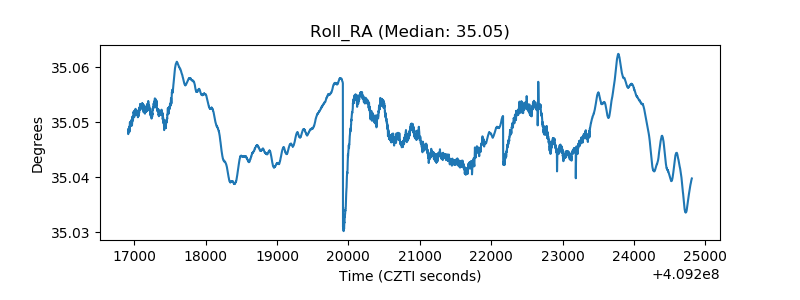 |
| Veto Counter | 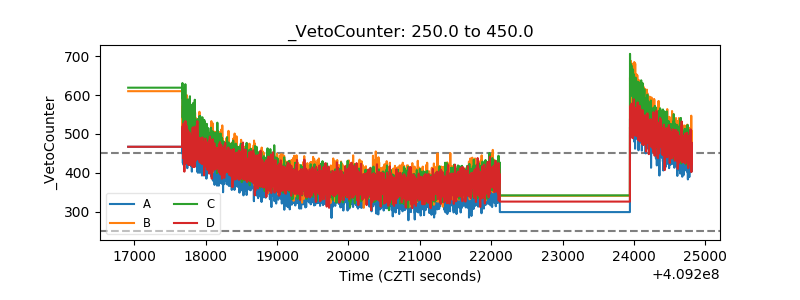 |