| Param | Original file | Final file |
|---|---|---|
| Filename | modeM0/AS1T05_067T01_9000005432_39083cztM0_level2.fits | modeM0/AS1T05_067T01_9000005432_39083cztM0_level2_quad_clean.evt |
| Size (bytes) | 415,391,040 | 102,193,920 |
| Size | 396.1 MB | 97.5 MB |
| Events in quadrant A | 3,124,296 | 705,357 |
| Events in quadrant B | 2,816,941 | 726,743 |
| Events in quadrant C | 4,004,426 | 661,089 |
| Events in quadrant D | 5,006,458 | 619,461 |
| Mode M0 | |||
|---|---|---|---|
| Quadrant | BADHDUFLAG | Total packets | Discarded packets |
| A | 0 | 12672 | 2 |
| B | 0 | 11735 | 1 |
| C | 0 | 15580 | 1 |
| D | 0 | 18786 | 1 |
| Mode SS | |||
|---|---|---|---|
| Quadrant | BADHDUFLAG | Total packets | Discarded packets |
| A | 0 | 112 | 0 |
| B | 0 | 112 | 0 |
| C | 0 | 112 | 0 |
| D | 0 | 112 | 0 |
| Mode M9 | |||
|---|---|---|---|
| Quadrant | BADHDUFLAG | Total packets | Discarded packets |
| A | 0 | 38 | 0 |
| B | 0 | 38 | 0 |
| C | 0 | 38 | 0 |
| D | 0 | 38 | 0 |
| Quadrant | Total seconds | Saturated seconds | Saturation percentage |
|---|---|---|---|
| A | 5465 | 19 | 0.347667% |
| B | 5465 | 25 | 0.457457% |
| C | 5465 | 162 | 2.964318% |
| D | 5465 | 149 | 2.726441% |
Noise dominated data is calculated using 1-second bins in cleaned event files. If a bin has >2000 counts, and if more than 50% of those come from <1% of pixels, then it is considered to be noise-dominated and hence unusable.
| Quadrant | # 1 sec bins | Bins with >0 counts | Bins with >2000 counts | High rate bins dominated by noise | Noise dominated (total time) | Noise dominated (detector-on time) | Marked lightcurve |
|---|---|---|---|---|---|---|---|
| A | 9231 | 5467 | 3 | 3 | 0.03% | 0.05% | 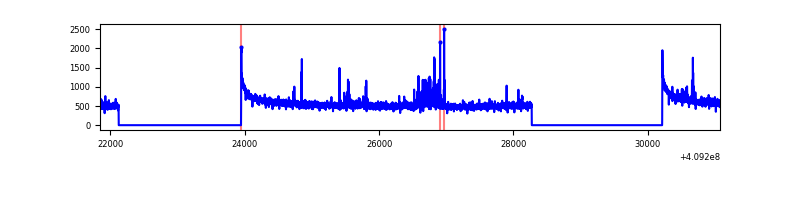 |
| B | 9231 | 5467 | 6 | 6 | 0.06% | 0.11% | 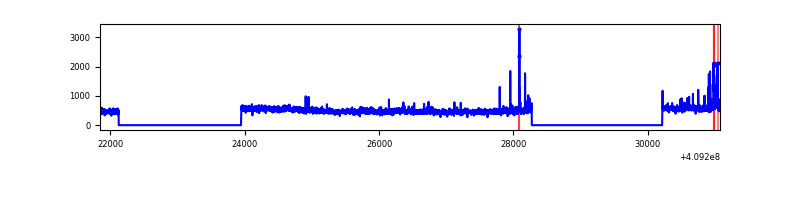 |
| C | 9231 | 5467 | 124 | 124 | 1.34% | 2.27% | 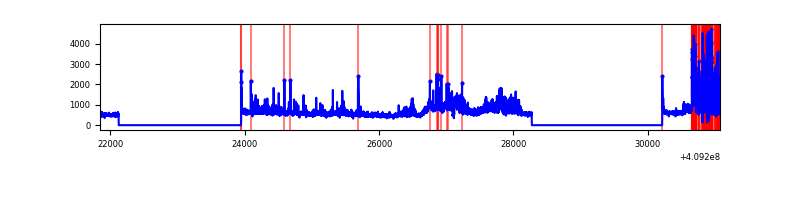 |
| D | 9231 | 5467 | 166 | 166 | 1.80% | 3.04% | 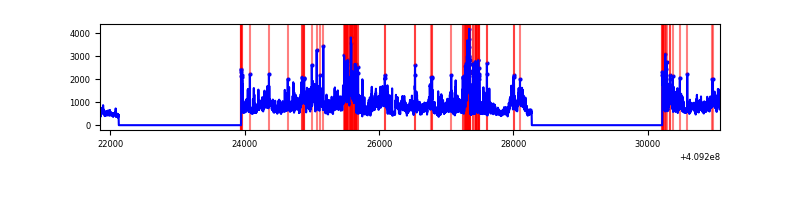 |
Top three noisy pixels from each quadrant. If the there are fewer than three noisy pixels in the level2.evt file, extra rows are filled as -1
| Pixel properties | Quadrant properties | ||||||
|---|---|---|---|---|---|---|---|
| Quadrant | DetID | PixID | Counts | Sigma | Mean | Median | Sigma |
| A | 10 | 83 | 411309 | 3081.5 | 668 | 658 | 133.3 |
| A | 7 | 3 | 73771 | 548.63 | 668 | 658 | 133.3 |
| A | 13 | 248 | 18808 | 136.2 | 668 | 658 | 133.3 |
| B | 5 | 184 | 68191 | 535.35 | 661 | 645 | 126.2 |
| B | 5 | 172 | 56102 | 439.54 | 661 | 645 | 126.2 |
| B | 0 | 230 | 52023 | 407.21 | 661 | 645 | 126.2 |
| C | 15 | 208 | 1276868 | 8681.14 | 631 | 636 | 147.0 |
| C | 15 | 214 | 228171 | 1547.73 | 631 | 636 | 147.0 |
| C | 0 | 10 | 15490 | 101.04 | 631 | 636 | 147.0 |
| D | 12 | 235 | 1774705 | 11572.83 | 636 | 620 | 153.3 |
| D | 12 | 233 | 232735 | 1514.15 | 636 | 620 | 153.3 |
| D | 12 | 227 | 200385 | 1303.12 | 636 | 620 | 153.3 |
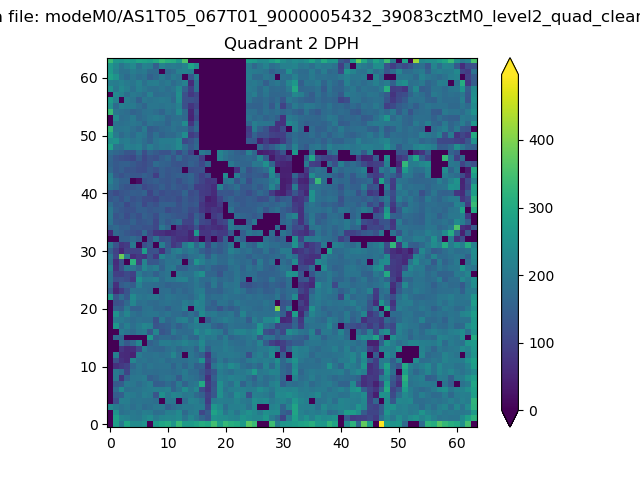
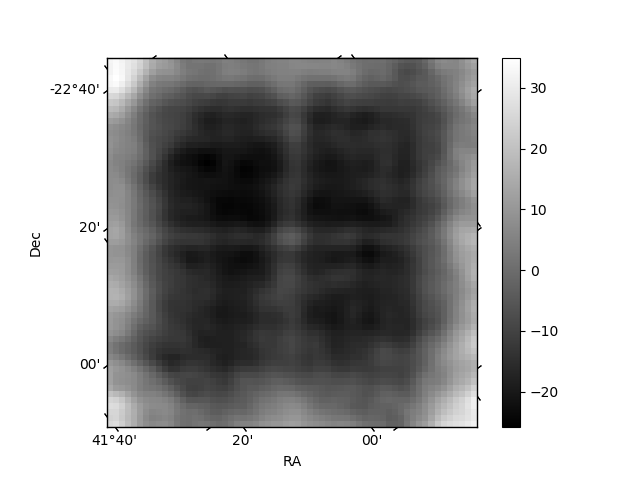
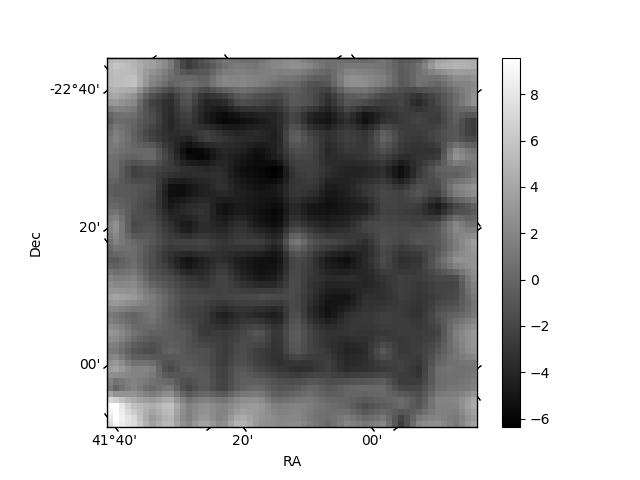
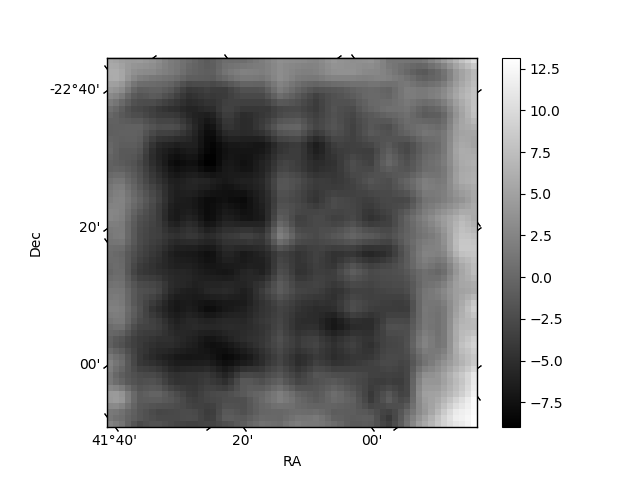
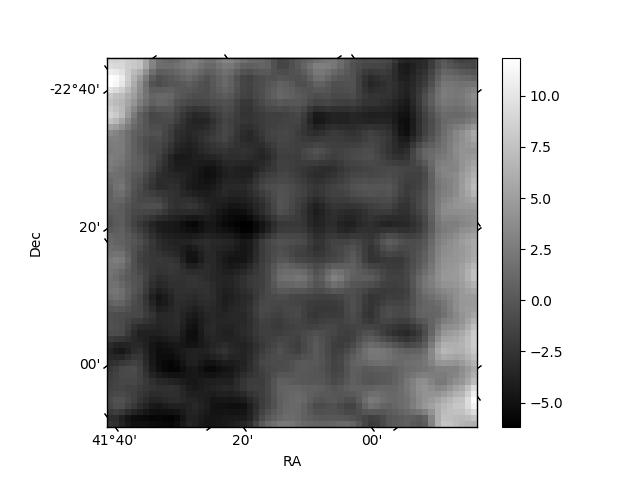
Histogram calculated using DETX and DETY for each event in the final _common_clean file
| Quadrant A | 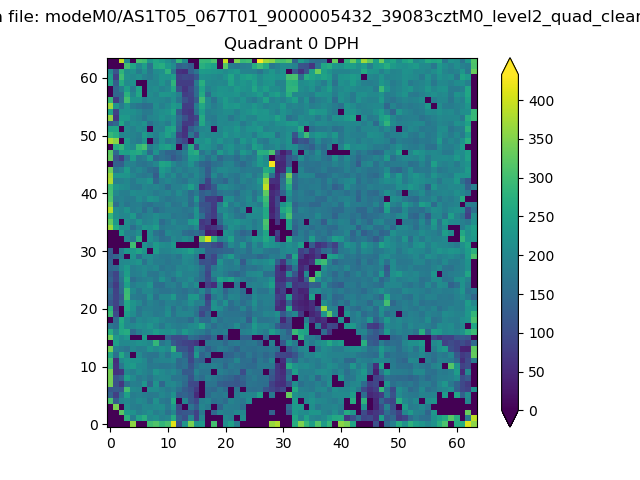 |
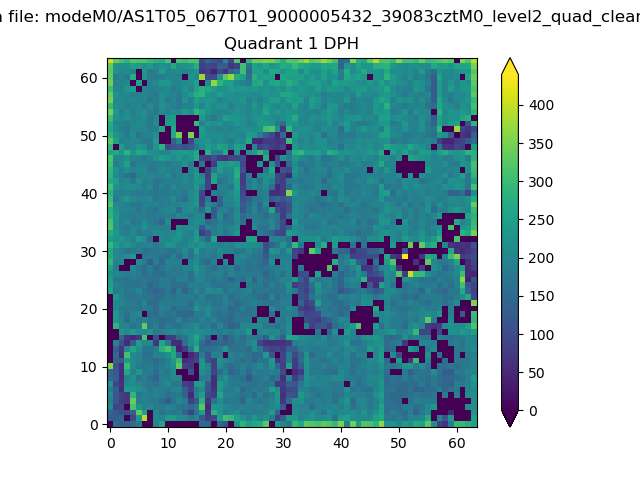 |
Quadrant B |
|---|---|---|---|
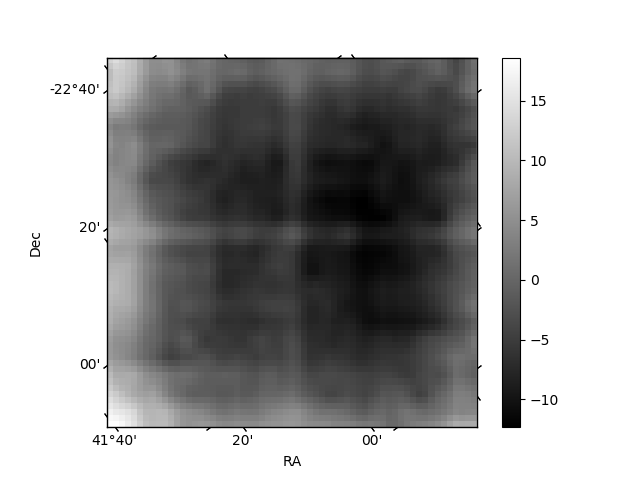
| Quadrant D | 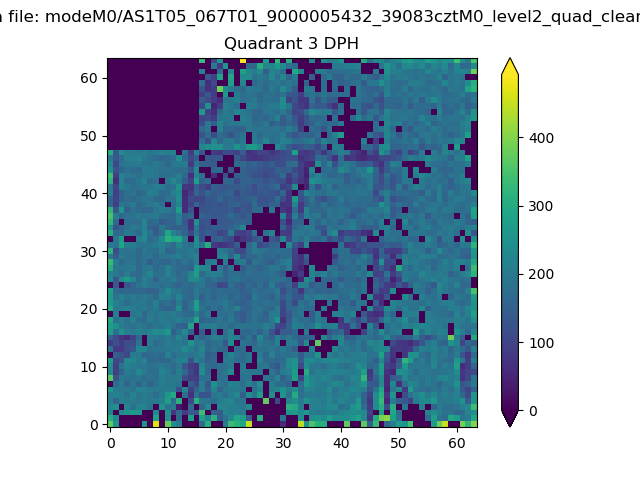 |
 |
Quadrant C |
| Plot type | Count rate plots | Images |
|---|---|---|
| Comparison with Poisson distribution Blue bars denote a histogram of data divided into 1 sec bins. Red curve is a Poisson curve with rate = median count rate of data. |
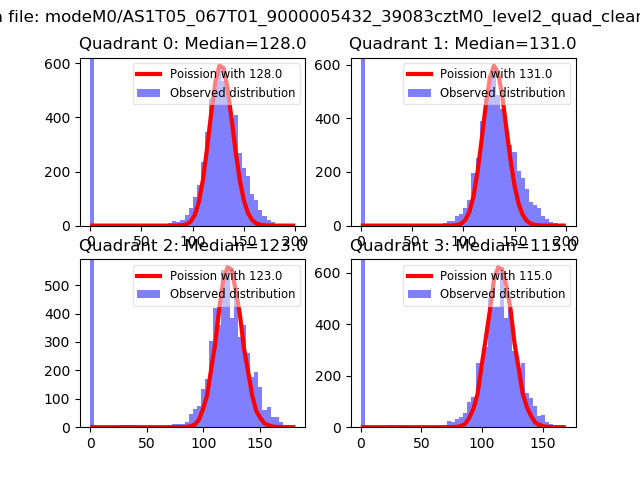 |
 |
| Quadrant-wise count rates Data is divided into 100 sec bins |
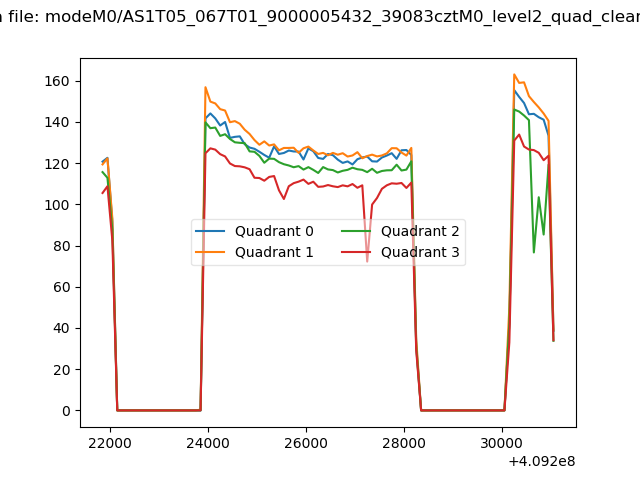 |
|
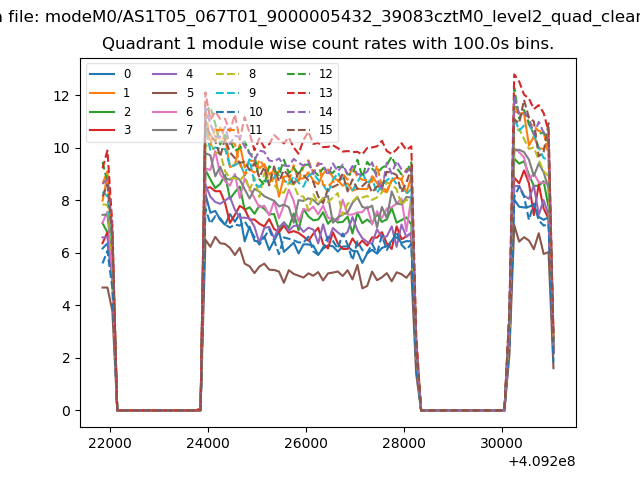
| Module-wise count rates for Quadrant A Data is divided into 100 sec bins |
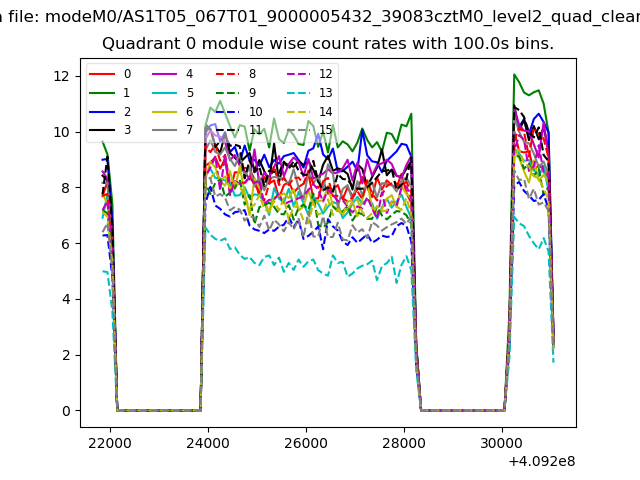 |
 |
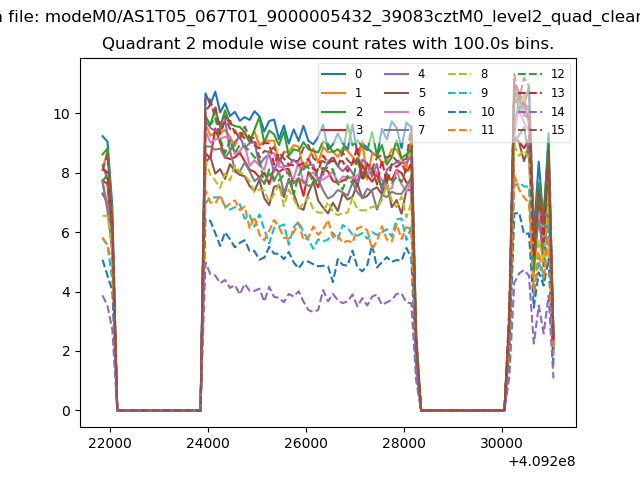
| Module-wise count rates for Quadrant B Data is divided into 100 sec bins |
 |
 |
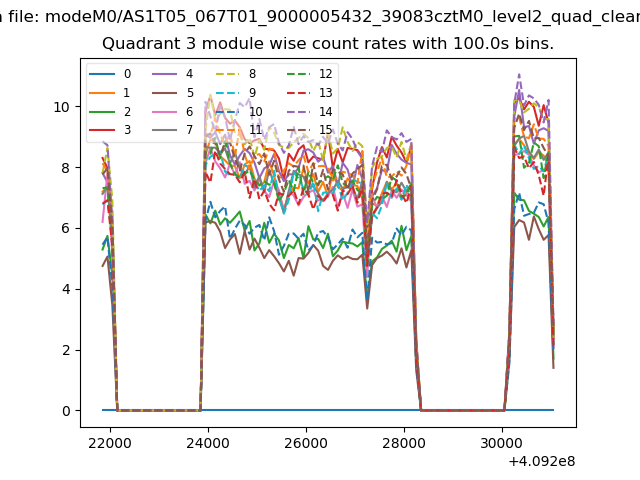
| Module-wise count rates for Quadrant C Data is divided into 100 sec bins |
 |
 |
| Module-wise count rates for Quadrant D Data is divided into 100 sec bins |
 |
 |
| Parameter | Plot |
|---|---|
| CZT HV Monitor | 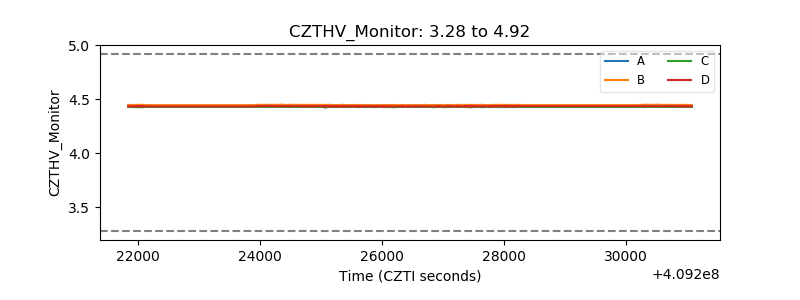 |
| D_VDD | 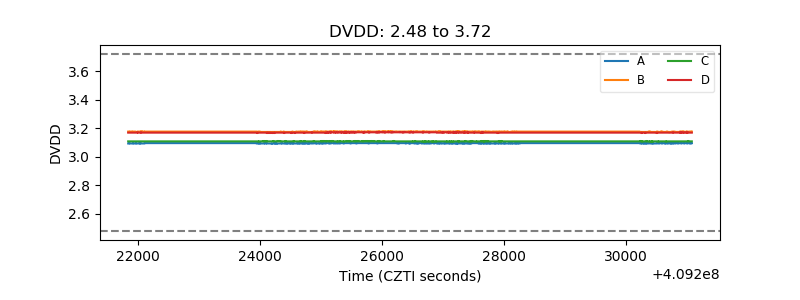 |
| Temperature 1 | 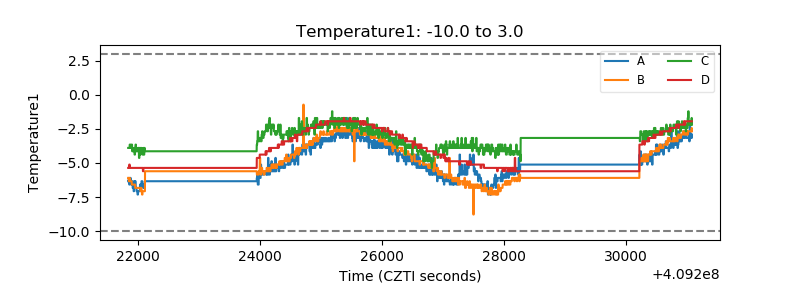 |
| Veto HV Monitor | 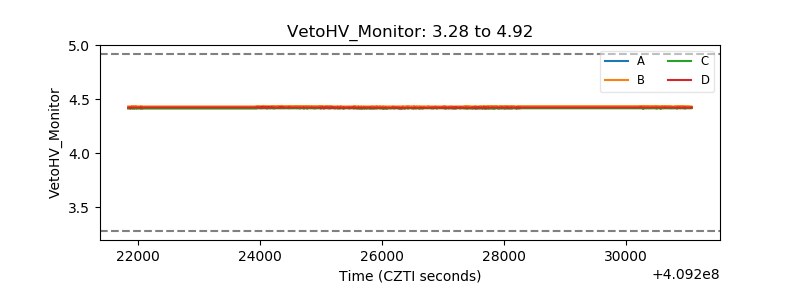 |
| Veto LLD | 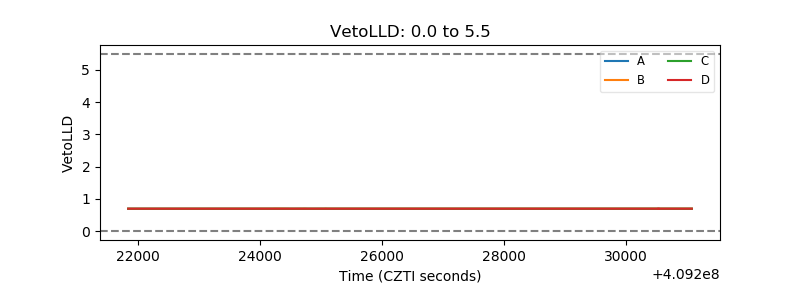 |
| Alpha Counter | 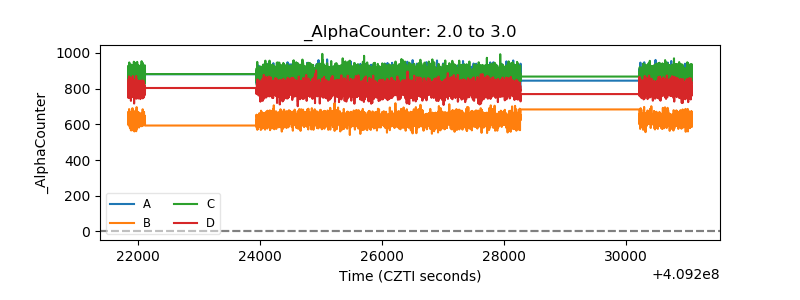 |
| _CPM_Rate | 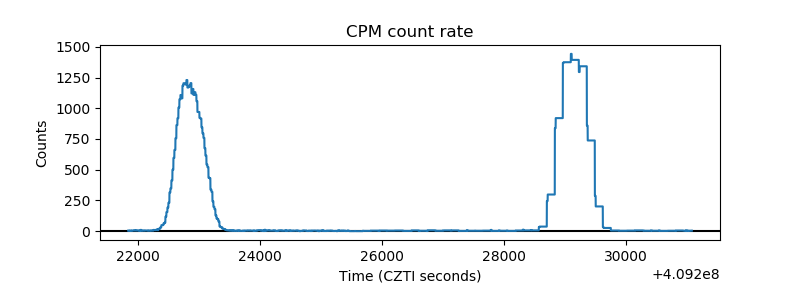 |
| CZT Counter | 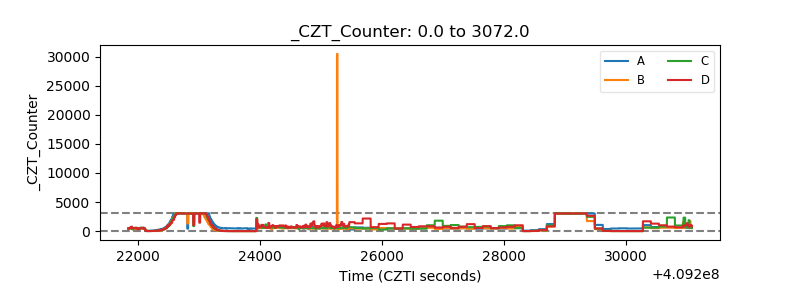 |
| +2.5 Volts monitor |  |
| +5 Volts monitor | 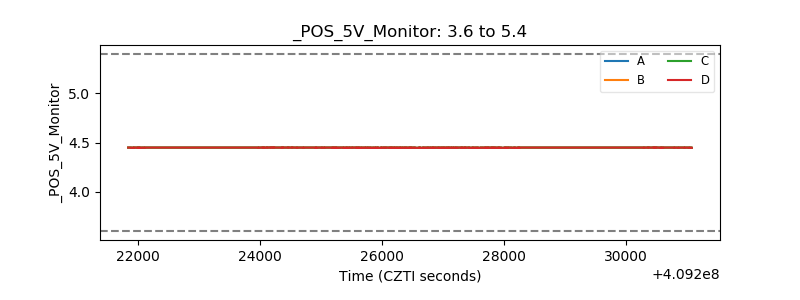 |
| _ROLL_ROT | 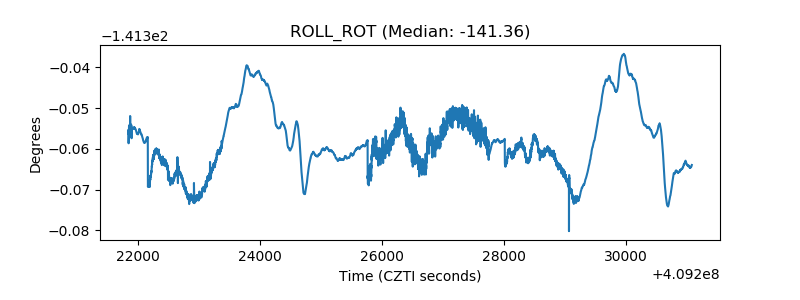 |
| _Roll_DEC | 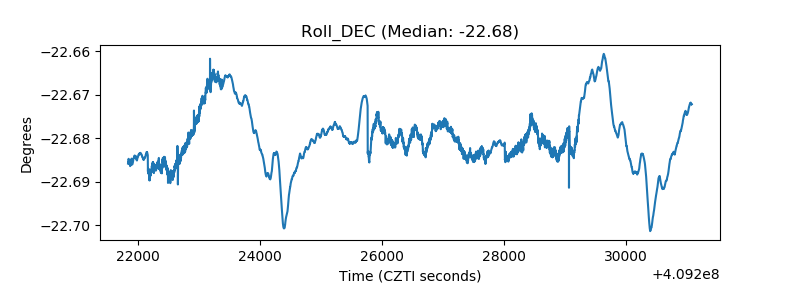 |
| _Roll_RA | 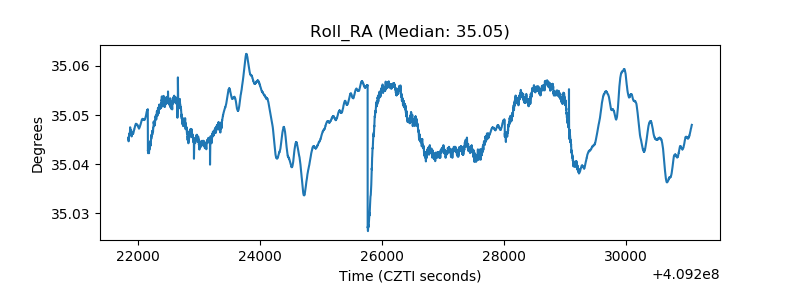 |
| Veto Counter | 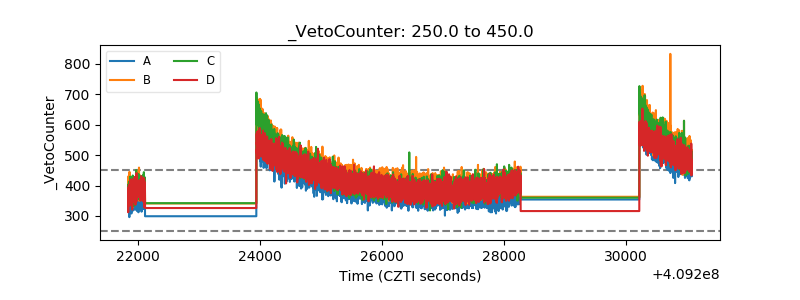 |