| Param | Original file | Final file |
|---|---|---|
| Filename | modeM0/AS1T05_067T01_9000005432_39084cztM0_level2.fits | modeM0/AS1T05_067T01_9000005432_39084cztM0_level2_quad_clean.evt |
| Size (bytes) | 390,680,640 | 96,042,240 |
| Size | 372.6 MB | 91.6 MB |
| Events in quadrant A | 2,898,536 | 670,655 |
| Events in quadrant B | 2,808,122 | 684,751 |
| Events in quadrant C | 4,345,591 | 611,199 |
| Events in quadrant D | 4,021,526 | 591,517 |
| Mode M0 | |||
|---|---|---|---|
| Quadrant | BADHDUFLAG | Total packets | Discarded packets |
| A | 0 | 11723 | 2 |
| B | 0 | 11289 | 1 |
| C | 0 | 16274 | 1 |
| D | 0 | 15632 | 1 |
| Mode SS | |||
|---|---|---|---|
| Quadrant | BADHDUFLAG | Total packets | Discarded packets |
| A | 0 | 102 | 0 |
| B | 0 | 102 | 0 |
| C | 0 | 102 | 0 |
| D | 0 | 102 | 0 |
| Mode M9 | |||
|---|---|---|---|
| Quadrant | BADHDUFLAG | Total packets | Discarded packets |
| A | 0 | 36 | 0 |
| B | 0 | 36 | 0 |
| C | 0 | 36 | 0 |
| D | 0 | 37 | 0 |
| Quadrant | Total seconds | Saturated seconds | Saturation percentage |
|---|---|---|---|
| A | 4997 | 22 | 0.440264% |
| B | 4997 | 41 | 0.820492% |
| C | 4997 | 277 | 5.543326% |
| D | 4997 | 33 | 0.660396% |
Noise dominated data is calculated using 1-second bins in cleaned event files. If a bin has >2000 counts, and if more than 50% of those come from <1% of pixels, then it is considered to be noise-dominated and hence unusable.
| Quadrant | # 1 sec bins | Bins with >0 counts | Bins with >2000 counts | High rate bins dominated by noise | Noise dominated (total time) | Noise dominated (detector-on time) | Marked lightcurve |
|---|---|---|---|---|---|---|---|
| A | 7060 | 4998 | 6 | 6 | 0.08% | 0.12% | 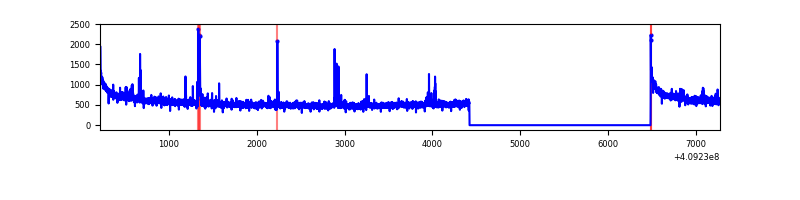 |
| B | 7060 | 4998 | 12 | 12 | 0.17% | 0.24% | 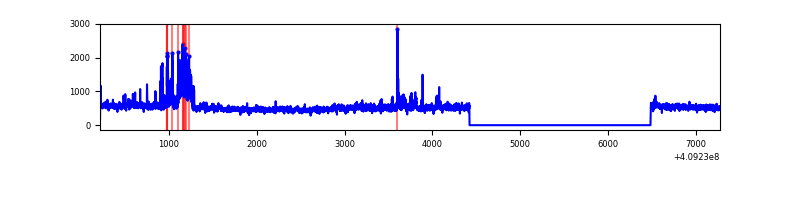 |
| C | 7060 | 4998 | 276 | 276 | 3.91% | 5.52% | 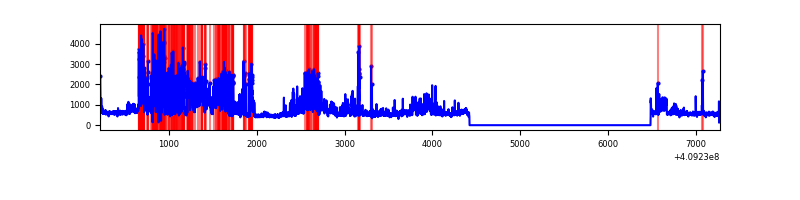 |
| D | 7060 | 4998 | 29 | 29 | 0.41% | 0.58% | 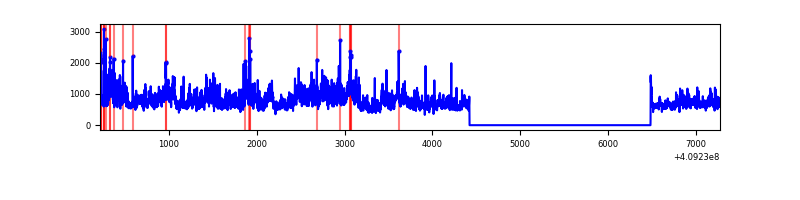 |
Top three noisy pixels from each quadrant. If the there are fewer than three noisy pixels in the level2.evt file, extra rows are filled as -1
| Pixel properties | Quadrant properties | ||||||
|---|---|---|---|---|---|---|---|
| Quadrant | DetID | PixID | Counts | Sigma | Mean | Median | Sigma |
| A | 10 | 83 | 397437 | 3187.8 | 620 | 610 | 124.5 |
| A | 13 | 248 | 43505 | 344.58 | 620 | 610 | 124.5 |
| A | 7 | 3 | 35435 | 279.75 | 620 | 610 | 124.5 |
| B | 5 | 184 | 251805 | 2133.12 | 613 | 598 | 117.8 |
| B | 0 | 230 | 60299 | 506.95 | 613 | 598 | 117.8 |
| B | 0 | 190 | 50853 | 426.74 | 613 | 598 | 117.8 |
| C | 15 | 208 | 1837235 | 13826.32 | 576 | 581 | 132.8 |
| C | 15 | 214 | 209729 | 1574.46 | 576 | 581 | 132.8 |
| C | 10 | 20 | 30914 | 228.35 | 576 | 581 | 132.8 |
| D | 12 | 235 | 1386059 | 9533.72 | 593 | 578 | 145.3 |
| D | 2 | 249 | 128447 | 879.89 | 593 | 578 | 145.3 |
| D | 12 | 227 | 84109 | 574.79 | 593 | 578 | 145.3 |
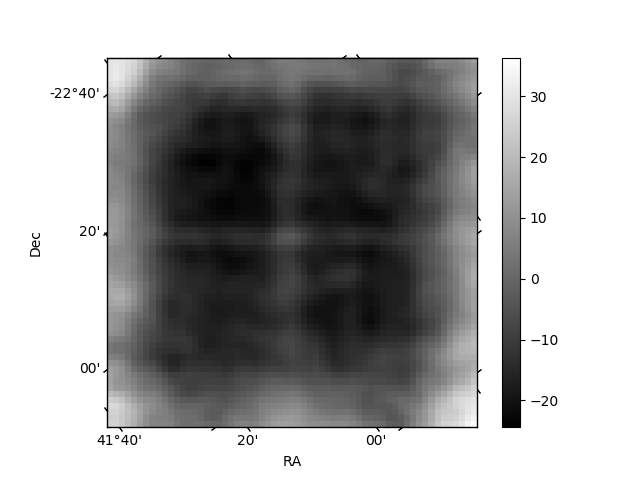
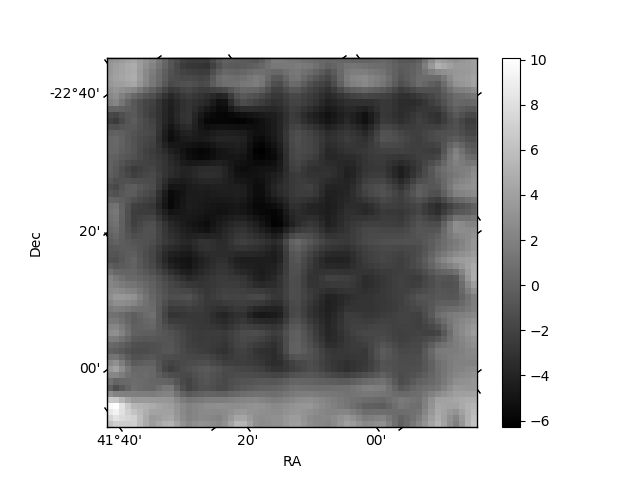
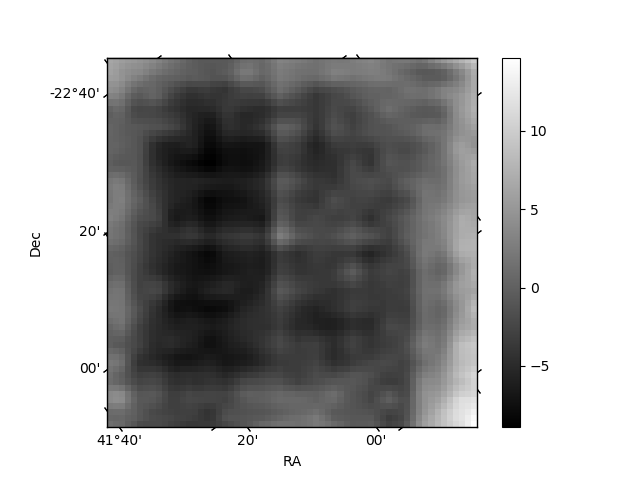
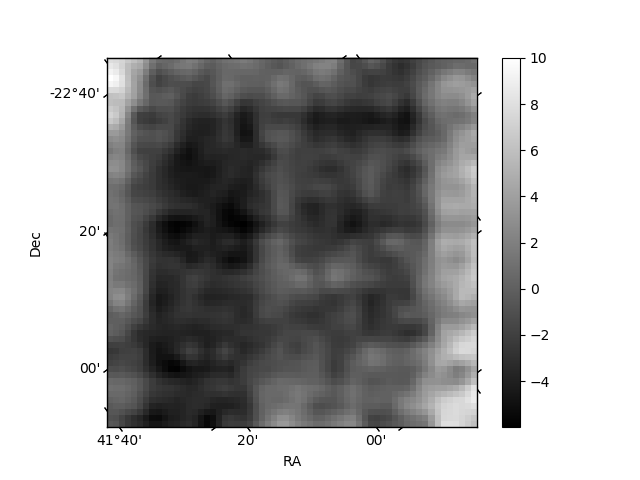
Histogram calculated using DETX and DETY for each event in the final _common_clean file
| Quadrant A | 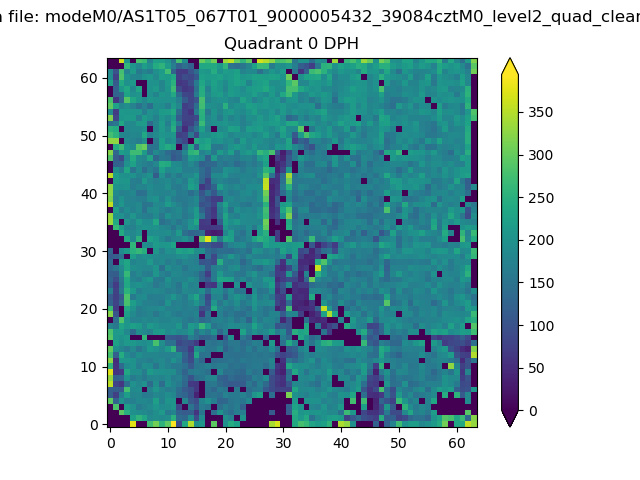 |
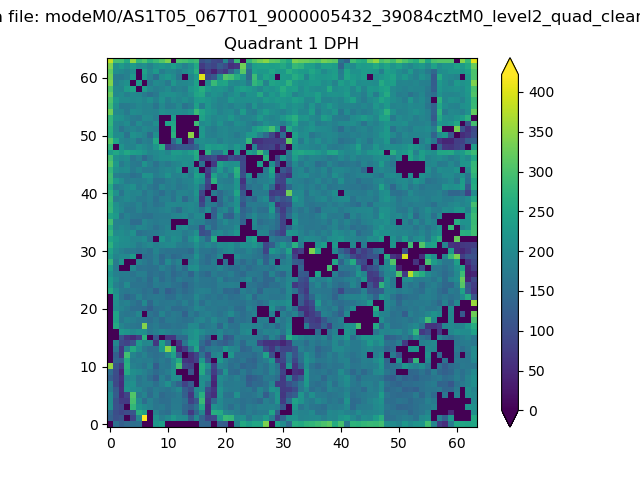 |
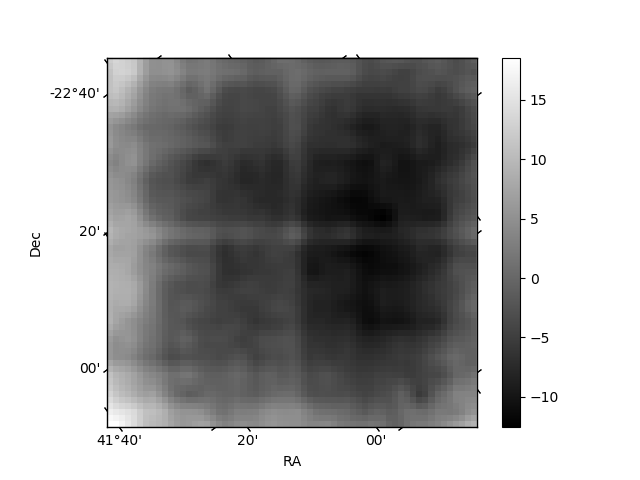
Quadrant B |
|---|---|---|---|
| Quadrant D | 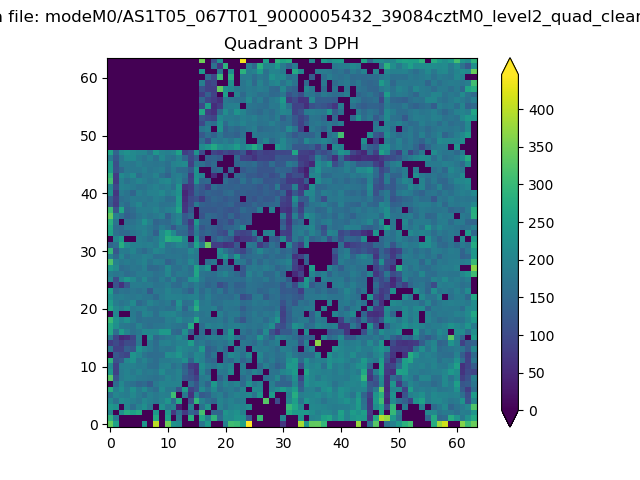 |
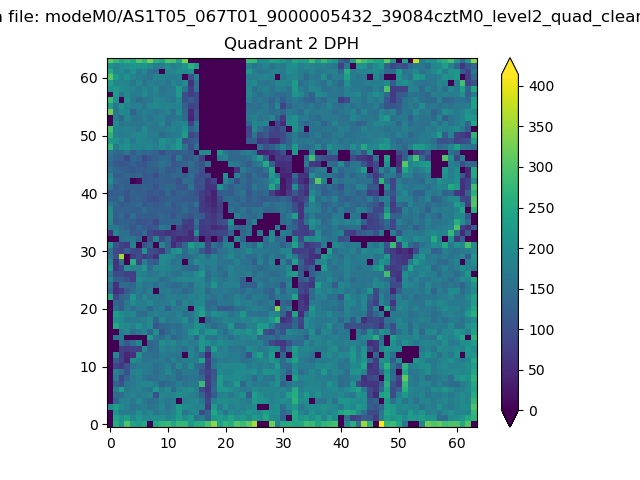 |
Quadrant C |
| Plot type | Count rate plots | Images |
|---|---|---|
| Comparison with Poisson distribution Blue bars denote a histogram of data divided into 1 sec bins. Red curve is a Poisson curve with rate = median count rate of data. |
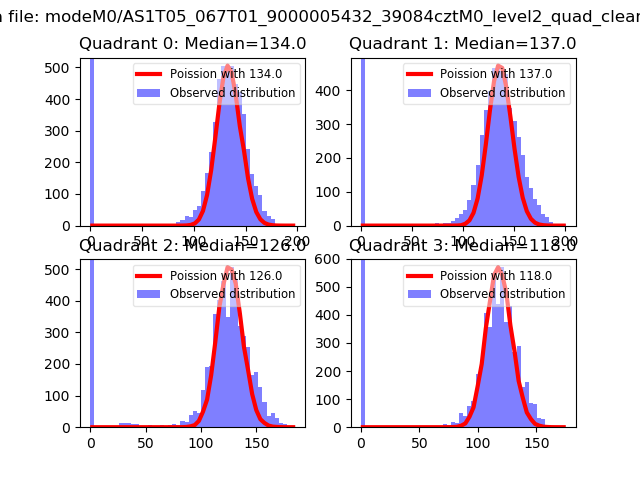 |
 |
| Quadrant-wise count rates Data is divided into 100 sec bins |
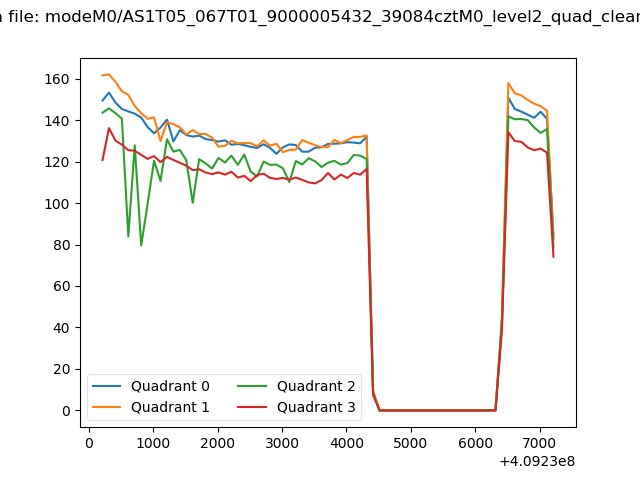 |
|
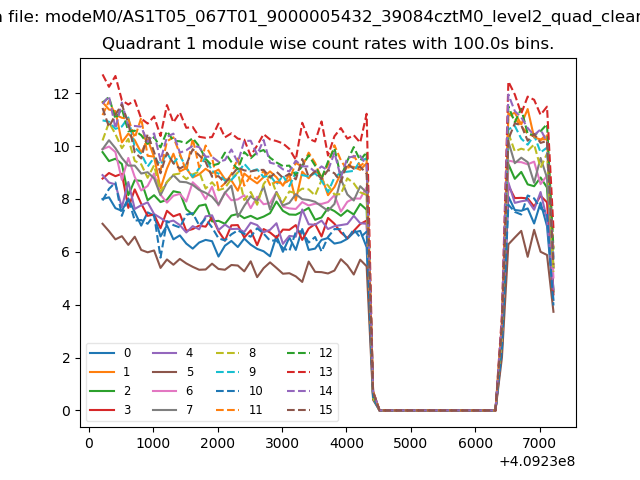
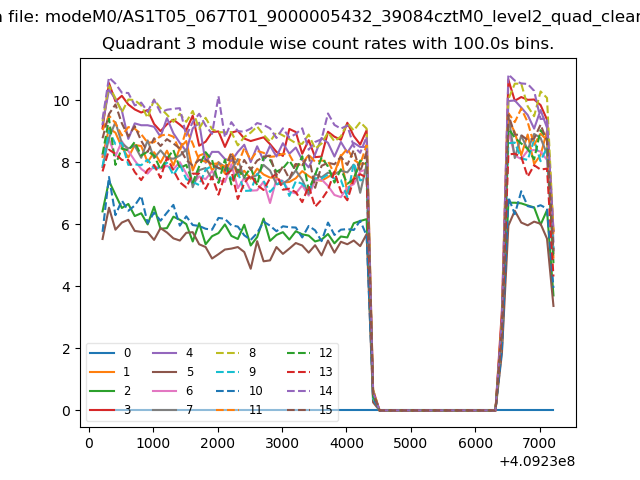
| Module-wise count rates for Quadrant A Data is divided into 100 sec bins |
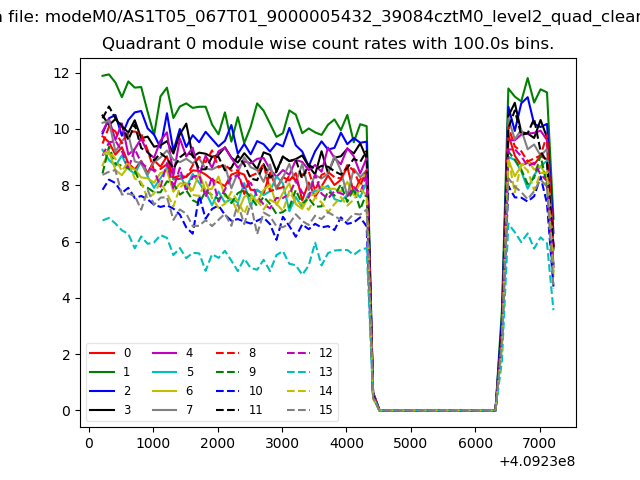 |
 |
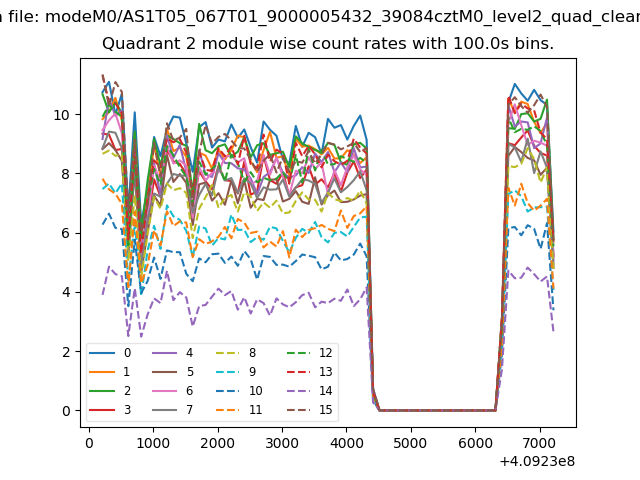
| Module-wise count rates for Quadrant B Data is divided into 100 sec bins |
 |
 |
| Module-wise count rates for Quadrant C Data is divided into 100 sec bins |
 |
 |
| Module-wise count rates for Quadrant D Data is divided into 100 sec bins |
 |
 |
| Parameter | Plot |
|---|---|
| CZT HV Monitor |  |
| D_VDD | 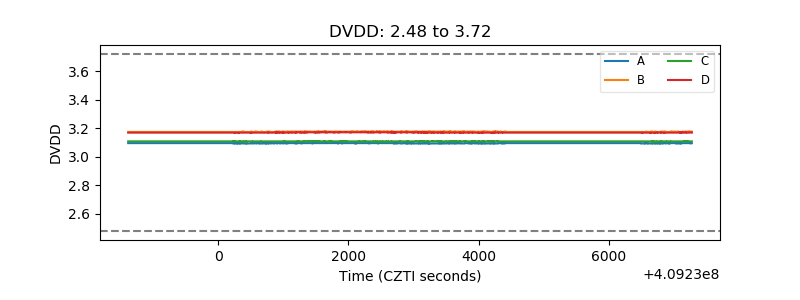 |
| Temperature 1 | 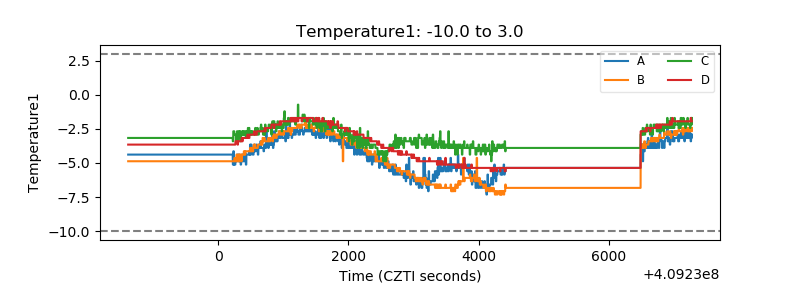 |
| Veto HV Monitor | 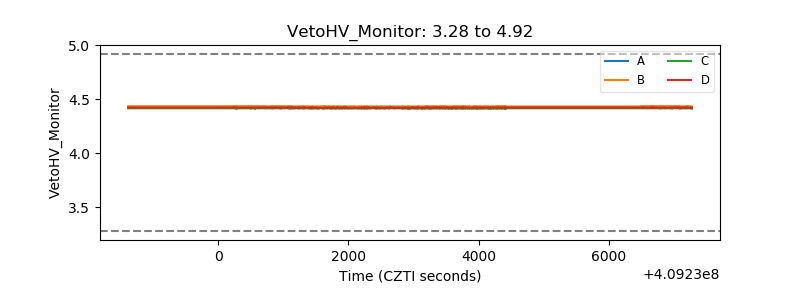 |
| Veto LLD | 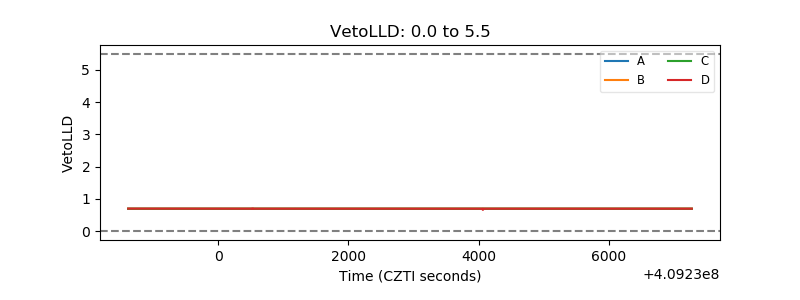 |
| Alpha Counter | 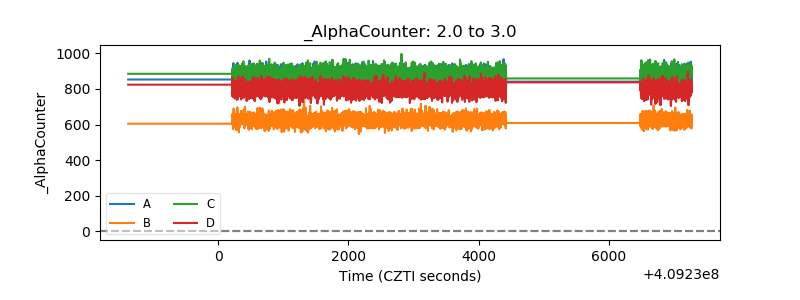 |
| _CPM_Rate | 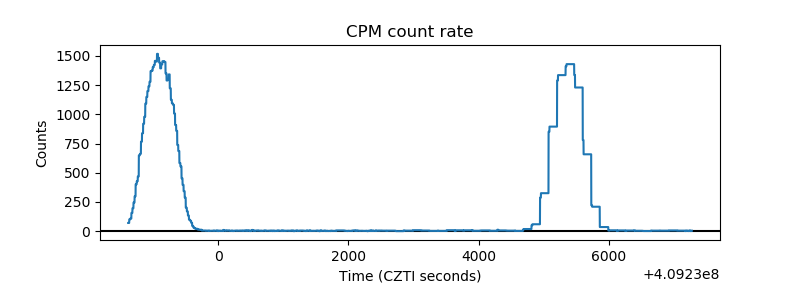 |
| CZT Counter | 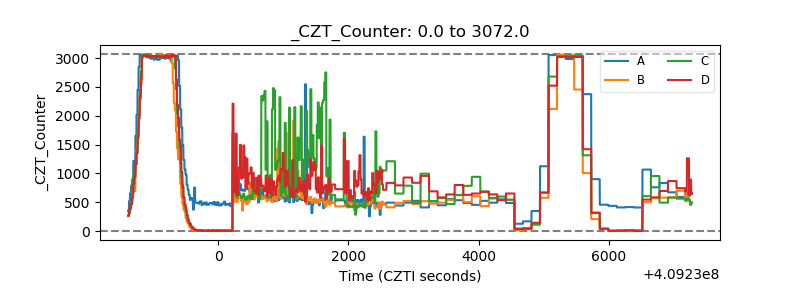 |
| +2.5 Volts monitor | 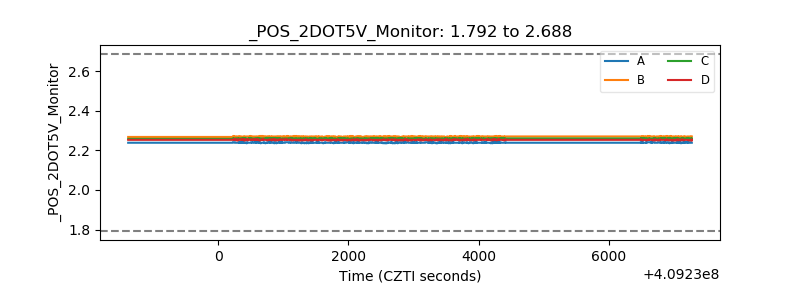 |
| +5 Volts monitor | 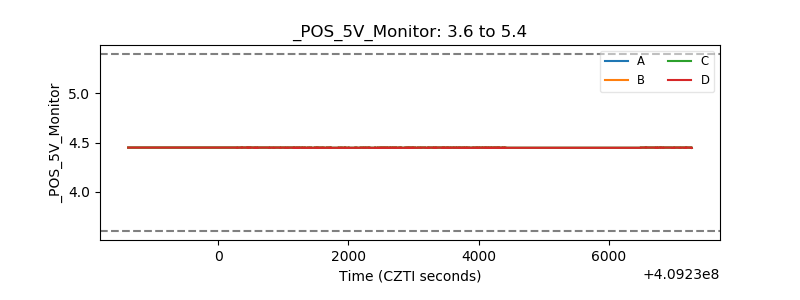 |
| _ROLL_ROT | 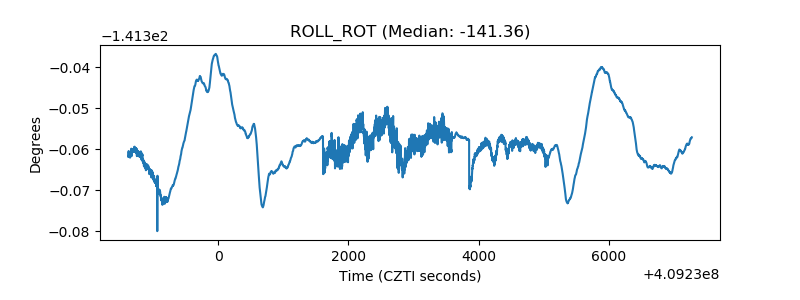 |
| _Roll_DEC | 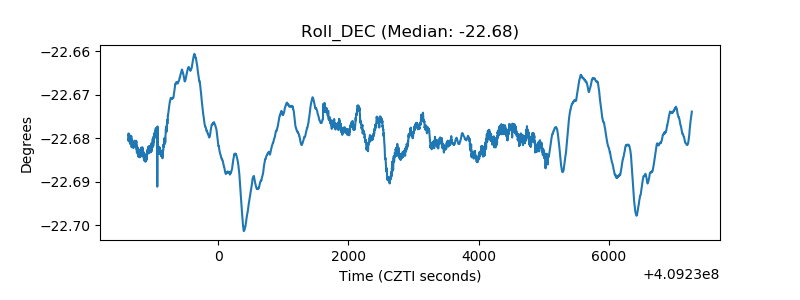 |
| _Roll_RA | 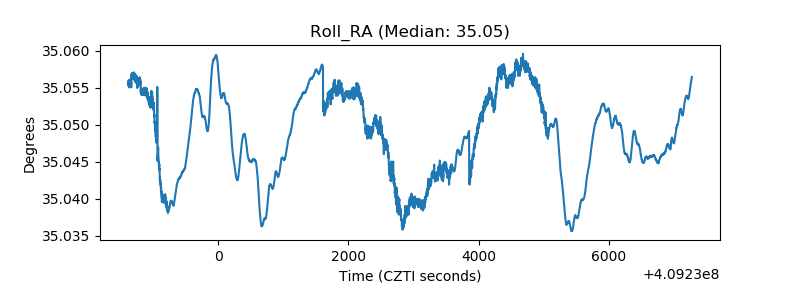 |
| Veto Counter | 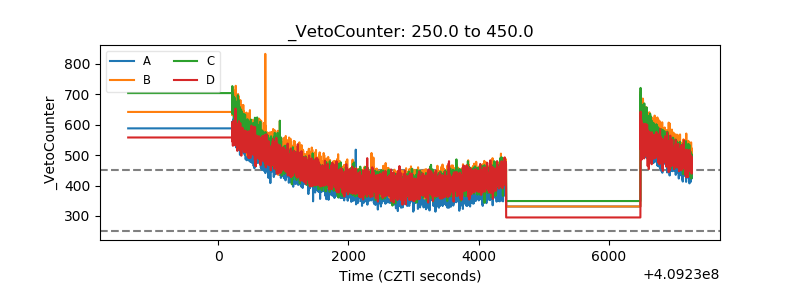 |