| Param | Original file | Final file |
|---|---|---|
| Filename | modeM0/AS1T05_067T01_9000005432_39085cztM0_level2.fits | modeM0/AS1T05_067T01_9000005432_39085cztM0_level2_quad_clean.evt |
| Size (bytes) | 317,828,160 | 98,389,440 |
| Size | 303.1 MB | 93.8 MB |
| Events in quadrant A | 2,981,227 | 681,188 |
| Events in quadrant B | 2,573,285 | 694,097 |
| Events in quadrant C | 2,709,738 | 640,070 |
| Events in quadrant D | 3,098,529 | 602,252 |
| Mode M0 | |||
|---|---|---|---|
| Quadrant | BADHDUFLAG | Total packets | Discarded packets |
| A | 0 | 12045 | 3 |
| B | 0 | 10836 | 2 |
| C | 0 | 11068 | 2 |
| D | 0 | 12774 | 2 |
| Mode SS | |||
|---|---|---|---|
| Quadrant | BADHDUFLAG | Total packets | Discarded packets |
| A | 0 | 106 | 0 |
| B | 0 | 106 | 0 |
| C | 0 | 106 | 0 |
| D | 0 | 106 | 0 |
| Mode M9 | |||
|---|---|---|---|
| Quadrant | BADHDUFLAG | Total packets | Discarded packets |
| A | 0 | 25 | 0 |
| B | 0 | 25 | 0 |
| C | 0 | 25 | 0 |
| D | 0 | 26 | 0 |
| Quadrant | Total seconds | Saturated seconds | Saturation percentage |
|---|---|---|---|
| A | 5163 | 17 | 0.329266% |
| B | 5163 | 8 | 0.154949% |
| C | 5163 | 11 | 0.213054% |
| D | 5163 | 19 | 0.368003% |
Noise dominated data is calculated using 1-second bins in cleaned event files. If a bin has >2000 counts, and if more than 50% of those come from <1% of pixels, then it is considered to be noise-dominated and hence unusable.
| Quadrant | # 1 sec bins | Bins with >0 counts | Bins with >2000 counts | High rate bins dominated by noise | Noise dominated (total time) | Noise dominated (detector-on time) | Marked lightcurve |
|---|---|---|---|---|---|---|---|
| A | 7286 | 5164 | 10 | 10 | 0.14% | 0.19% | 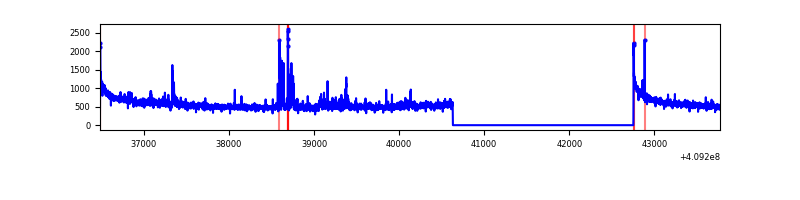 |
| B | 7286 | 5164 | 1 | 1 | 0.01% | 0.02% | 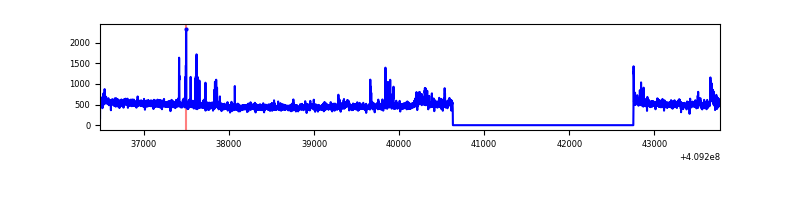 |
| C | 7286 | 5164 | 5 | 5 | 0.07% | 0.10% | 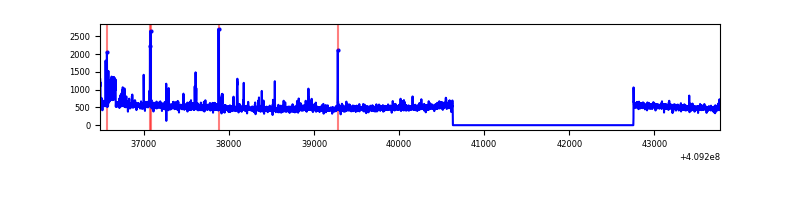 |
| D | 7286 | 5164 | 11 | 11 | 0.15% | 0.21% | 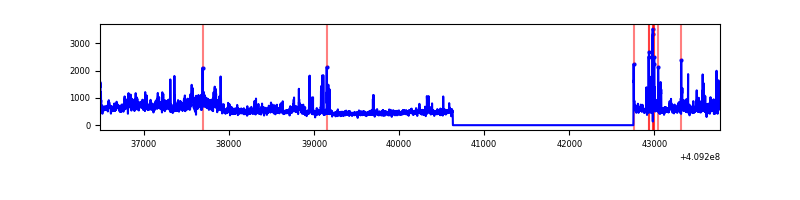 |
Top three noisy pixels from each quadrant. If the there are fewer than three noisy pixels in the level2.evt file, extra rows are filled as -1
| Pixel properties | Quadrant properties | ||||||
|---|---|---|---|---|---|---|---|
| Quadrant | DetID | PixID | Counts | Sigma | Mean | Median | Sigma |
| A | 10 | 83 | 409230 | 3275.4 | 624 | 615 | 124.8 |
| A | 12 | 16 | 58938 | 467.51 | 624 | 615 | 124.8 |
| A | 13 | 248 | 46780 | 370.05 | 624 | 615 | 124.8 |
| B | 5 | 184 | 116083 | 982.33 | 618 | 603 | 117.6 |
| B | 12 | 111 | 14614 | 119.18 | 618 | 603 | 117.6 |
| B | 11 | 111 | 13244 | 107.53 | 618 | 603 | 117.6 |
| C | 15 | 214 | 217804 | 1592.39 | 591 | 595 | 136.4 |
| C | 15 | 208 | 179887 | 1314.42 | 591 | 595 | 136.4 |
| C | 0 | 10 | 6920 | 46.37 | 591 | 595 | 136.4 |
| D | 12 | 235 | 528460 | 3633.8 | 596 | 580 | 145.3 |
| D | 2 | 249 | 96961 | 663.46 | 596 | 580 | 145.3 |
| D | 12 | 233 | 75574 | 516.24 | 596 | 580 | 145.3 |
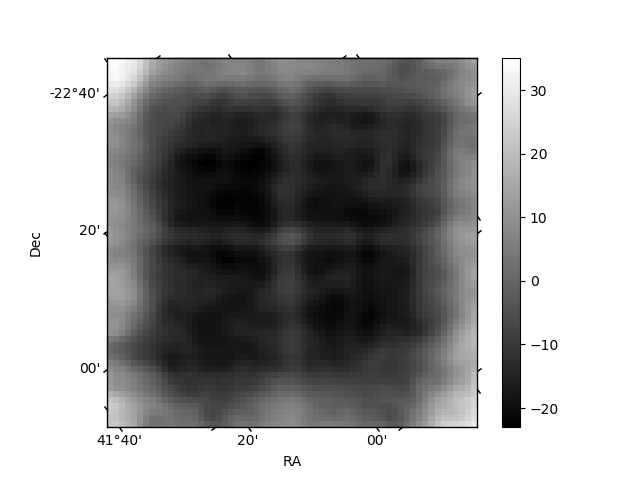
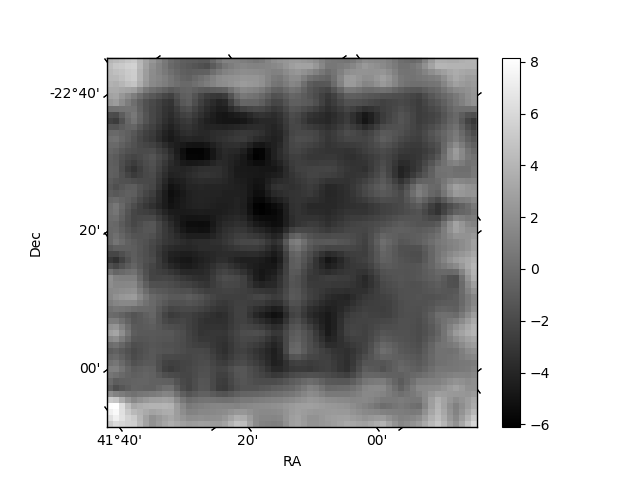
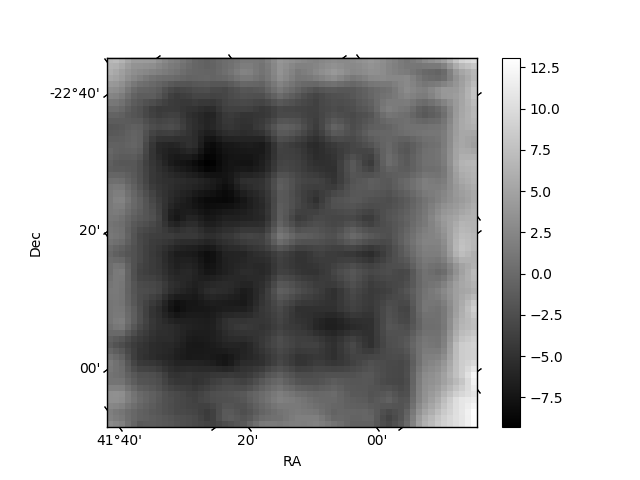
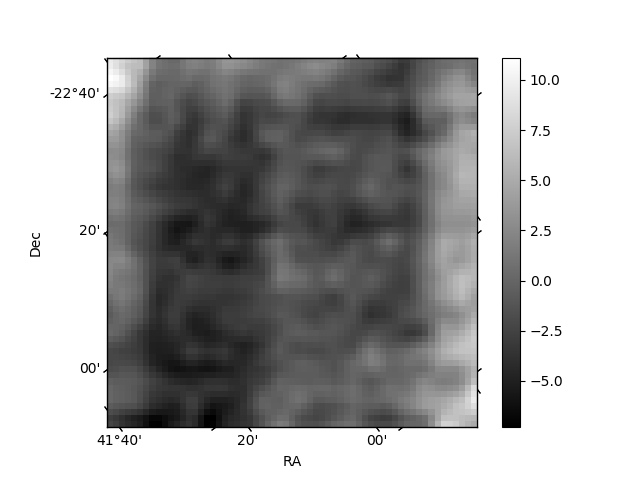
Histogram calculated using DETX and DETY for each event in the final _common_clean file
| Quadrant A | 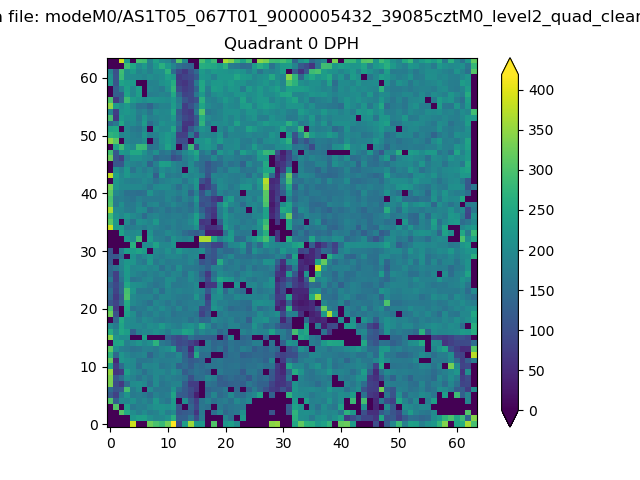 |
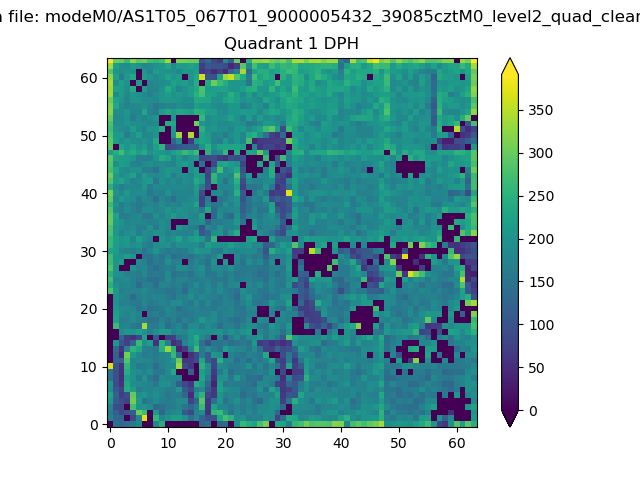 |
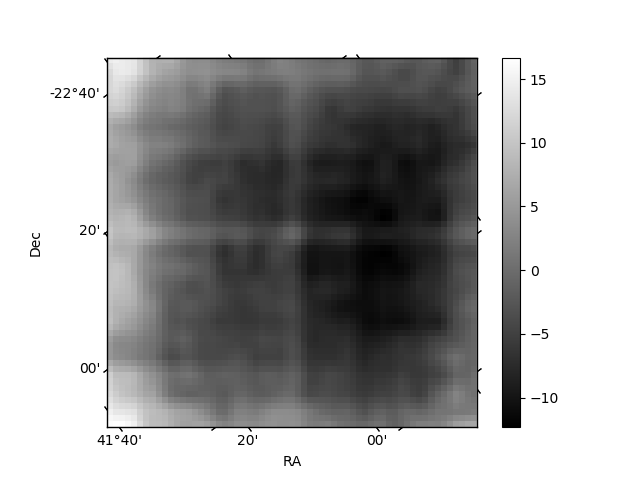
Quadrant B |
|---|---|---|---|
| Quadrant D | 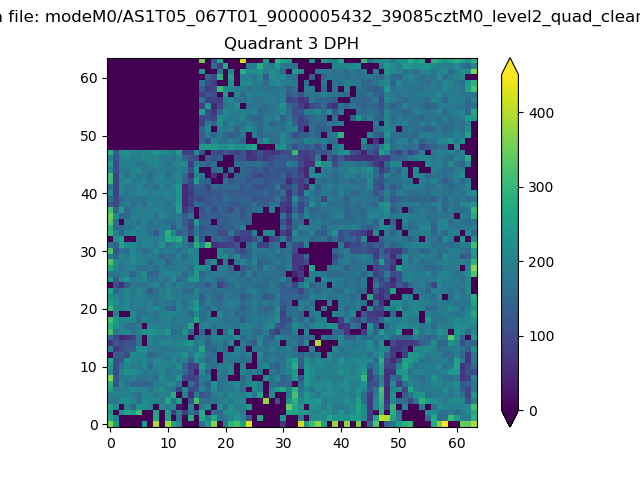 |
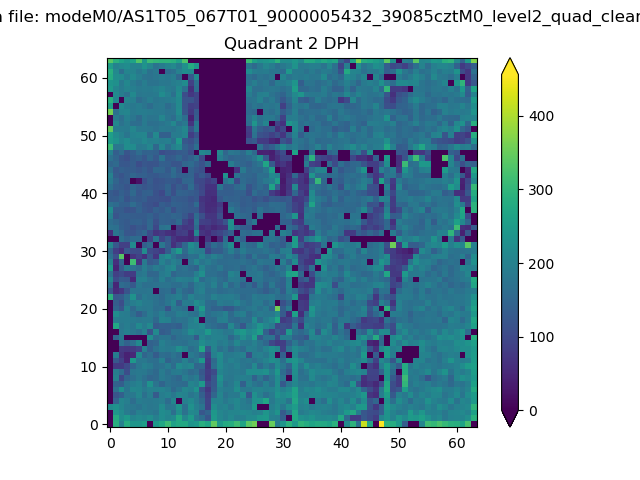 |
Quadrant C |
| Plot type | Count rate plots | Images |
|---|---|---|
| Comparison with Poisson distribution Blue bars denote a histogram of data divided into 1 sec bins. Red curve is a Poisson curve with rate = median count rate of data. |
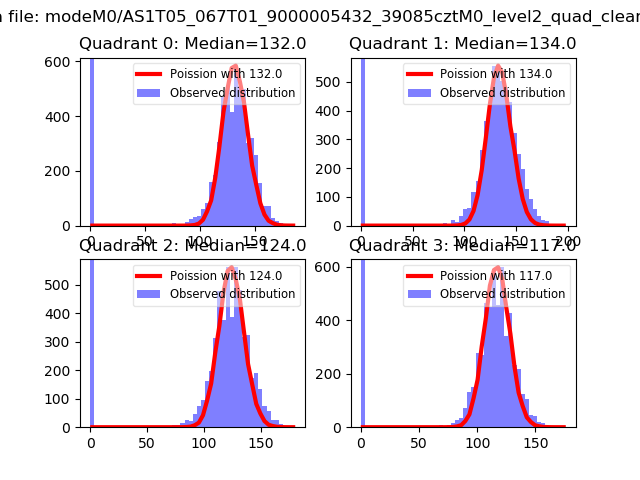 |
 |
| Quadrant-wise count rates Data is divided into 100 sec bins |
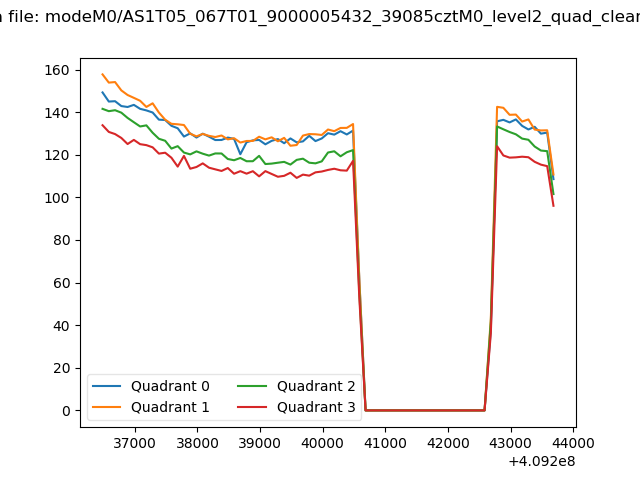 |
|
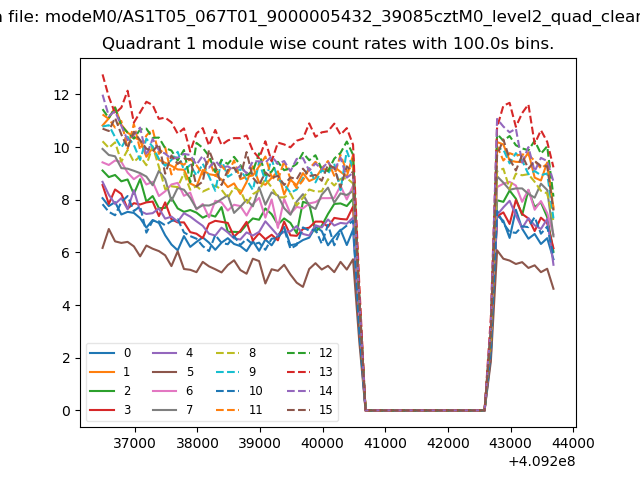
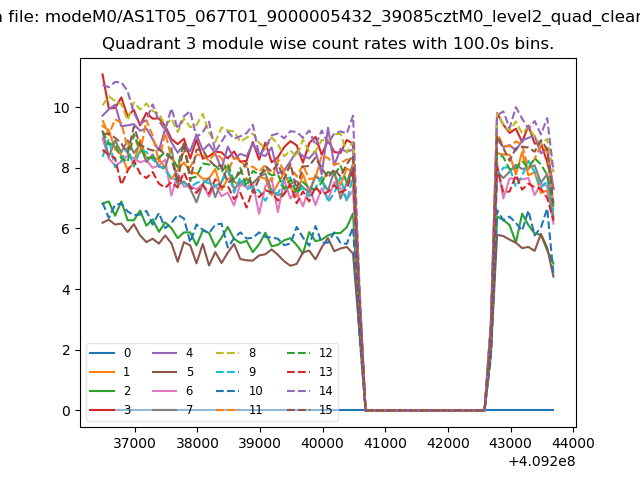
| Module-wise count rates for Quadrant A Data is divided into 100 sec bins |
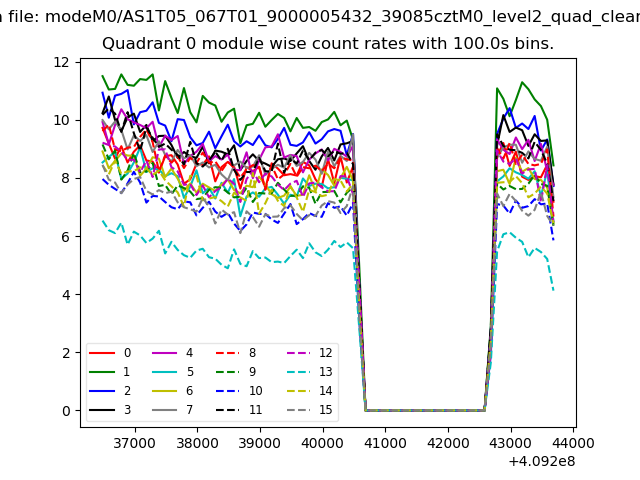 |
 |
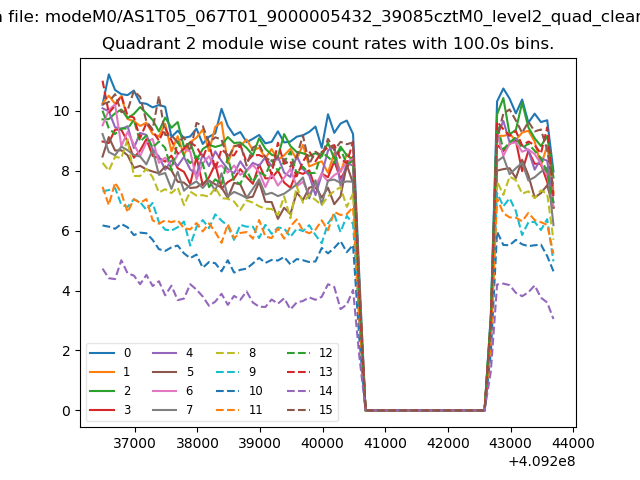
| Module-wise count rates for Quadrant B Data is divided into 100 sec bins |
 |
 |
| Module-wise count rates for Quadrant C Data is divided into 100 sec bins |
 |
 |
| Module-wise count rates for Quadrant D Data is divided into 100 sec bins |
 |
 |
| Parameter | Plot |
|---|---|
| CZT HV Monitor | 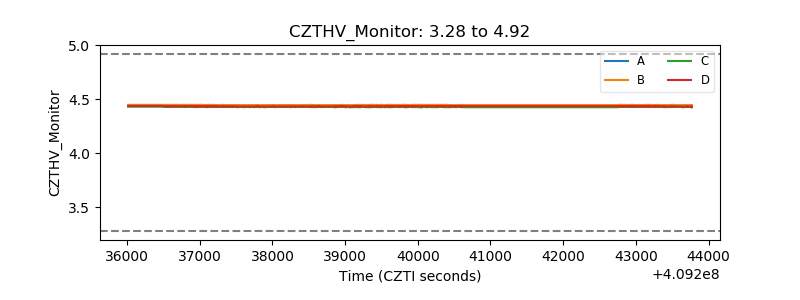 |
| D_VDD | 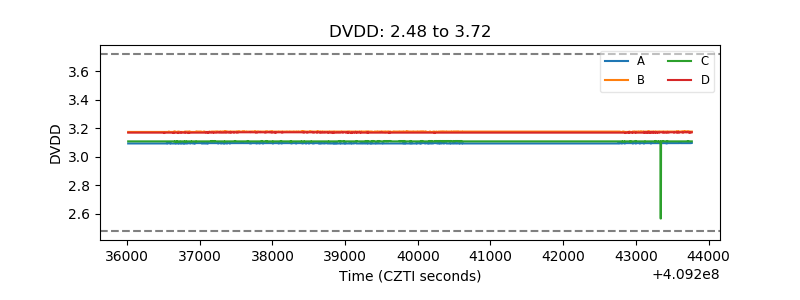 |
| Temperature 1 | 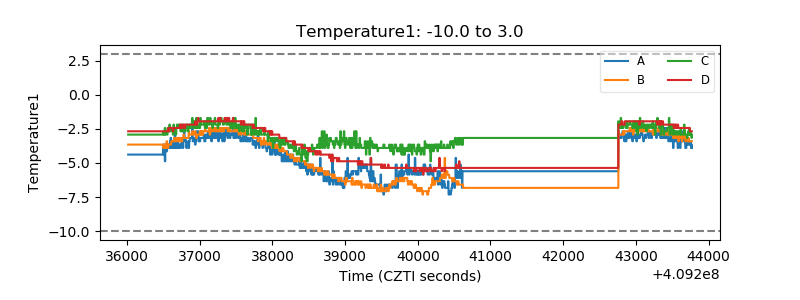 |
| Veto HV Monitor | 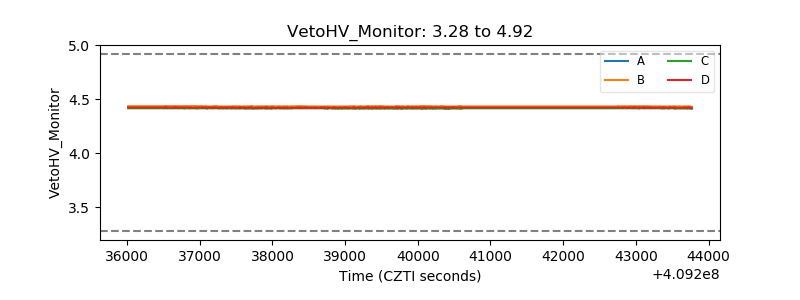 |
| Veto LLD | 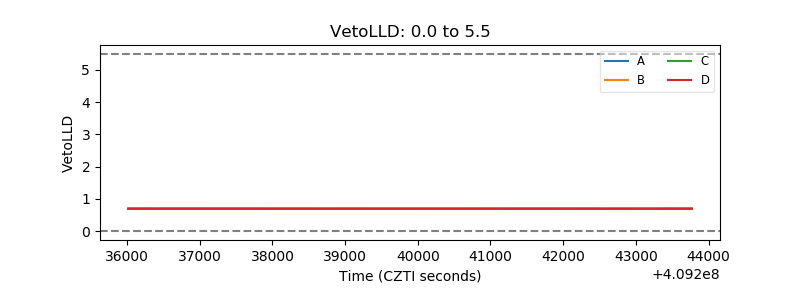 |
| Alpha Counter | 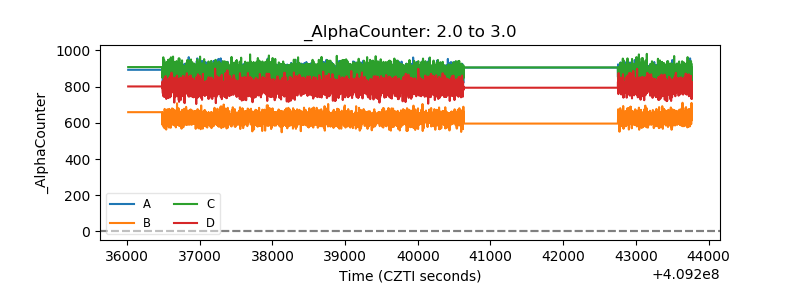 |
| _CPM_Rate | 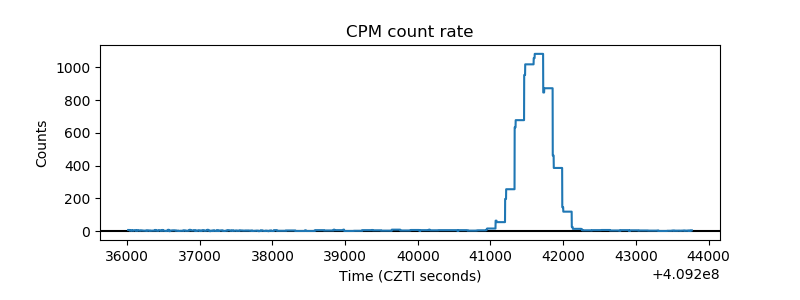 |
| CZT Counter | 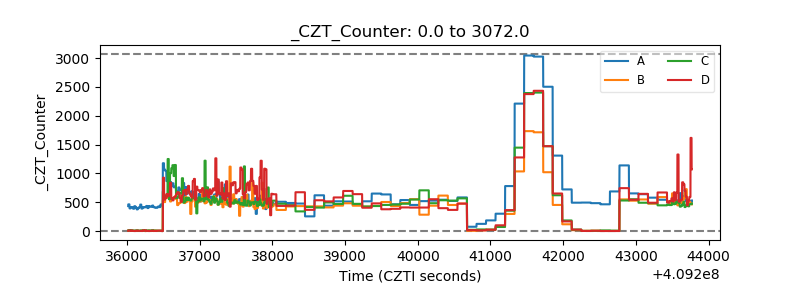 |
| +2.5 Volts monitor | 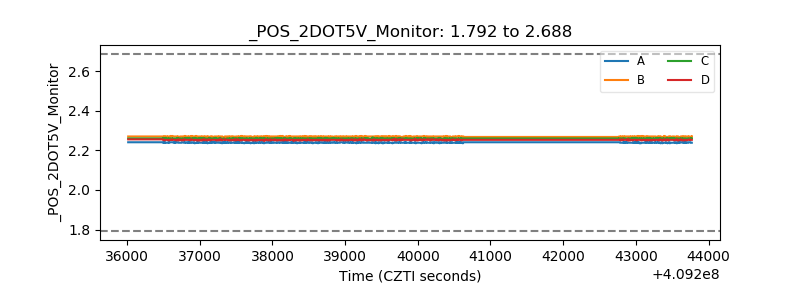 |
| +5 Volts monitor | 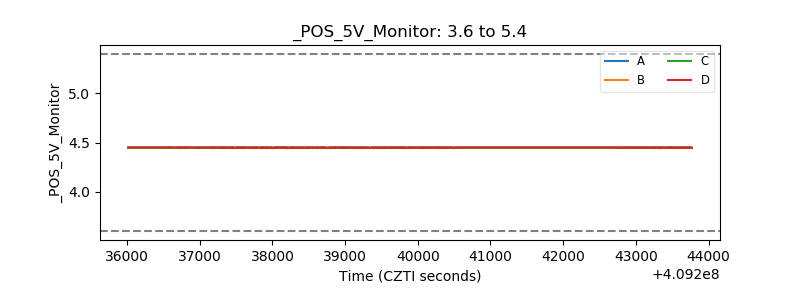 |
| _ROLL_ROT |  |
| _Roll_DEC | 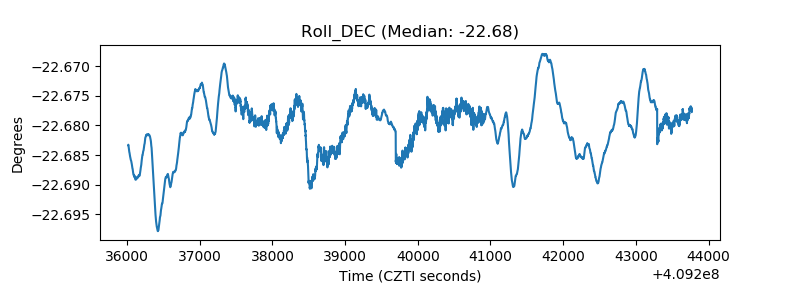 |
| _Roll_RA | 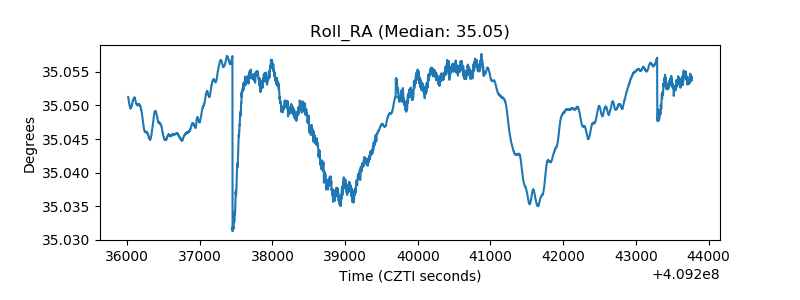 |
| Veto Counter | 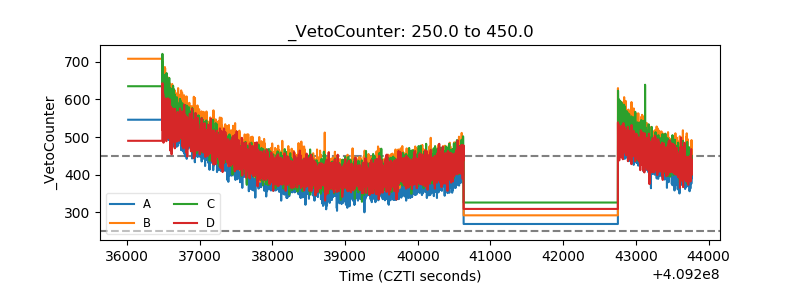 |