| Param | Original file | Final file |
|---|---|---|
| Filename | modeM0/AS1T05_067T01_9000005432_39086cztM0_level2.fits | modeM0/AS1T05_067T01_9000005432_39086cztM0_level2_quad_clean.evt |
| Size (bytes) | 350,236,800 | 93,188,160 |
| Size | 334.0 MB | 88.9 MB |
| Events in quadrant A | 2,758,015 | 650,991 |
| Events in quadrant B | 2,868,499 | 642,252 |
| Events in quadrant C | 3,302,184 | 608,696 |
| Events in quadrant D | 3,631,733 | 556,187 |
| Mode M0 | |||
|---|---|---|---|
| Quadrant | BADHDUFLAG | Total packets | Discarded packets |
| A | 0 | 11337 | 3 |
| B | 0 | 11981 | 2 |
| C | 0 | 13057 | 2 |
| D | 0 | 14269 | 2 |
| Mode SS | |||
|---|---|---|---|
| Quadrant | BADHDUFLAG | Total packets | Discarded packets |
| A | 0 | 106 | 0 |
| B | 0 | 106 | 0 |
| C | 0 | 106 | 0 |
| D | 0 | 106 | 0 |
| Mode M9 | |||
|---|---|---|---|
| Quadrant | BADHDUFLAG | Total packets | Discarded packets |
| A | 0 | 22 | 0 |
| B | 0 | 22 | 0 |
| C | 0 | 22 | 0 |
| D | 0 | 22 | 0 |
| Quadrant | Total seconds | Saturated seconds | Saturation percentage |
|---|---|---|---|
| A | 5192 | 12 | 0.231125% |
| B | 5192 | 168 | 3.235747% |
| C | 5192 | 40 | 0.770416% |
| D | 5192 | 205 | 3.948382% |
Noise dominated data is calculated using 1-second bins in cleaned event files. If a bin has >2000 counts, and if more than 50% of those come from <1% of pixels, then it is considered to be noise-dominated and hence unusable.
| Quadrant | # 1 sec bins | Bins with >0 counts | Bins with >2000 counts | High rate bins dominated by noise | Noise dominated (total time) | Noise dominated (detector-on time) | Marked lightcurve |
|---|---|---|---|---|---|---|---|
| A | 7315 | 5193 | 3 | 3 | 0.04% | 0.06% | 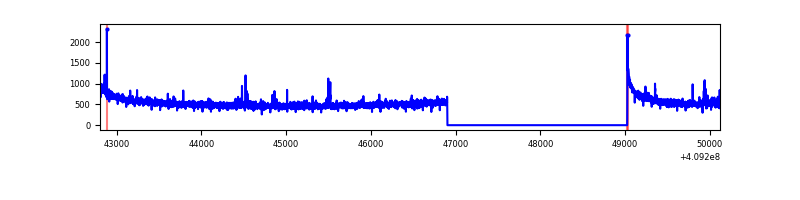 |
| B | 7315 | 5193 | 77 | 77 | 1.05% | 1.48% | 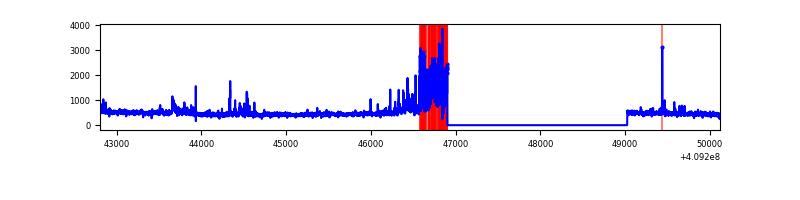 |
| C | 7315 | 5193 | 49 | 49 | 0.67% | 0.94% | 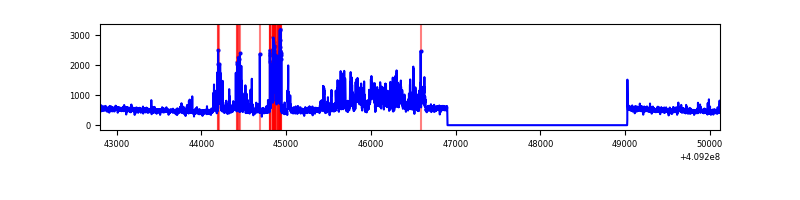 |
| D | 7315 | 5193 | 179 | 179 | 2.45% | 3.45% | 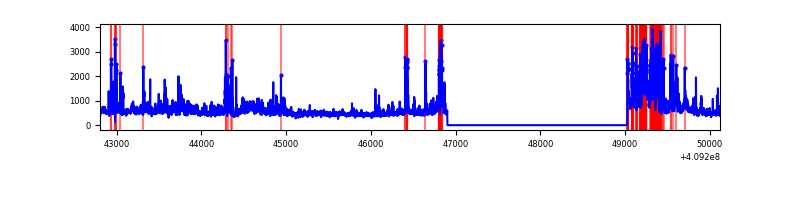 |
Top three noisy pixels from each quadrant. If the there are fewer than three noisy pixels in the level2.evt file, extra rows are filled as -1
| Pixel properties | Quadrant properties | ||||||
|---|---|---|---|---|---|---|---|
| Quadrant | DetID | PixID | Counts | Sigma | Mean | Median | Sigma |
| A | 10 | 83 | 392421 | 3245.32 | 599 | 589 | 120.7 |
| A | 15 | 223 | 25916 | 209.77 | 599 | 589 | 120.7 |
| A | 13 | 248 | 15491 | 123.42 | 599 | 589 | 120.7 |
| B | 5 | 184 | 480243 | 4257.85 | 590 | 576 | 112.7 |
| B | 0 | 190 | 21592 | 186.55 | 590 | 576 | 112.7 |
| B | 5 | 172 | 16062 | 137.46 | 590 | 576 | 112.7 |
| C | 15 | 208 | 861013 | 6513.65 | 569 | 573 | 132.1 |
| C | 15 | 214 | 218891 | 1652.7 | 569 | 573 | 132.1 |
| C | 13 | 61 | 3743 | 24.0 | 569 | 573 | 132.1 |
| D | 12 | 235 | 517486 | 3789.35 | 564 | 548 | 136.4 |
| D | 12 | 233 | 491535 | 3599.12 | 564 | 548 | 136.4 |
| D | 1 | 47 | 128832 | 940.37 | 564 | 548 | 136.4 |
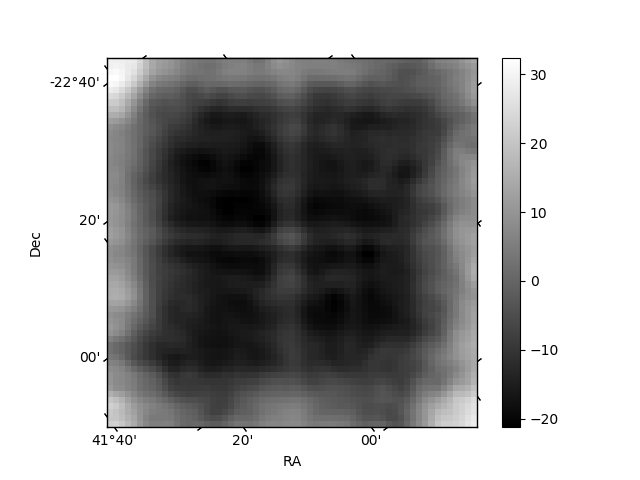
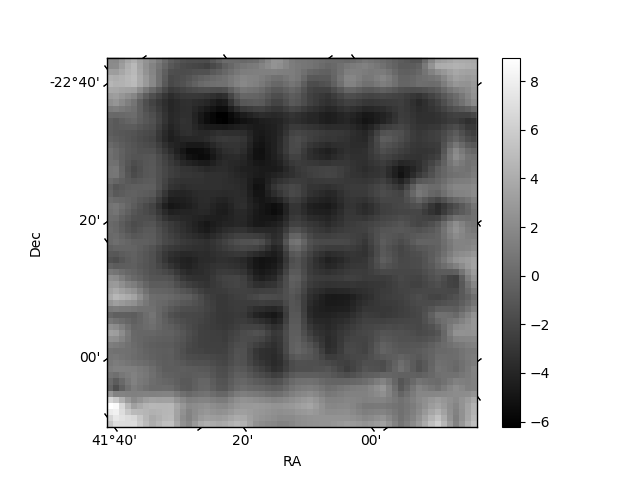
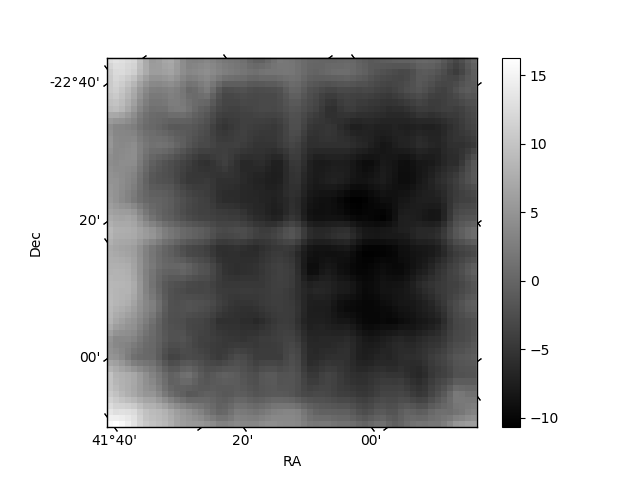
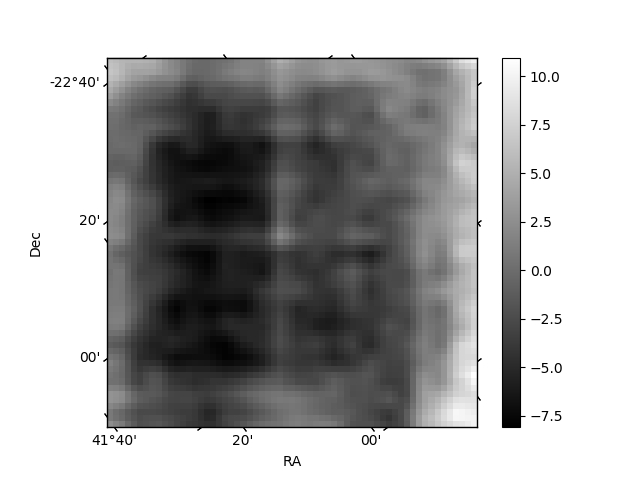
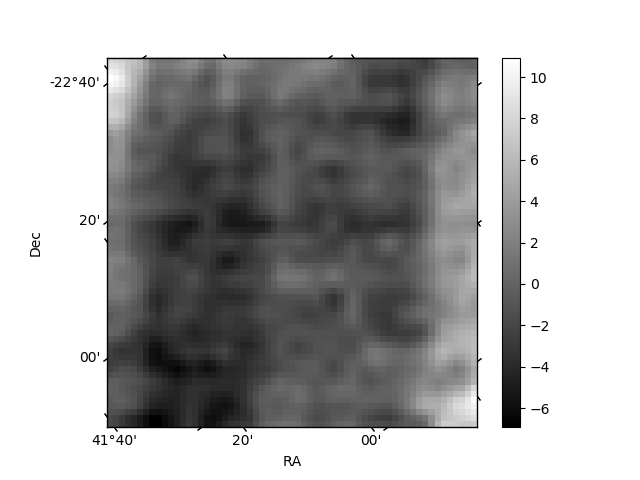
Histogram calculated using DETX and DETY for each event in the final _common_clean file
| Quadrant A |  |
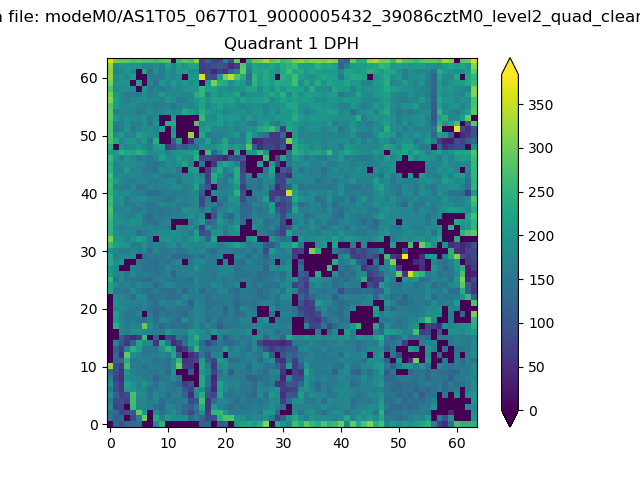 |
Quadrant B |
|---|---|---|---|
| Quadrant D | 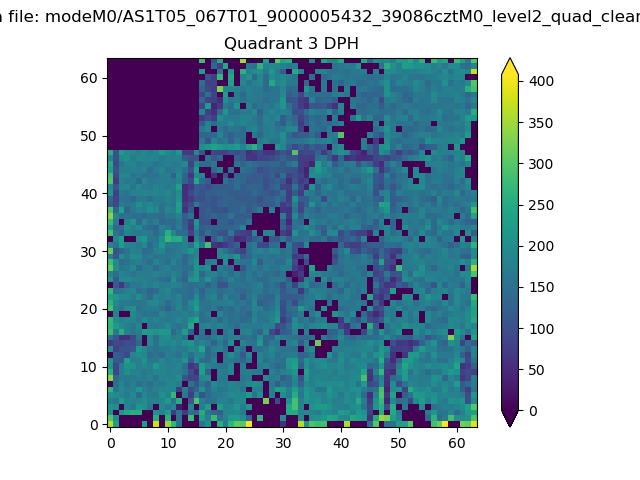 |
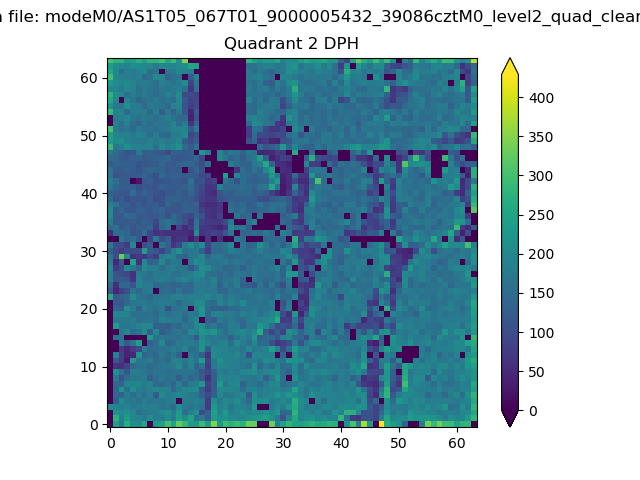 |
Quadrant C |
| Plot type | Count rate plots | Images |
|---|---|---|
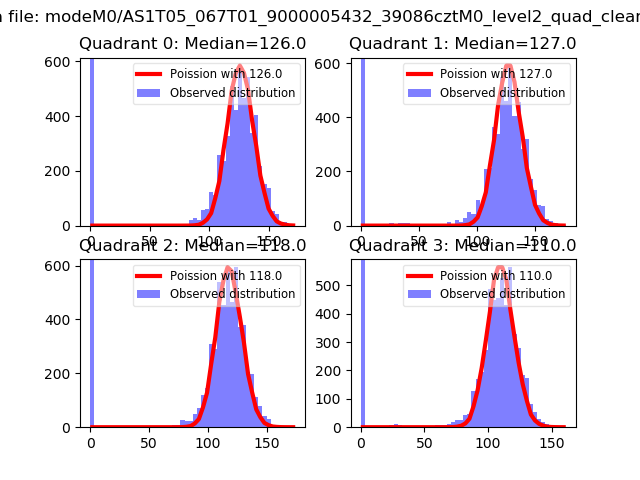
| Comparison with Poisson distribution Blue bars denote a histogram of data divided into 1 sec bins. Red curve is a Poisson curve with rate = median count rate of data. |
 |
 |
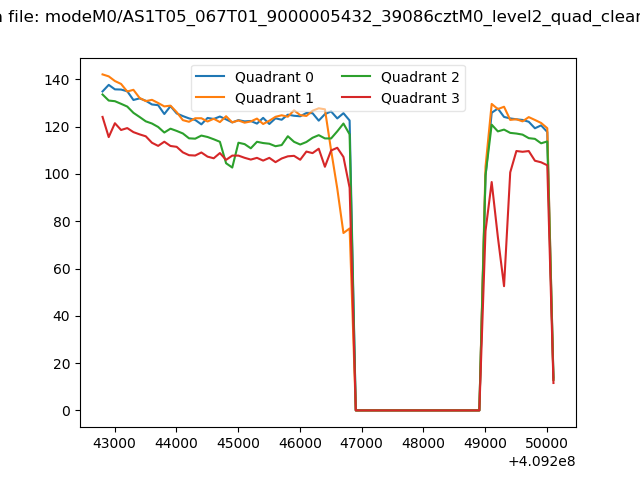
| Quadrant-wise count rates Data is divided into 100 sec bins |
 |
|
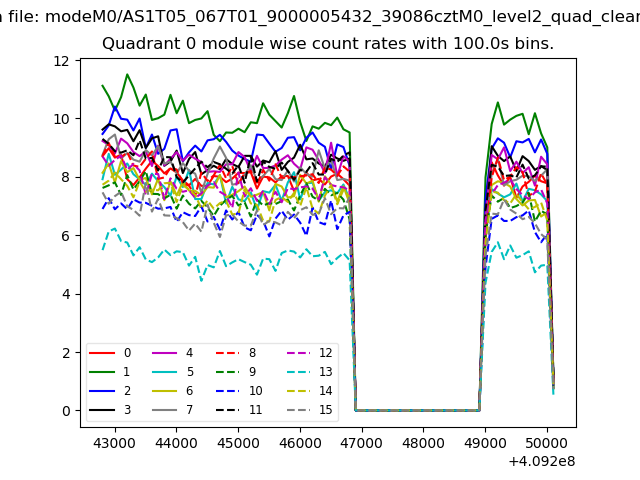
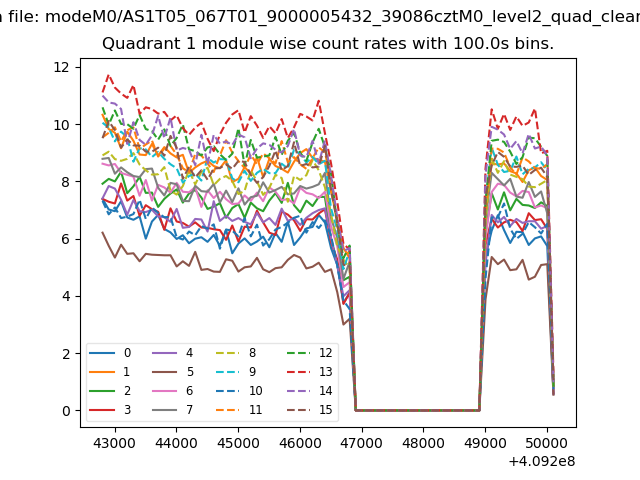
| Module-wise count rates for Quadrant A Data is divided into 100 sec bins |
 |
 |
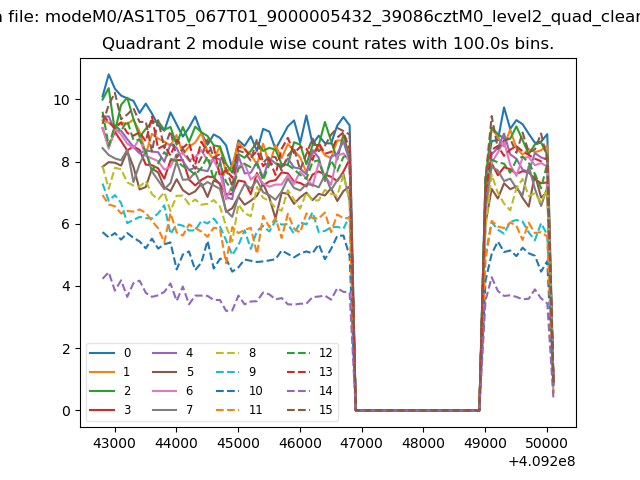
| Module-wise count rates for Quadrant B Data is divided into 100 sec bins |
 |
 |
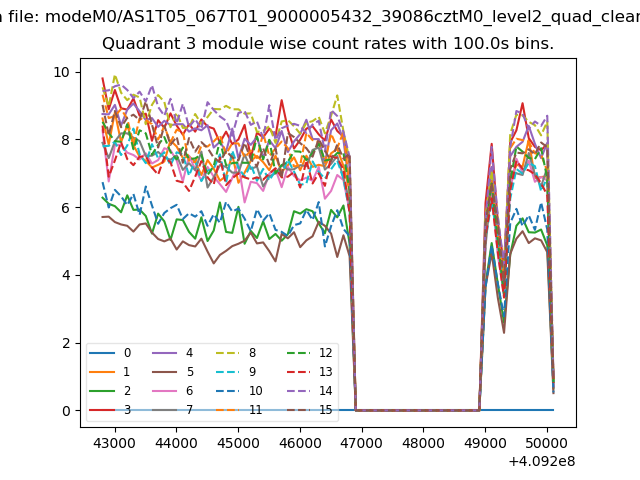
| Module-wise count rates for Quadrant C Data is divided into 100 sec bins |
 |
 |
| Module-wise count rates for Quadrant D Data is divided into 100 sec bins |
 |
 |
| Parameter | Plot |
|---|---|
| CZT HV Monitor | 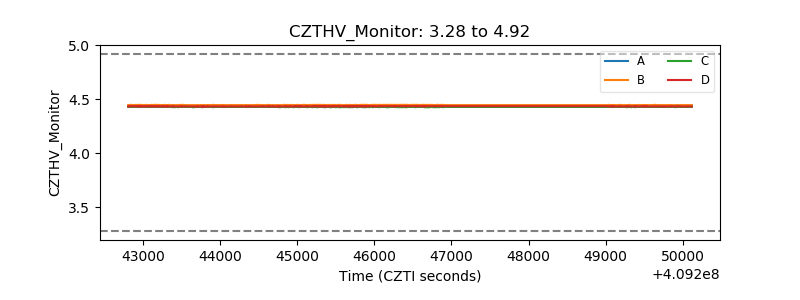 |
| D_VDD | 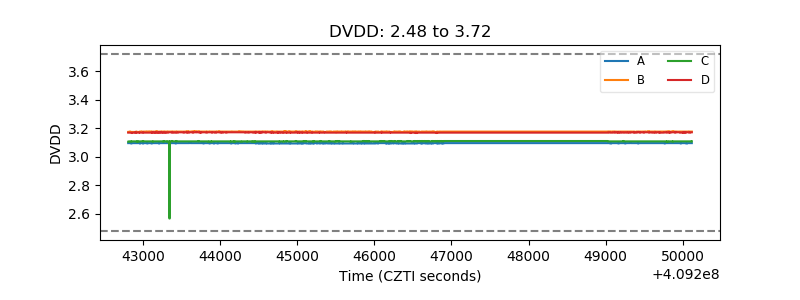 |
| Temperature 1 | 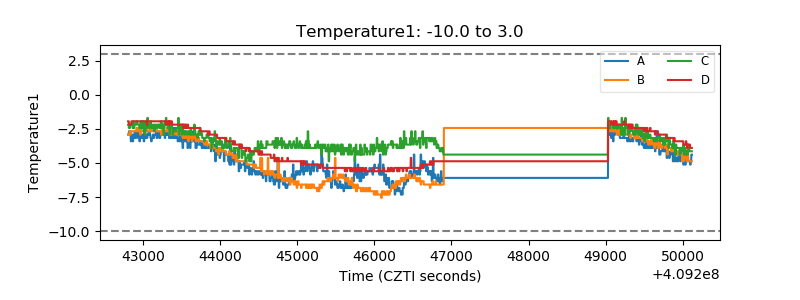 |
| Veto HV Monitor |  |
| Veto LLD | 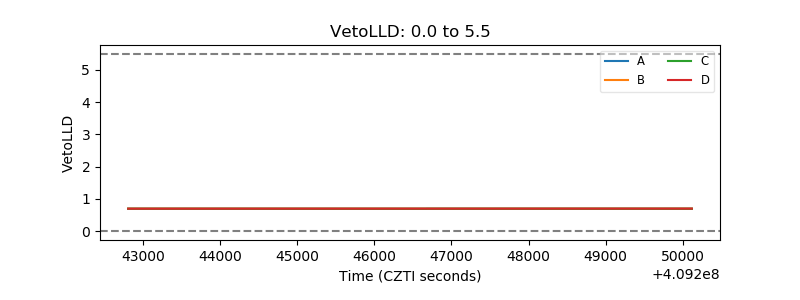 |
| Alpha Counter | 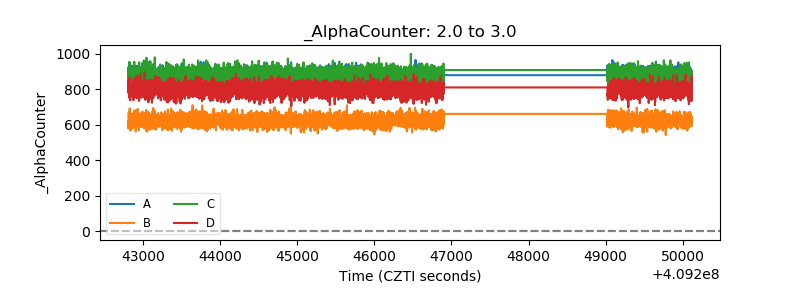 |
| _CPM_Rate | 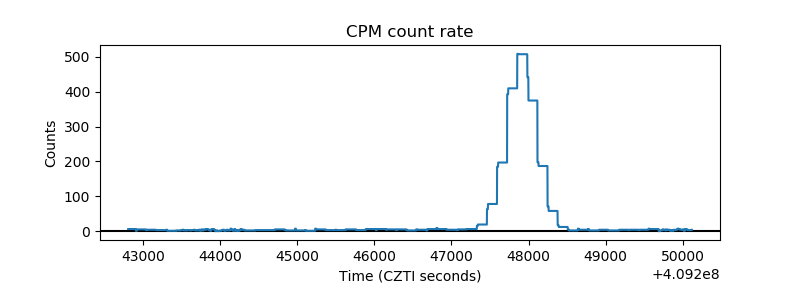 |
| CZT Counter | 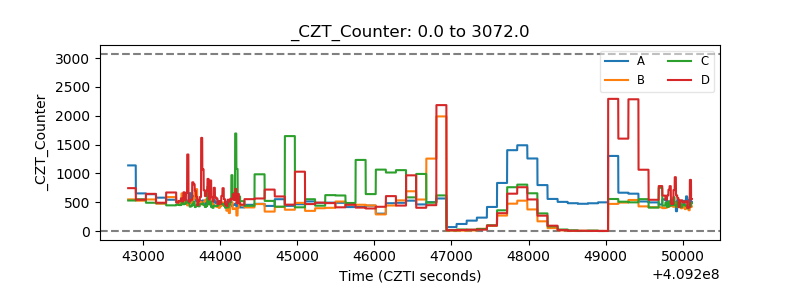 |
| +2.5 Volts monitor |  |
| +5 Volts monitor | 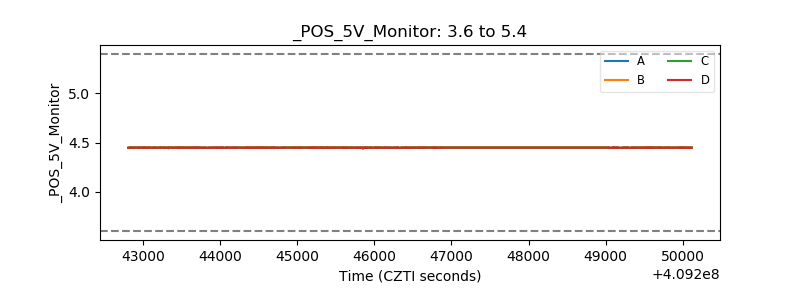 |
| _ROLL_ROT | 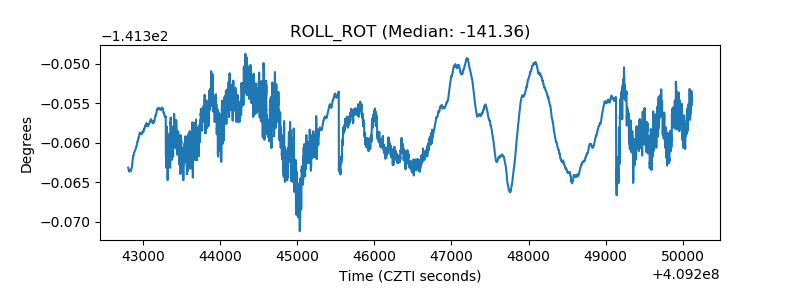 |
| _Roll_DEC | 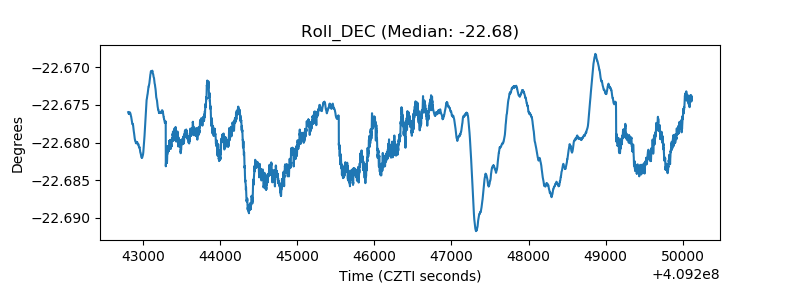 |
| _Roll_RA | 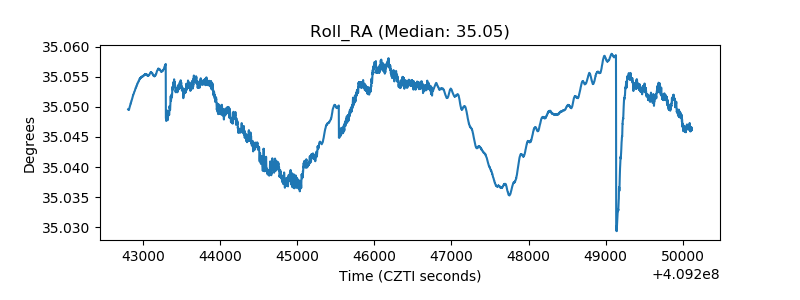 |
| Veto Counter | 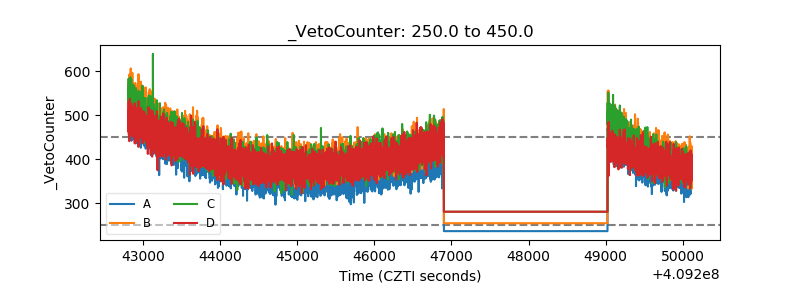 |