| Param | Original file | Final file |
|---|---|---|
| Filename | modeM0/AS1T05_067T01_9000005432_39087cztM0_level2.fits | modeM0/AS1T05_067T01_9000005432_39087cztM0_level2_quad_clean.evt |
| Size (bytes) | 391,429,440 | 89,962,560 |
| Size | 373.3 MB | 85.8 MB |
| Events in quadrant A | 2,937,721 | 627,711 |
| Events in quadrant B | 2,544,087 | 638,117 |
| Events in quadrant C | 3,739,688 | 586,486 |
| Events in quadrant D | 4,854,060 | 499,442 |
| Mode M0 | |||
|---|---|---|---|
| Quadrant | BADHDUFLAG | Total packets | Discarded packets |
| A | 0 | 12069 | 3 |
| B | 0 | 11209 | 2 |
| C | 0 | 14481 | 2 |
| D | 0 | 18013 | 2 |
| Mode SS | |||
|---|---|---|---|
| Quadrant | BADHDUFLAG | Total packets | Discarded packets |
| A | 0 | 108 | 0 |
| B | 0 | 108 | 0 |
| C | 0 | 108 | 0 |
| D | 0 | 108 | 0 |
| Mode M9 | |||
|---|---|---|---|
| Quadrant | BADHDUFLAG | Total packets | Discarded packets |
| A | 0 | 26 | 0 |
| B | 0 | 26 | 0 |
| C | 0 | 26 | 0 |
| D | 0 | 27 | 0 |
| Quadrant | Total seconds | Saturated seconds | Saturation percentage |
|---|---|---|---|
| A | 5320 | 15 | 0.281955% |
| B | 5320 | 33 | 0.620301% |
| C | 5320 | 141 | 2.650376% |
| D | 5320 | 674 | 12.669173% |
Noise dominated data is calculated using 1-second bins in cleaned event files. If a bin has >2000 counts, and if more than 50% of those come from <1% of pixels, then it is considered to be noise-dominated and hence unusable.
| Quadrant | # 1 sec bins | Bins with >0 counts | Bins with >2000 counts | High rate bins dominated by noise | Noise dominated (total time) | Noise dominated (detector-on time) | Marked lightcurve |
|---|---|---|---|---|---|---|---|
| A | 7323 | 5321 | 5 | 5 | 0.07% | 0.09% | 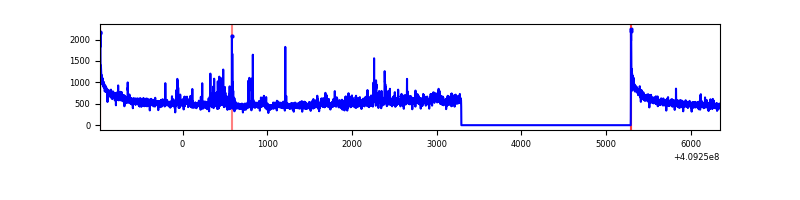 |
| B | 7323 | 5321 | 19 | 19 | 0.26% | 0.36% | 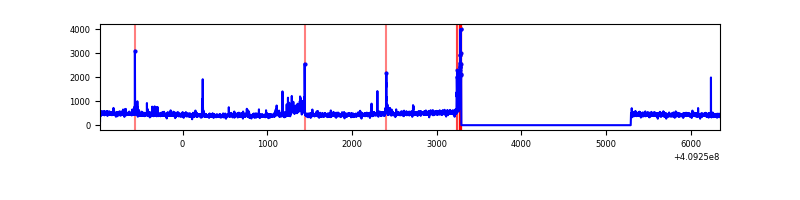 |
| C | 7323 | 5321 | 176 | 176 | 2.40% | 3.31% | 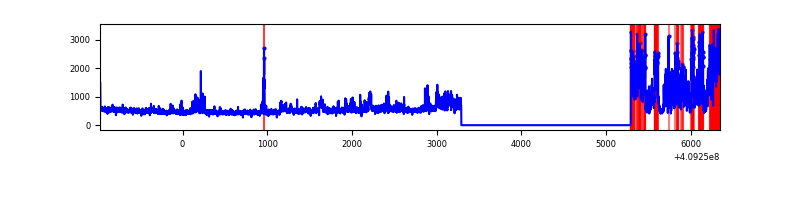 |
| D | 7323 | 5321 | 590 | 590 | 8.06% | 11.09% | 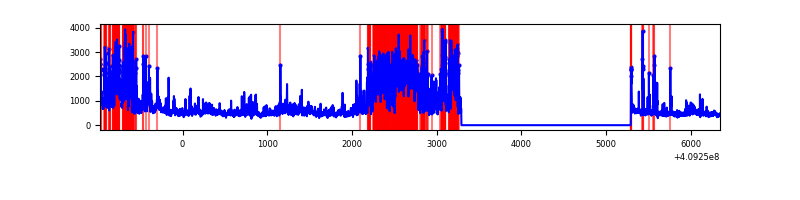 |
Top three noisy pixels from each quadrant. If the there are fewer than three noisy pixels in the level2.evt file, extra rows are filled as -1
| Pixel properties | Quadrant properties | ||||||
|---|---|---|---|---|---|---|---|
| Quadrant | DetID | PixID | Counts | Sigma | Mean | Median | Sigma |
| A | 10 | 83 | 419866 | 3488.58 | 592 | 580 | 120.2 |
| A | 15 | 223 | 193365 | 1604.03 | 592 | 580 | 120.2 |
| A | 7 | 3 | 23843 | 193.55 | 592 | 580 | 120.2 |
| B | 5 | 184 | 144427 | 1263.65 | 589 | 574 | 113.8 |
| B | 5 | 172 | 35228 | 304.41 | 589 | 574 | 113.8 |
| B | 0 | 199 | 23500 | 201.39 | 589 | 574 | 113.8 |
| C | 15 | 208 | 1268405 | 9526.74 | 566 | 570 | 133.1 |
| C | 15 | 214 | 223797 | 1677.37 | 566 | 570 | 133.1 |
| C | 10 | 20 | 31779 | 234.51 | 566 | 570 | 133.1 |
| D | 6 | 239 | 772142 | 5760.59 | 545 | 530 | 133.9 |
| D | 2 | 249 | 658611 | 4913.01 | 545 | 530 | 133.9 |
| D | 12 | 235 | 574934 | 4288.31 | 545 | 530 | 133.9 |
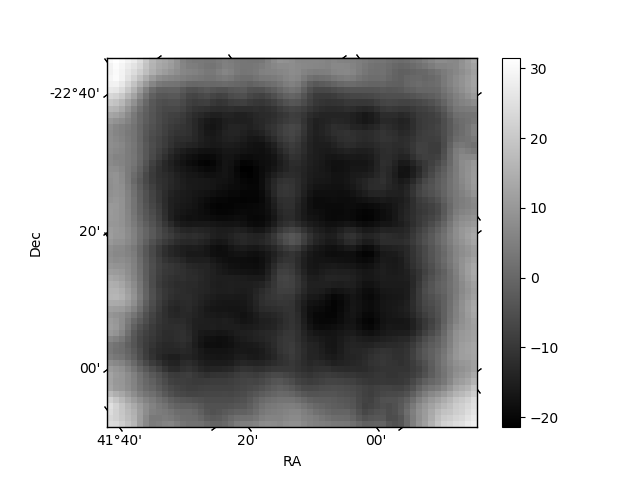
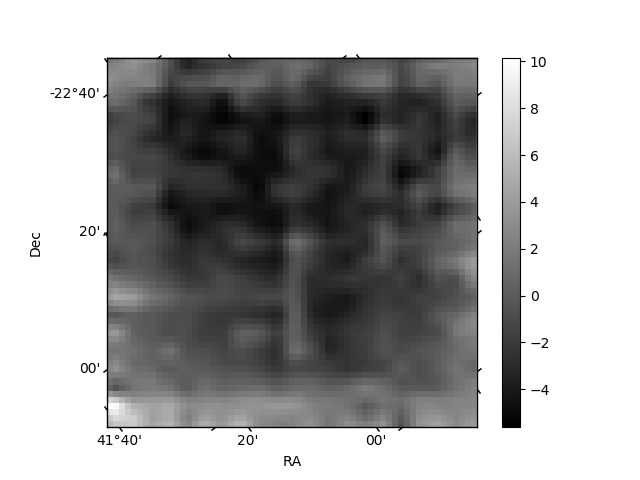
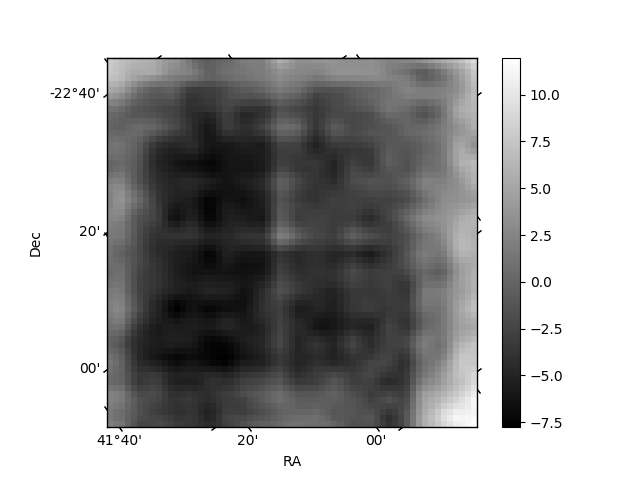
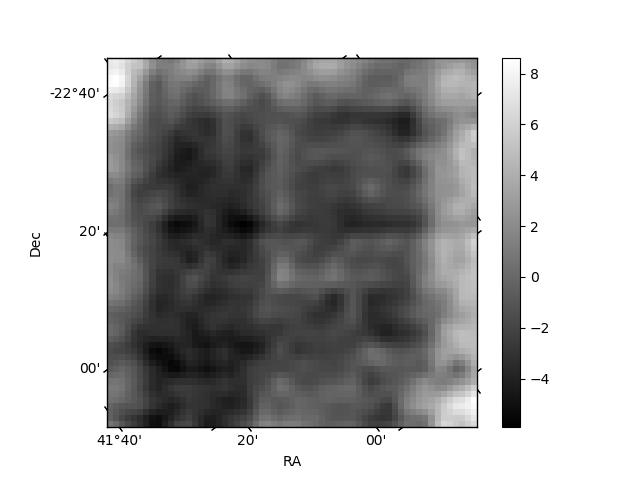
Histogram calculated using DETX and DETY for each event in the final _common_clean file
| Quadrant A | 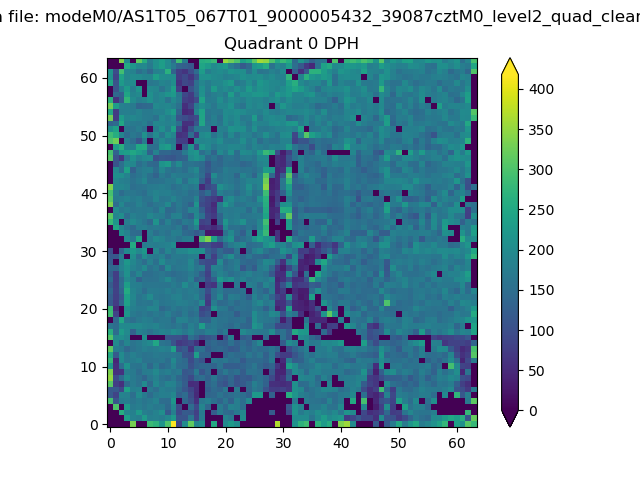 |
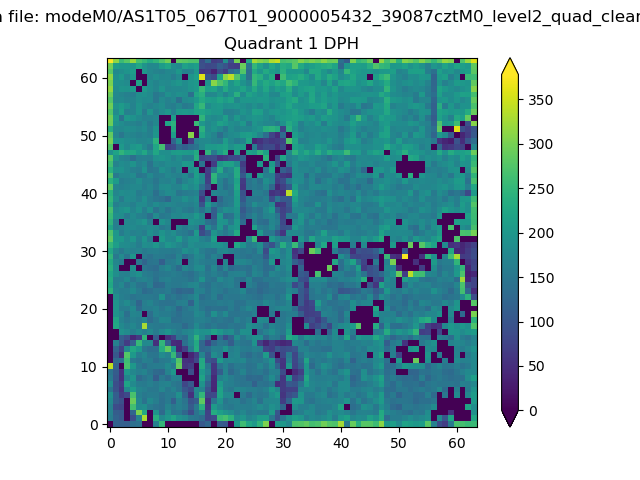 |
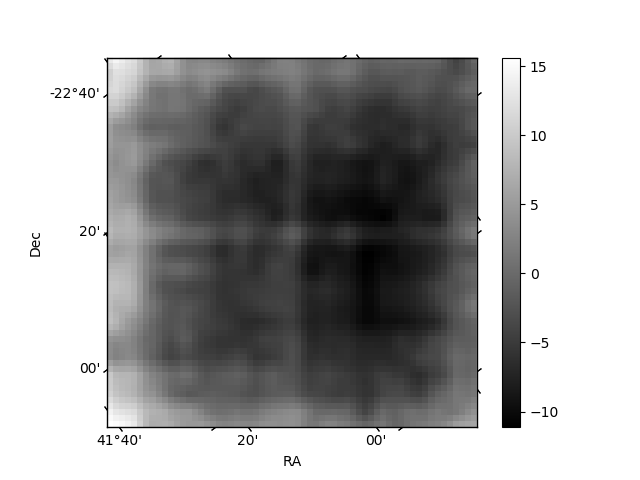
Quadrant B |
|---|---|---|---|
| Quadrant D | 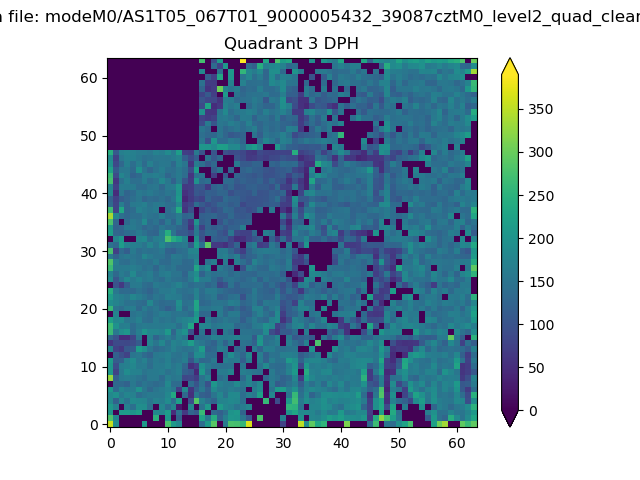 |
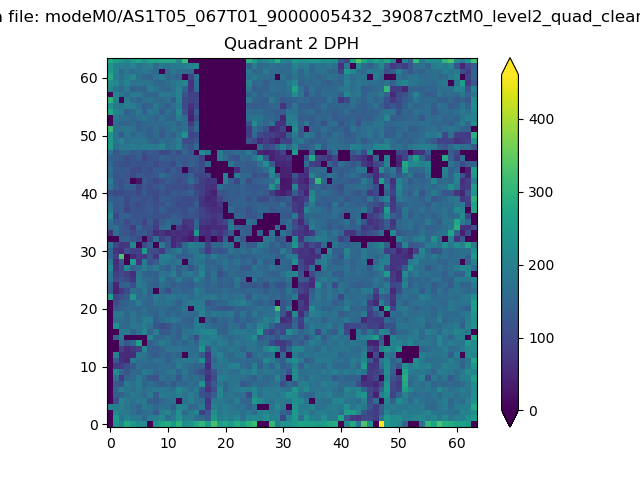 |
Quadrant C |
| Plot type | Count rate plots | Images |
|---|---|---|
| Comparison with Poisson distribution Blue bars denote a histogram of data divided into 1 sec bins. Red curve is a Poisson curve with rate = median count rate of data. |
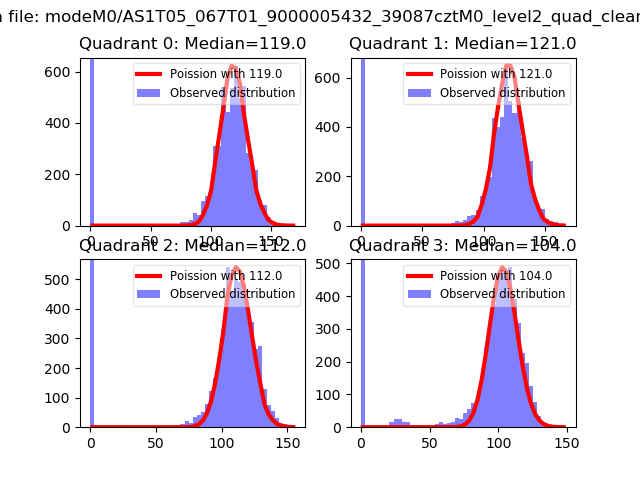 |
 |
| Quadrant-wise count rates Data is divided into 100 sec bins |
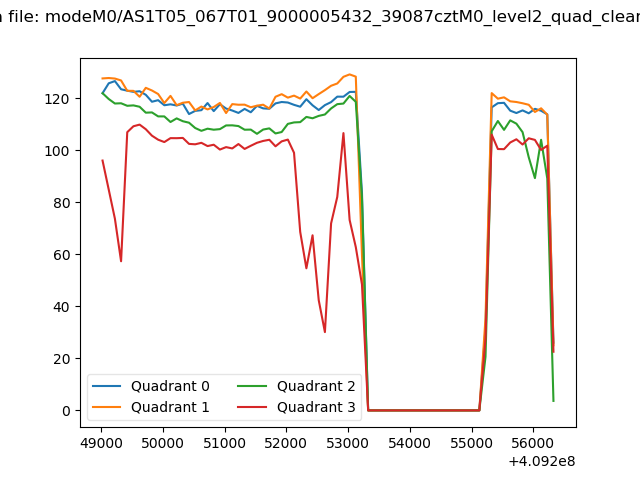 |
|
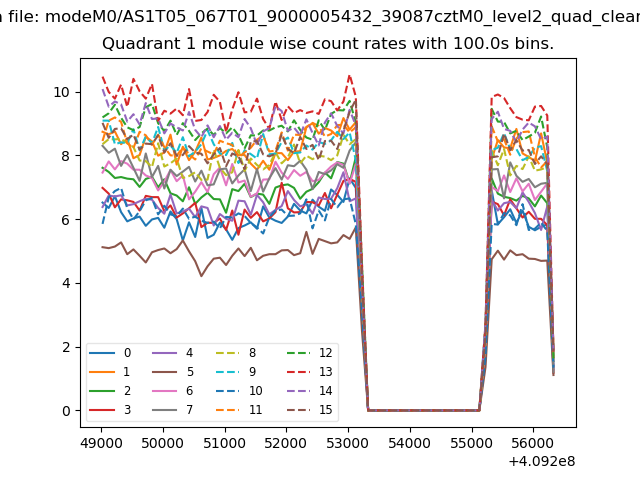
| Module-wise count rates for Quadrant A Data is divided into 100 sec bins |
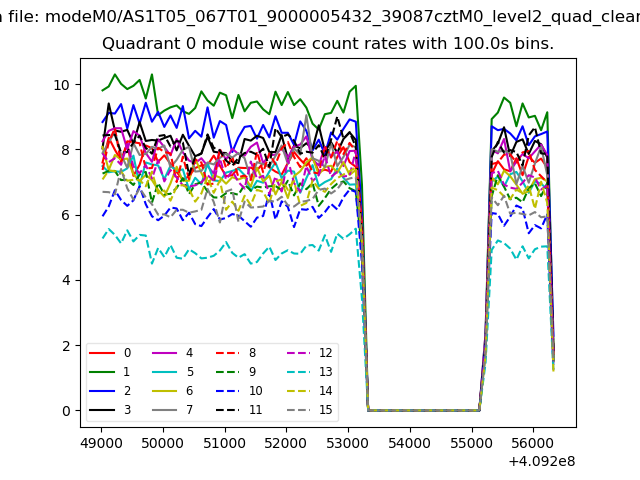 |
 |
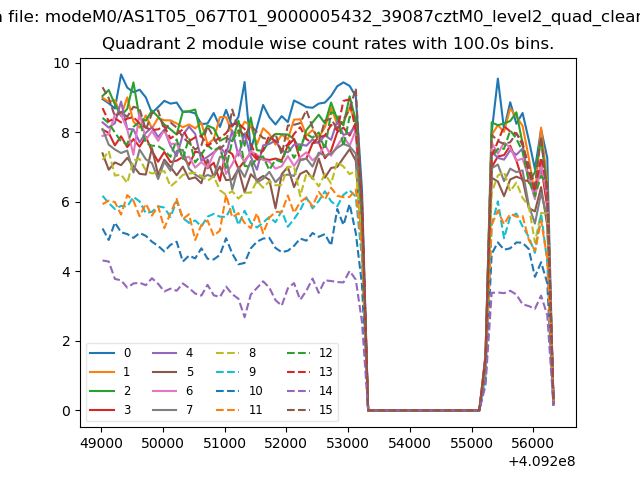
| Module-wise count rates for Quadrant B Data is divided into 100 sec bins |
 |
 |
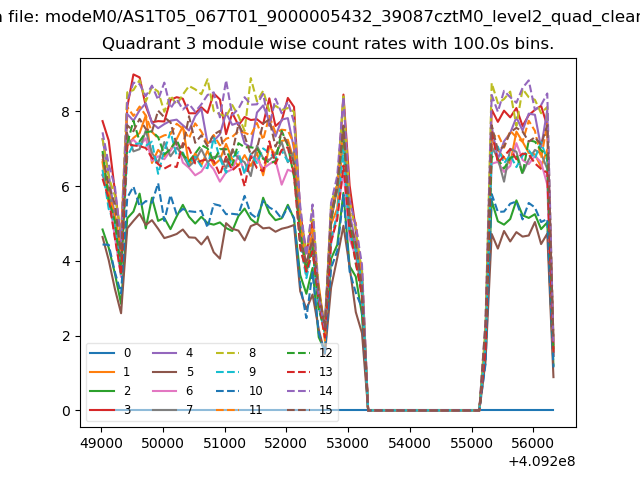
| Module-wise count rates for Quadrant C Data is divided into 100 sec bins |
 |
 |
| Module-wise count rates for Quadrant D Data is divided into 100 sec bins |
 |
 |
| Parameter | Plot |
|---|---|
| CZT HV Monitor | 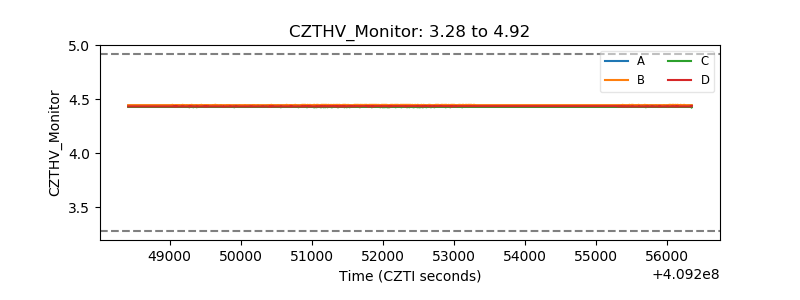 |
| D_VDD | 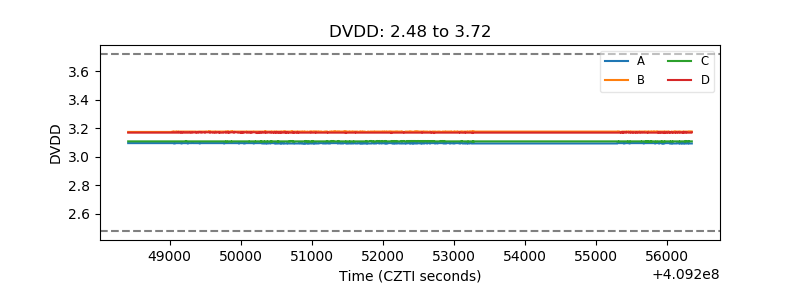 |
| Temperature 1 | 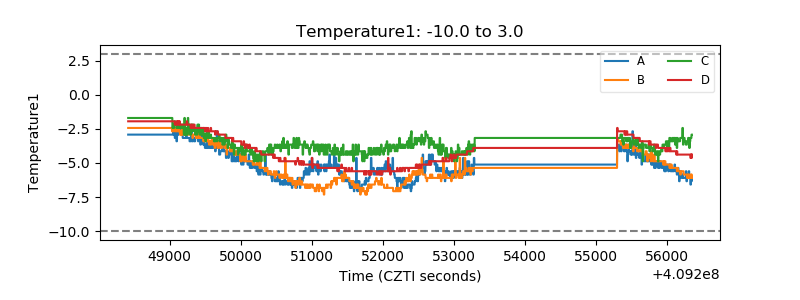 |
| Veto HV Monitor | 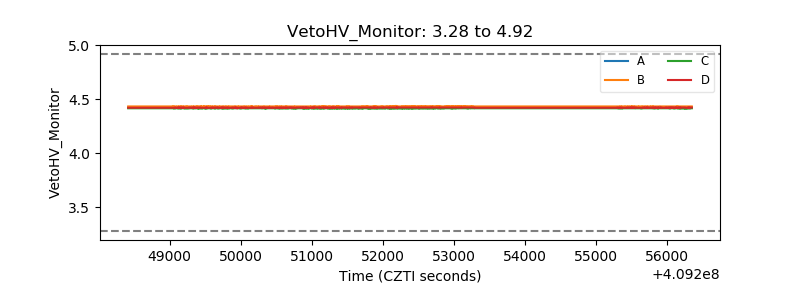 |
| Veto LLD | 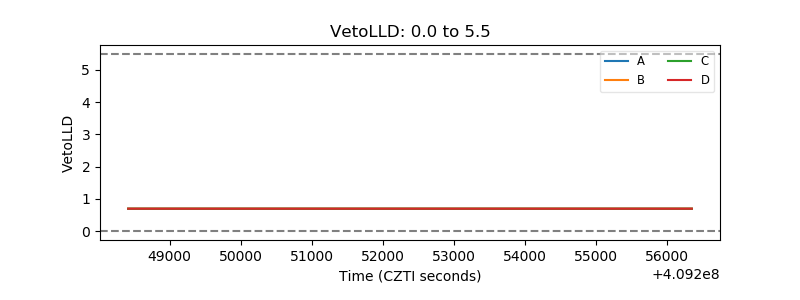 |
| Alpha Counter | 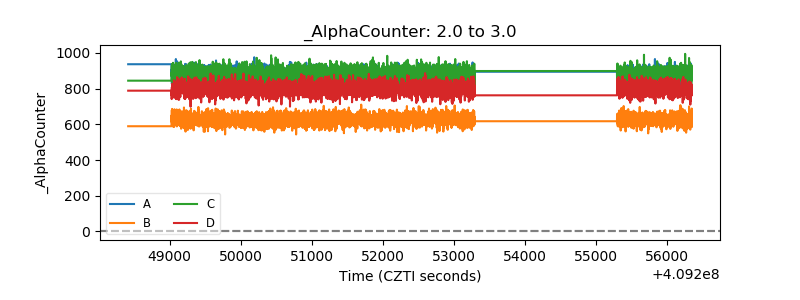 |
| _CPM_Rate | 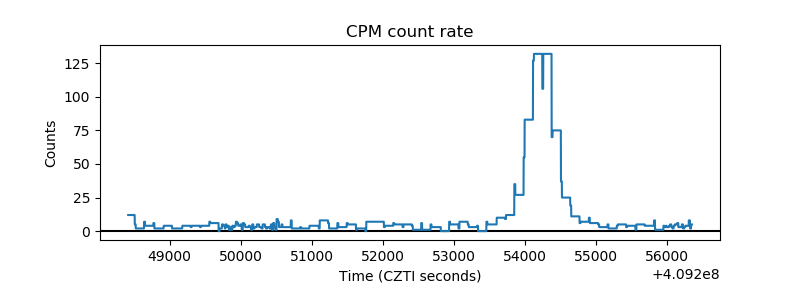 |
| CZT Counter | 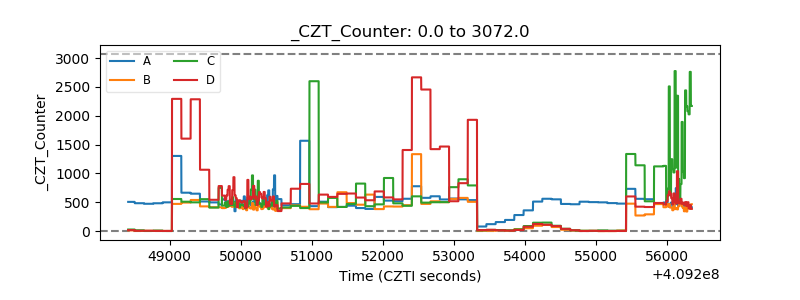 |
| +2.5 Volts monitor | 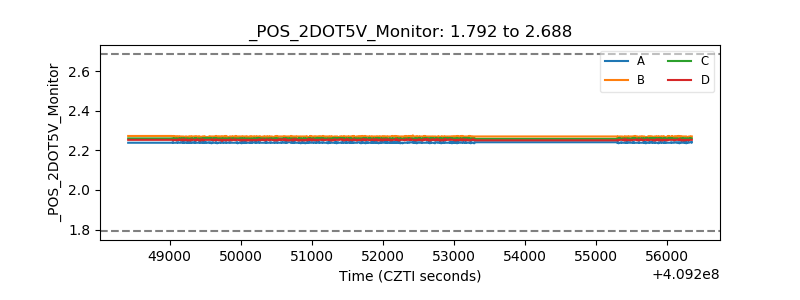 |
| +5 Volts monitor | 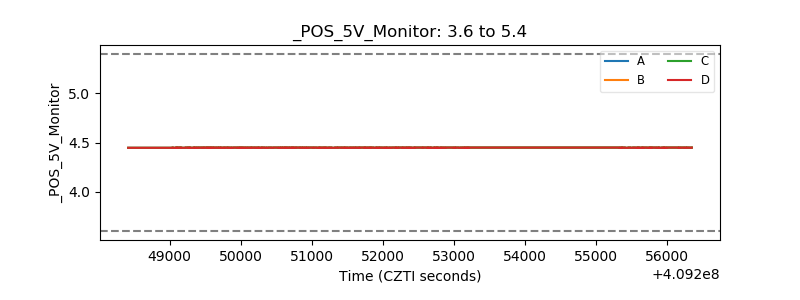 |
| _ROLL_ROT | 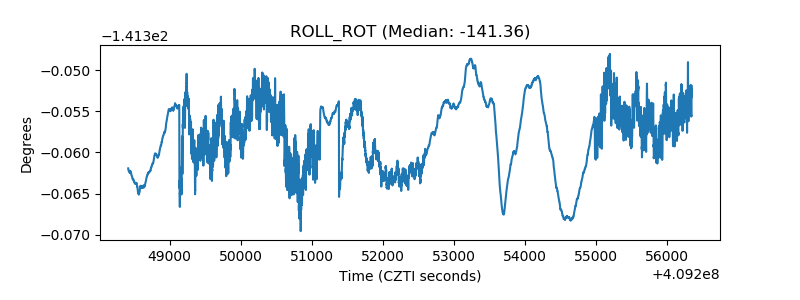 |
| _Roll_DEC | 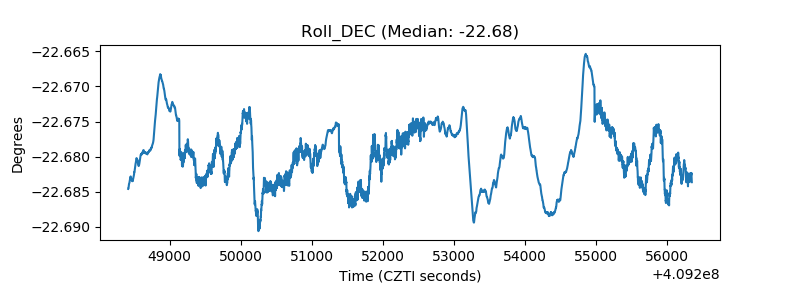 |
| _Roll_RA | 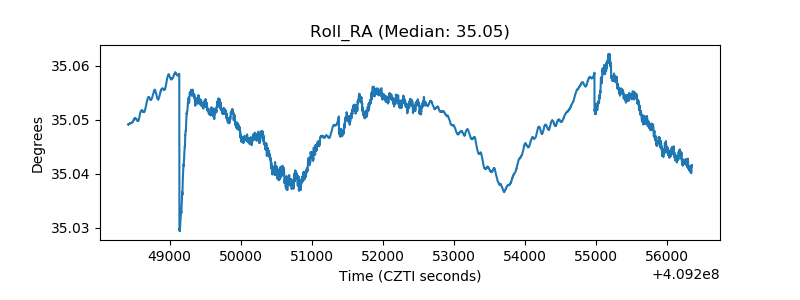 |
| Veto Counter | 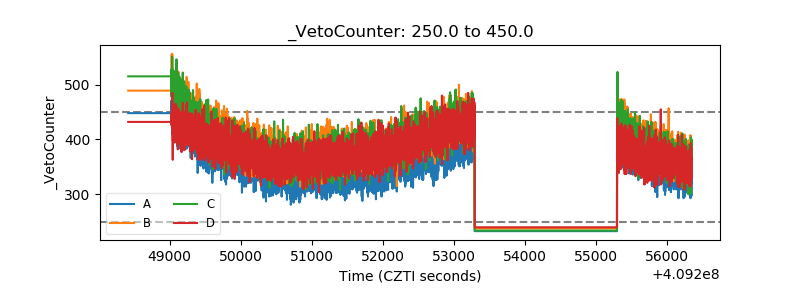 |