| Param | Original file | Final file |
|---|---|---|
| Filename | modeM0/AS1T05_067T01_9000005432_39088cztM0_level2.fits | modeM0/AS1T05_067T01_9000005432_39088cztM0_level2_quad_clean.evt |
| Size (bytes) | 374,996,160 | 87,687,360 |
| Size | 357.6 MB | 83.6 MB |
| Events in quadrant A | 2,758,187 | 604,853 |
| Events in quadrant B | 2,407,274 | 616,873 |
| Events in quadrant C | 5,183,411 | 530,399 |
| Events in quadrant D | 3,121,668 | 533,420 |
| Mode M0 | |||
|---|---|---|---|
| Quadrant | BADHDUFLAG | Total packets | Discarded packets |
| A | 0 | 11504 | 3 |
| B | 0 | 10776 | 2 |
| C | 0 | 19017 | 2 |
| D | 0 | 12883 | 2 |
| Mode SS | |||
|---|---|---|---|
| Quadrant | BADHDUFLAG | Total packets | Discarded packets |
| A | 0 | 108 | 0 |
| B | 0 | 108 | 0 |
| C | 0 | 108 | 0 |
| D | 0 | 108 | 0 |
| Mode M9 | |||
|---|---|---|---|
| Quadrant | BADHDUFLAG | Total packets | Discarded packets |
| A | 0 | 20 | 0 |
| B | 0 | 20 | 0 |
| C | 0 | 20 | 0 |
| D | 0 | 21 | 0 |
| Quadrant | Total seconds | Saturated seconds | Saturation percentage |
|---|---|---|---|
| A | 5276 | 18 | 0.341168% |
| B | 5276 | 11 | 0.208491% |
| C | 5276 | 569 | 10.784685% |
| D | 5276 | 78 | 1.478393% |
Noise dominated data is calculated using 1-second bins in cleaned event files. If a bin has >2000 counts, and if more than 50% of those come from <1% of pixels, then it is considered to be noise-dominated and hence unusable.
| Quadrant | # 1 sec bins | Bins with >0 counts | Bins with >2000 counts | High rate bins dominated by noise | Noise dominated (total time) | Noise dominated (detector-on time) | Marked lightcurve |
|---|---|---|---|---|---|---|---|
| A | 6980 | 5277 | 14 | 14 | 0.20% | 0.27% | 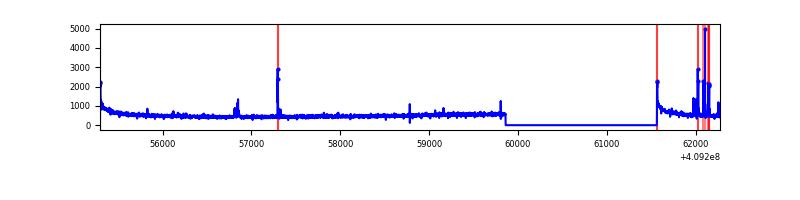 |
| B | 6980 | 5277 | 4 | 4 | 0.06% | 0.08% | 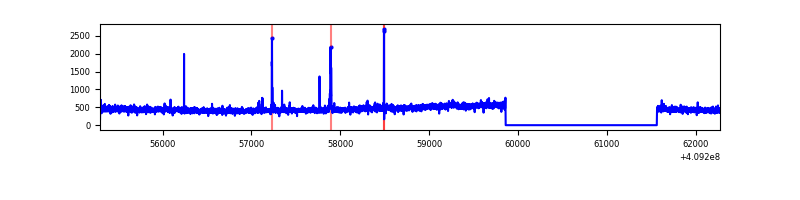 |
| C | 6980 | 5277 | 583 | 583 | 8.35% | 11.05% | 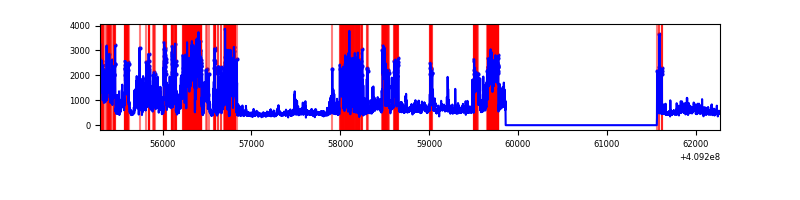 |
| D | 6980 | 5277 | 74 | 74 | 1.06% | 1.40% | 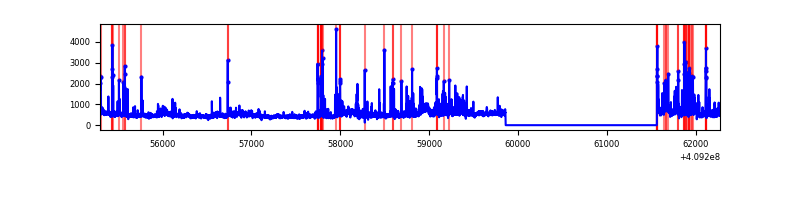 |
Top three noisy pixels from each quadrant. If the there are fewer than three noisy pixels in the level2.evt file, extra rows are filled as -1
| Pixel properties | Quadrant properties | ||||||
|---|---|---|---|---|---|---|---|
| Quadrant | DetID | PixID | Counts | Sigma | Mean | Median | Sigma |
| A | 10 | 83 | 404801 | 3403.57 | 585 | 575 | 118.8 |
| A | 7 | 3 | 61943 | 516.72 | 585 | 575 | 118.8 |
| A | 15 | 223 | 18722 | 152.8 | 585 | 575 | 118.8 |
| B | 5 | 184 | 44092 | 382.1 | 583 | 567 | 113.9 |
| B | 5 | 172 | 42280 | 366.2 | 583 | 567 | 113.9 |
| B | 0 | 230 | 19463 | 165.89 | 583 | 567 | 113.9 |
| C | 15 | 208 | 2774793 | 21468.32 | 552 | 557 | 129.2 |
| C | 15 | 214 | 217487 | 1678.7 | 552 | 557 | 129.2 |
| C | 15 | 159 | 16124 | 120.46 | 552 | 557 | 129.2 |
| D | 12 | 235 | 295844 | 2141.67 | 564 | 547 | 137.9 |
| D | 2 | 249 | 201319 | 1456.12 | 564 | 547 | 137.9 |
| D | 12 | 227 | 129256 | 933.47 | 564 | 547 | 137.9 |
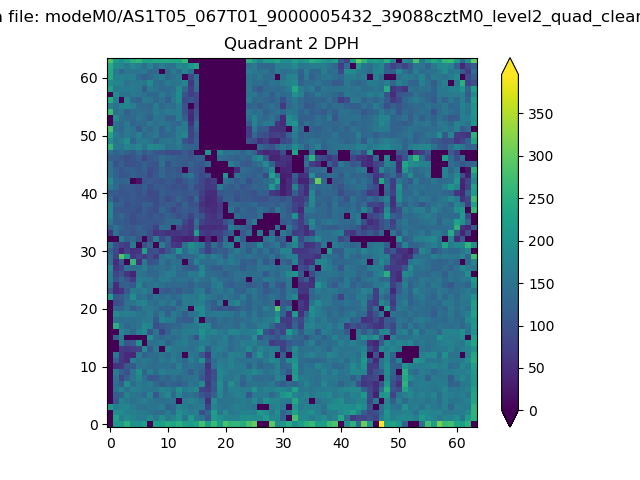
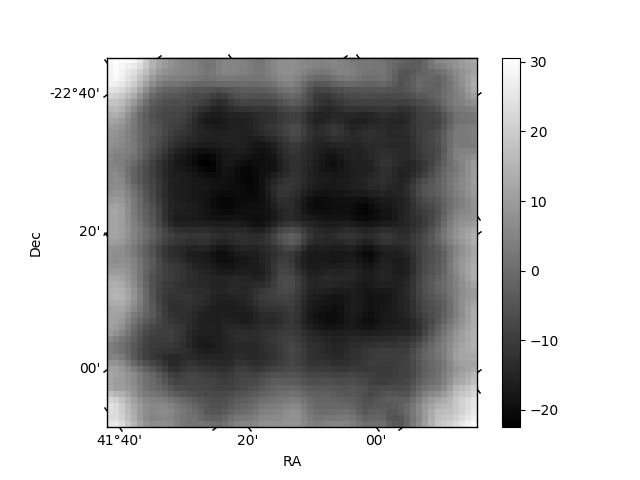
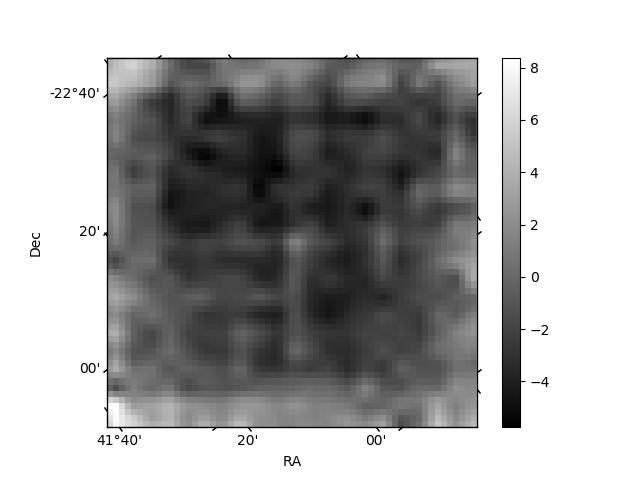
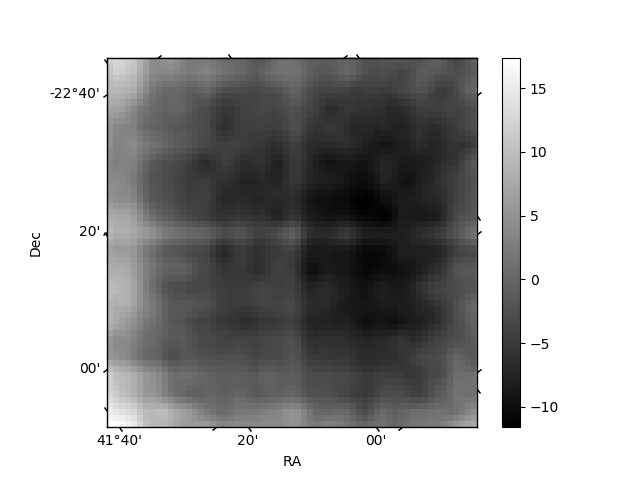
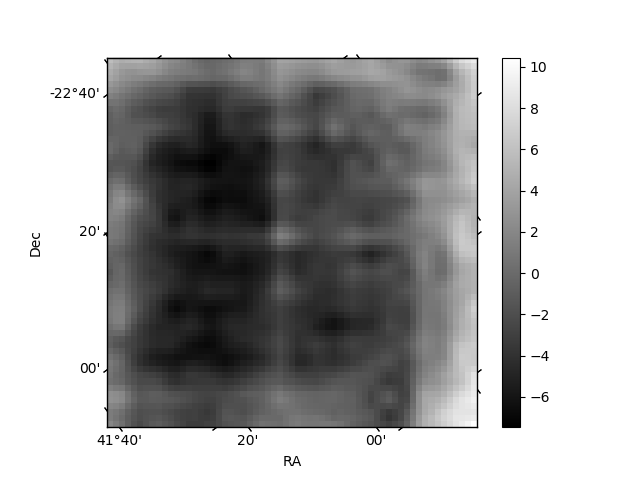
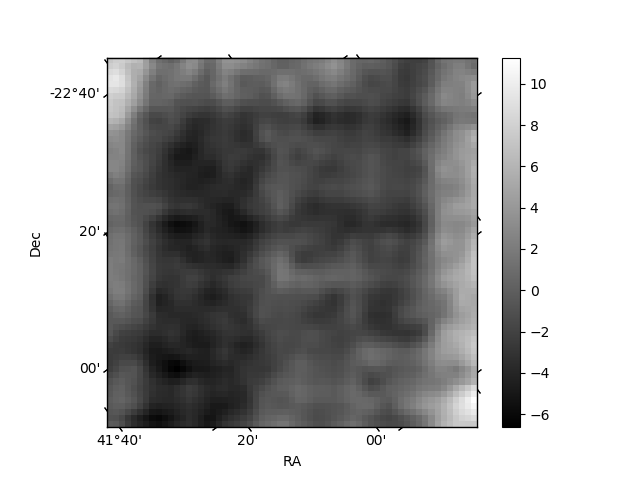
Histogram calculated using DETX and DETY for each event in the final _common_clean file
| Quadrant A | 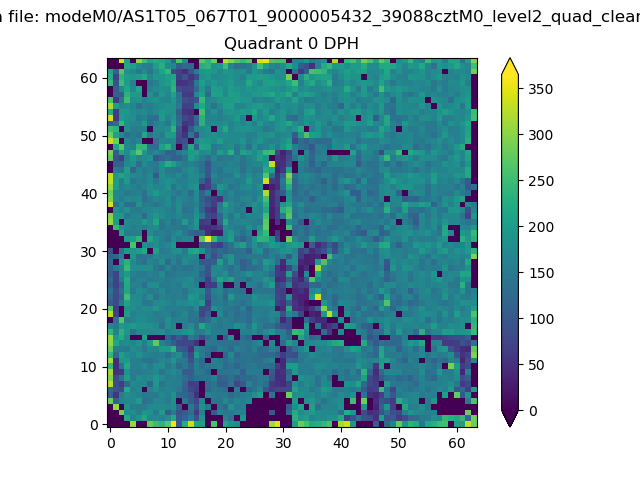 |
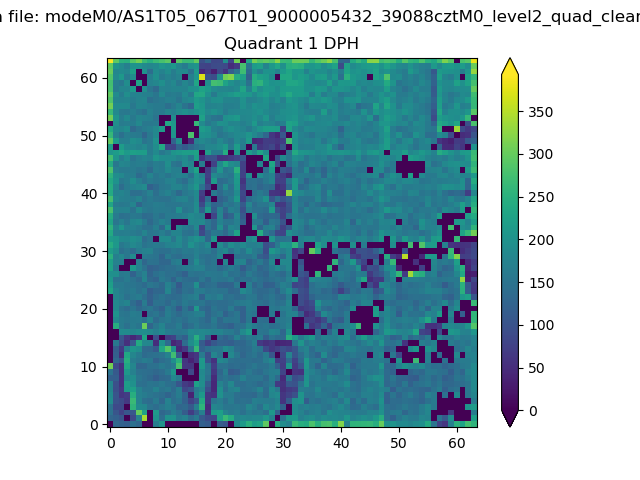 |
Quadrant B |
|---|---|---|---|
| Quadrant D | 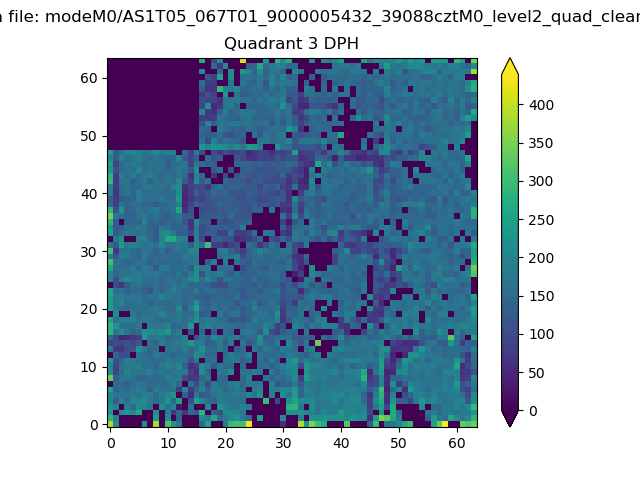 |
 |
Quadrant C |
| Plot type | Count rate plots | Images |
|---|---|---|
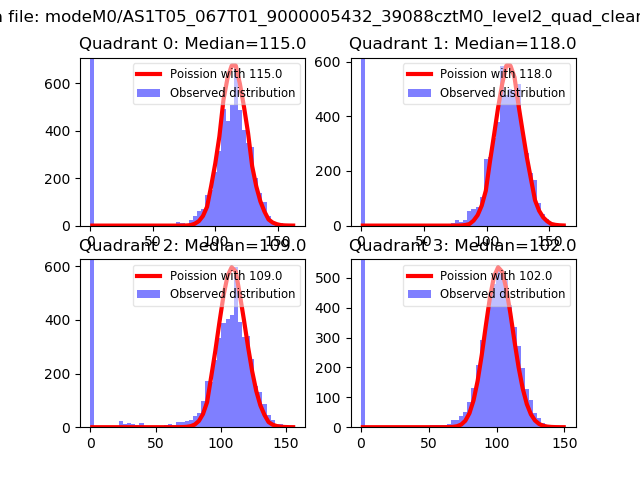
| Comparison with Poisson distribution Blue bars denote a histogram of data divided into 1 sec bins. Red curve is a Poisson curve with rate = median count rate of data. |
 |
 |
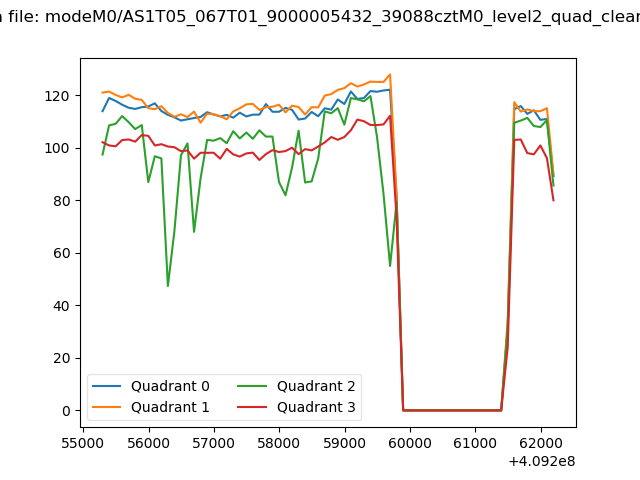
| Quadrant-wise count rates Data is divided into 100 sec bins |
 |
|
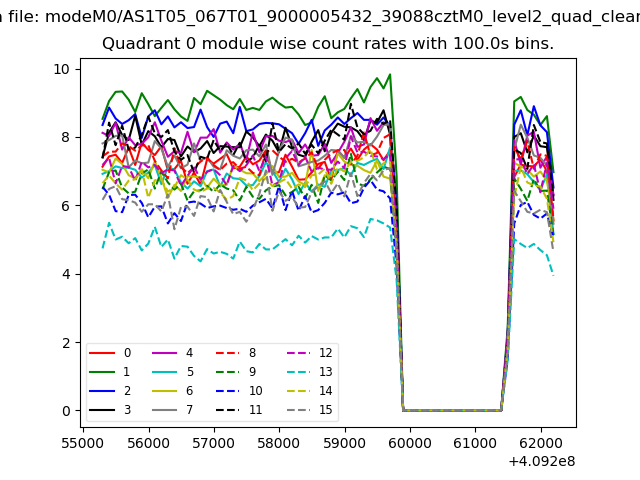
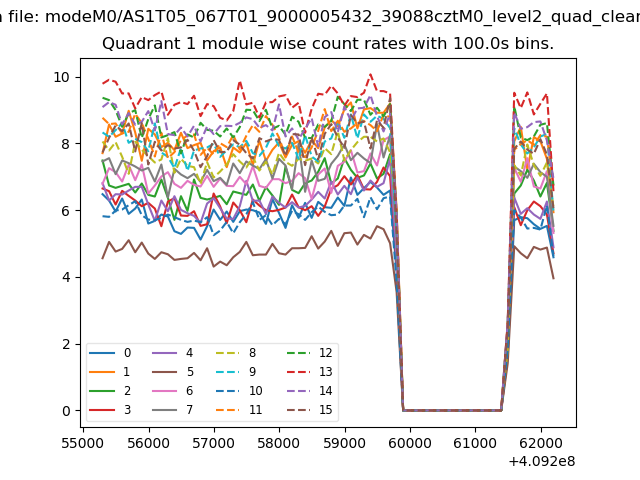
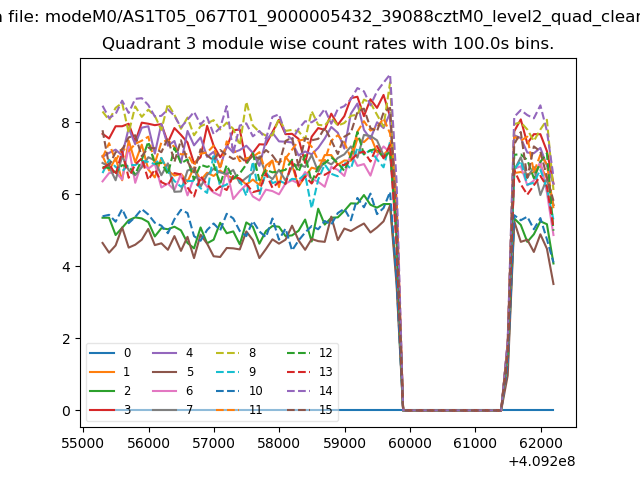
| Module-wise count rates for Quadrant A Data is divided into 100 sec bins |
 |
 |
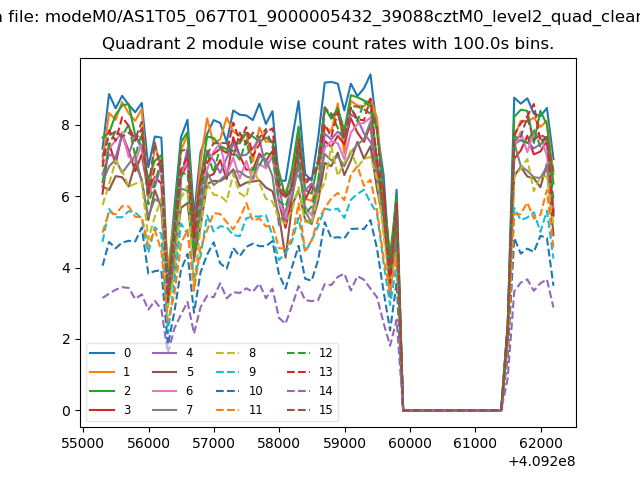
| Module-wise count rates for Quadrant B Data is divided into 100 sec bins |
 |
 |
| Module-wise count rates for Quadrant C Data is divided into 100 sec bins |
 |
 |
| Module-wise count rates for Quadrant D Data is divided into 100 sec bins |
 |
 |
| Parameter | Plot |
|---|---|
| CZT HV Monitor |  |
| D_VDD | 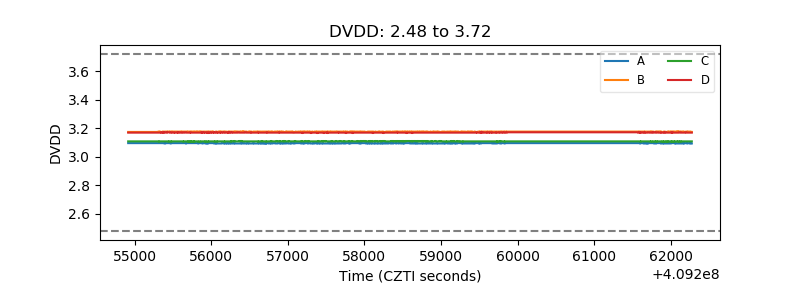 |
| Temperature 1 | 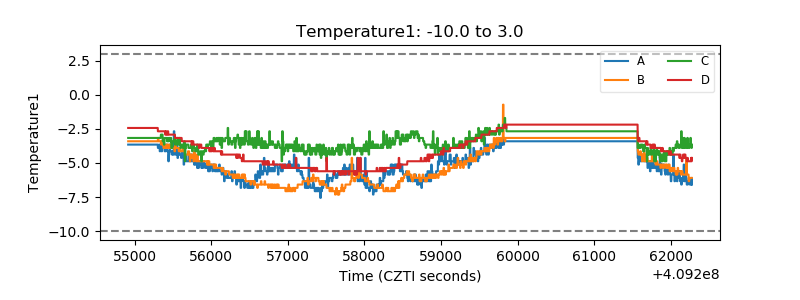 |
| Veto HV Monitor | 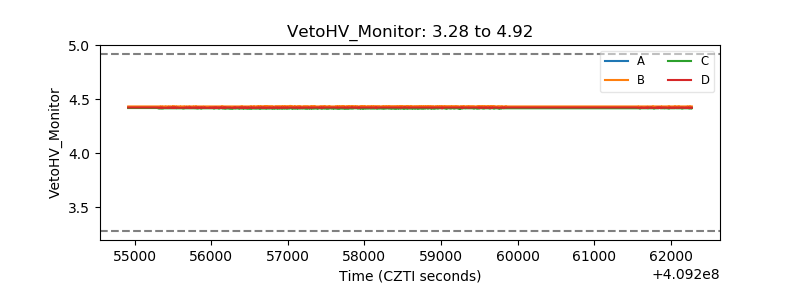 |
| Veto LLD | 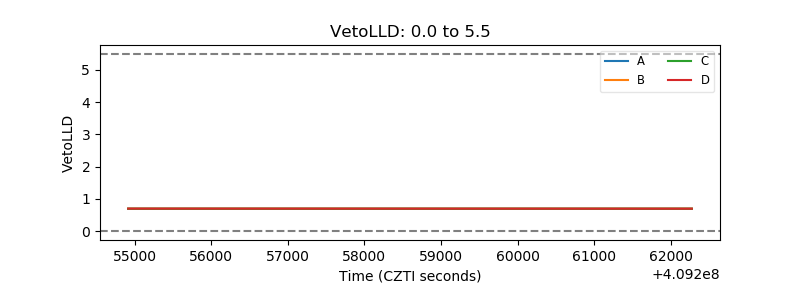 |
| Alpha Counter | 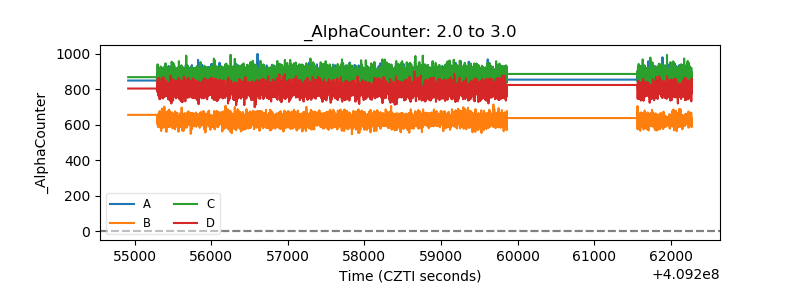 |
| _CPM_Rate | 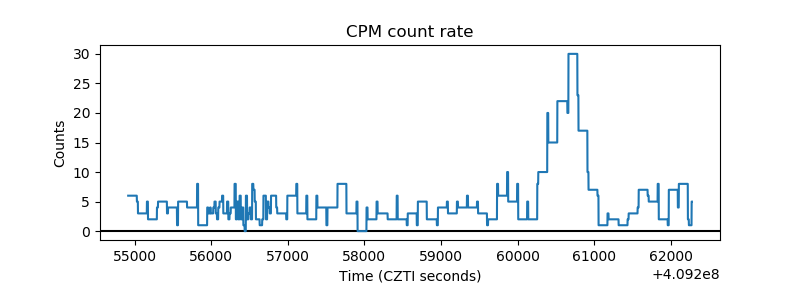 |
| CZT Counter | 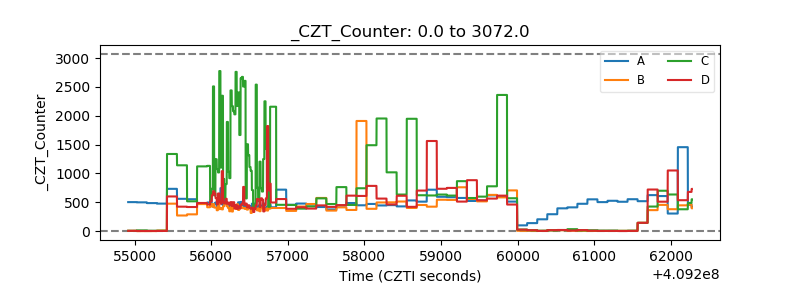 |
| +2.5 Volts monitor | 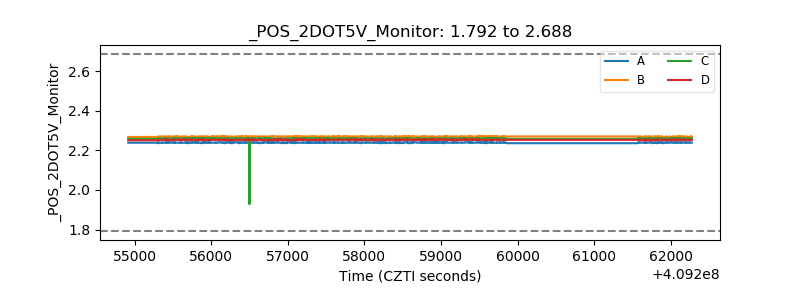 |
| +5 Volts monitor |  |
| _ROLL_ROT | 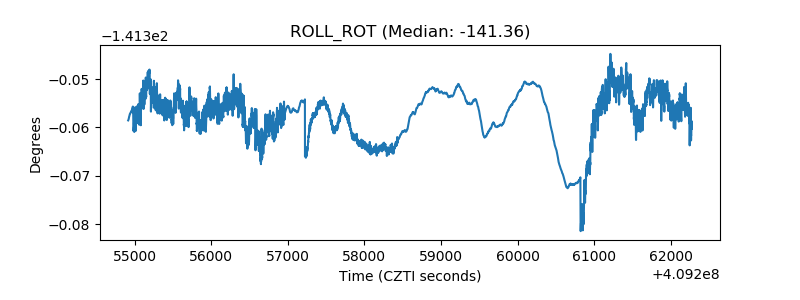 |
| _Roll_DEC | 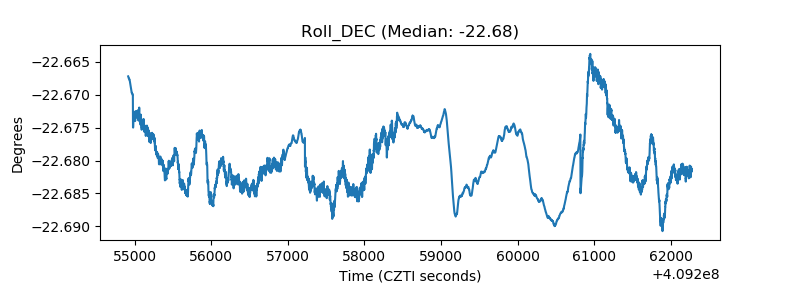 |
| _Roll_RA | 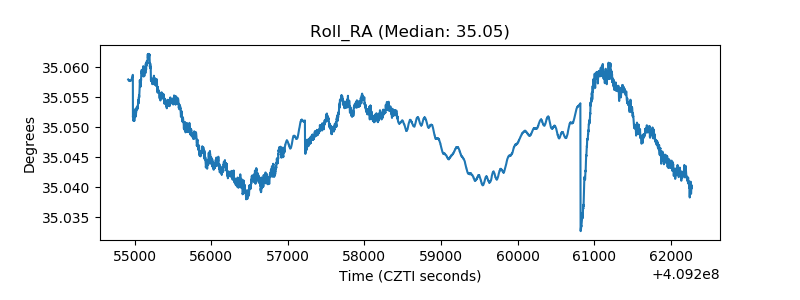 |
| Veto Counter | 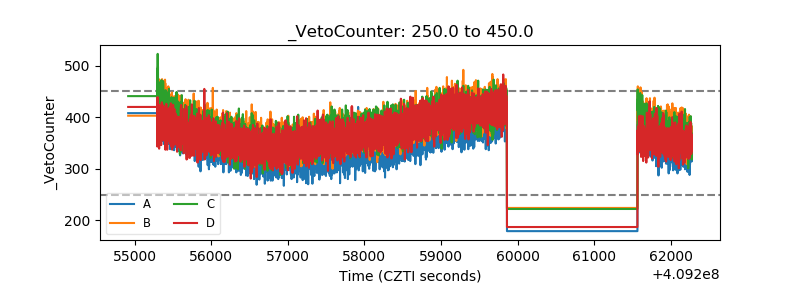 |