| Param | Original file | Final file |
|---|---|---|
| Filename | modeM0/AS1T05_067T01_9000005432_39090cztM0_level2.fits | modeM0/AS1T05_067T01_9000005432_39090cztM0_level2_quad_clean.evt |
| Size (bytes) | 381,484,800 | 96,226,560 |
| Size | 363.8 MB | 91.8 MB |
| Events in quadrant A | 3,927,178 | 646,375 |
| Events in quadrant B | 2,662,474 | 666,286 |
| Events in quadrant C | 3,658,252 | 613,926 |
| Events in quadrant D | 3,419,547 | 579,150 |
| Mode M0 | |||
|---|---|---|---|
| Quadrant | BADHDUFLAG | Total packets | Discarded packets |
| A | 0 | 15273 | 3 |
| B | 0 | 11836 | 2 |
| C | 0 | 14647 | 2 |
| D | 0 | 14060 | 2 |
| Mode SS | |||
|---|---|---|---|
| Quadrant | BADHDUFLAG | Total packets | Discarded packets |
| A | 0 | 118 | 0 |
| B | 0 | 118 | 0 |
| C | 0 | 118 | 0 |
| D | 0 | 118 | 0 |
| Mode M9 | |||
|---|---|---|---|
| Quadrant | BADHDUFLAG | Total packets | Discarded packets |
| A | 0 | 26 | 0 |
| B | 0 | 26 | 0 |
| C | 0 | 26 | 0 |
| D | 0 | 26 | 0 |
| Quadrant | Total seconds | Saturated seconds | Saturation percentage |
|---|---|---|---|
| A | 5835 | 86 | 1.473865% |
| B | 5835 | 10 | 0.171380% |
| C | 5835 | 165 | 2.827763% |
| D | 5835 | 55 | 0.942588% |
Noise dominated data is calculated using 1-second bins in cleaned event files. If a bin has >2000 counts, and if more than 50% of those come from <1% of pixels, then it is considered to be noise-dominated and hence unusable.
| Quadrant | # 1 sec bins | Bins with >0 counts | Bins with >2000 counts | High rate bins dominated by noise | Noise dominated (total time) | Noise dominated (detector-on time) | Marked lightcurve |
|---|---|---|---|---|---|---|---|
| A | 7119 | 5836 | 41 | 41 | 0.58% | 0.70% | 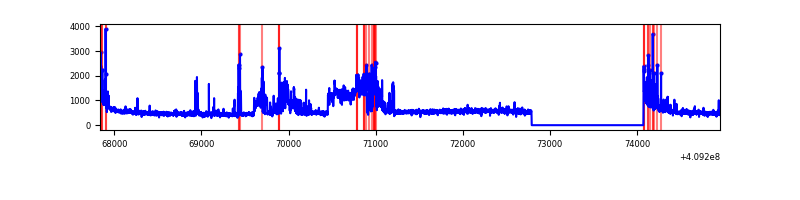 |
| B | 7119 | 5836 | 2 | 2 | 0.03% | 0.03% | 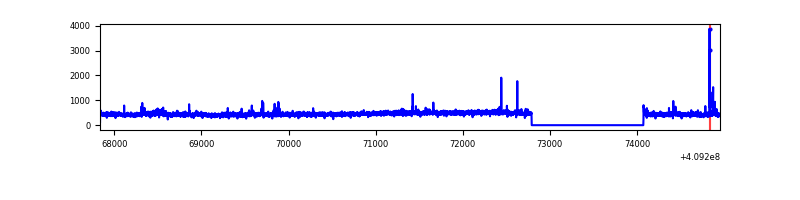 |
| C | 7119 | 5836 | 146 | 146 | 2.05% | 2.50% | 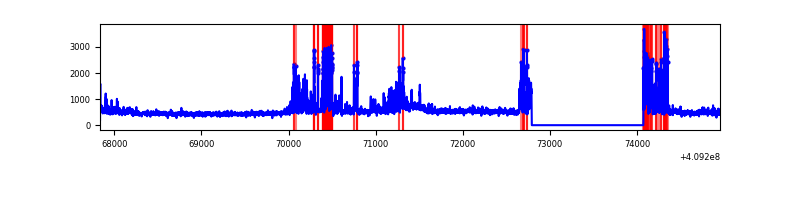 |
| D | 7119 | 5836 | 45 | 45 | 0.63% | 0.77% | 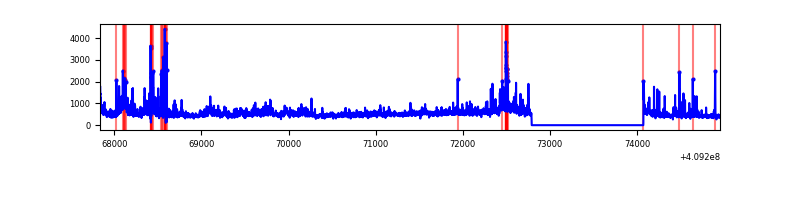 |
Top three noisy pixels from each quadrant. If the there are fewer than three noisy pixels in the level2.evt file, extra rows are filled as -1
| Pixel properties | Quadrant properties | ||||||
|---|---|---|---|---|---|---|---|
| Quadrant | DetID | PixID | Counts | Sigma | Mean | Median | Sigma |
| A | 15 | 223 | 818093 | 6085.24 | 650 | 637 | 134.3 |
| A | 10 | 83 | 442379 | 3288.38 | 650 | 637 | 134.3 |
| A | 7 | 3 | 115086 | 851.97 | 650 | 637 | 134.3 |
| B | 5 | 184 | 47284 | 370.72 | 649 | 631 | 125.8 |
| B | 0 | 230 | 25068 | 194.18 | 649 | 631 | 125.8 |
| B | 5 | 172 | 23026 | 177.96 | 649 | 631 | 125.8 |
| C | 15 | 208 | 917680 | 6221.33 | 629 | 631 | 147.4 |
| C | 15 | 214 | 243320 | 1646.42 | 629 | 631 | 147.4 |
| C | 9 | 187 | 19229 | 126.17 | 629 | 631 | 147.4 |
| D | 12 | 235 | 599012 | 3877.85 | 628 | 609 | 154.3 |
| D | 2 | 249 | 158150 | 1020.92 | 628 | 609 | 154.3 |
| D | 1 | 47 | 107279 | 691.26 | 628 | 609 | 154.3 |
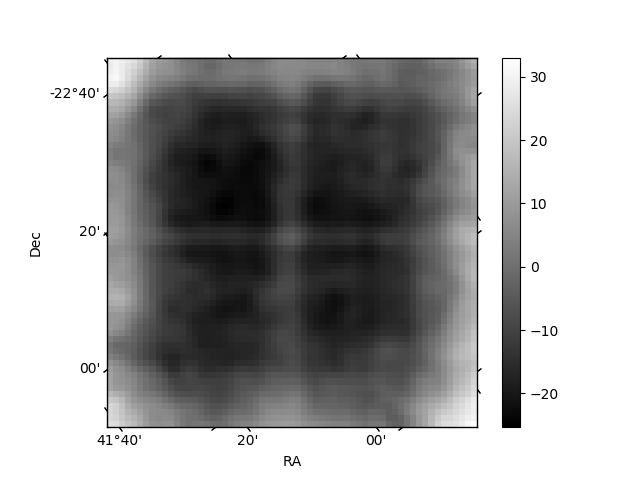
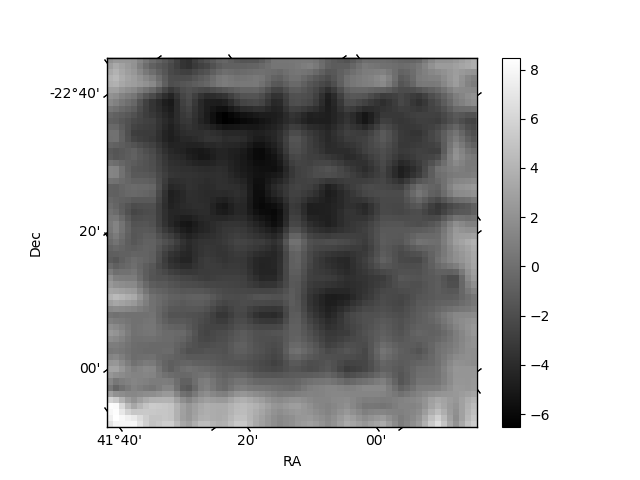
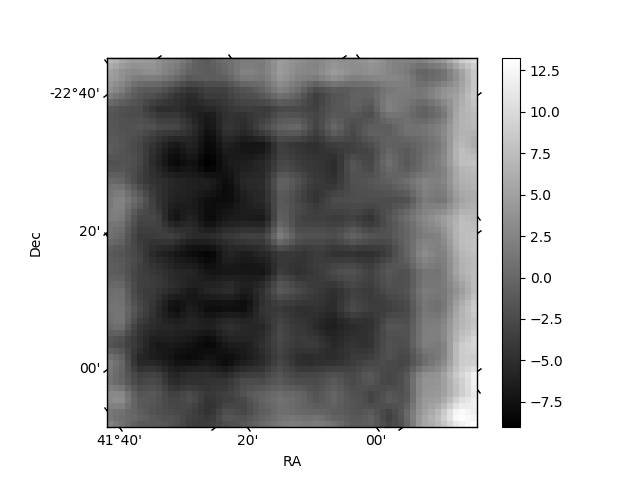
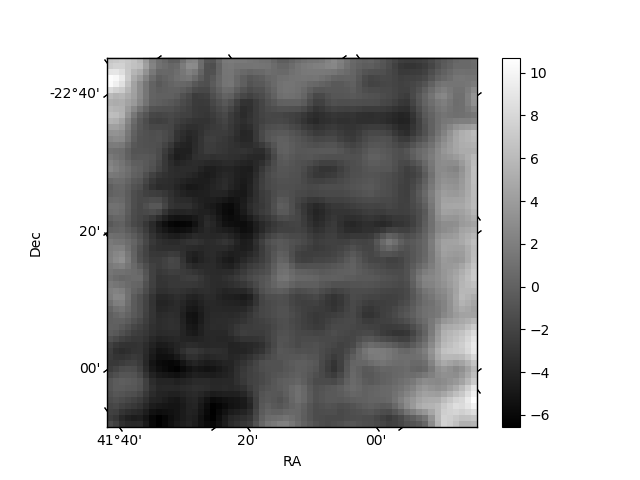
Histogram calculated using DETX and DETY for each event in the final _common_clean file
| Quadrant A | 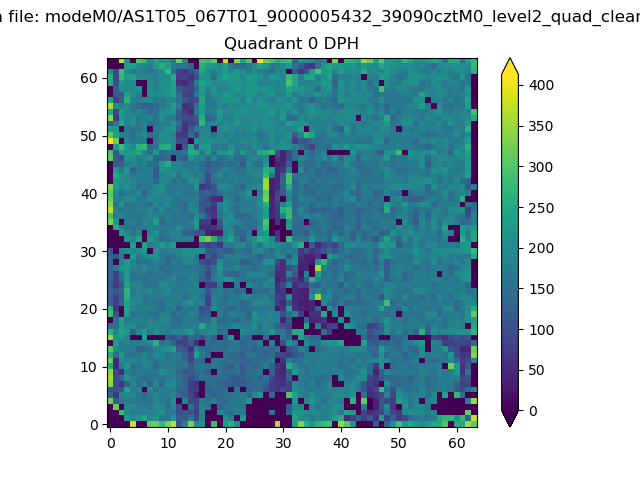 |
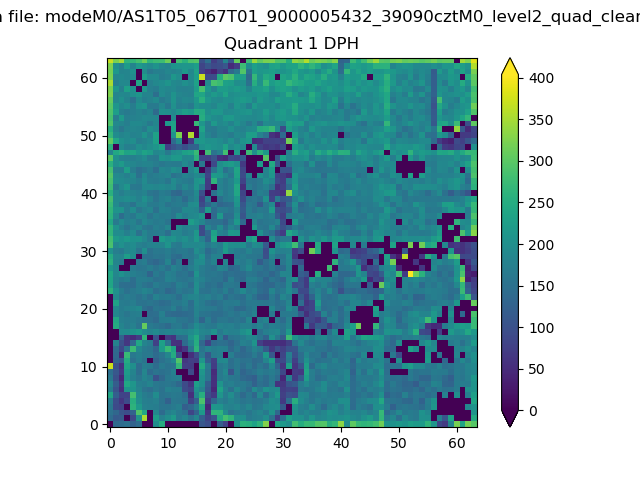 |
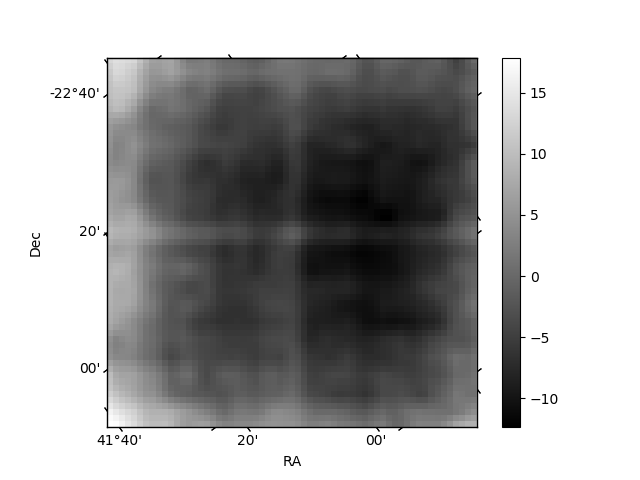
Quadrant B |
|---|---|---|---|
| Quadrant D | 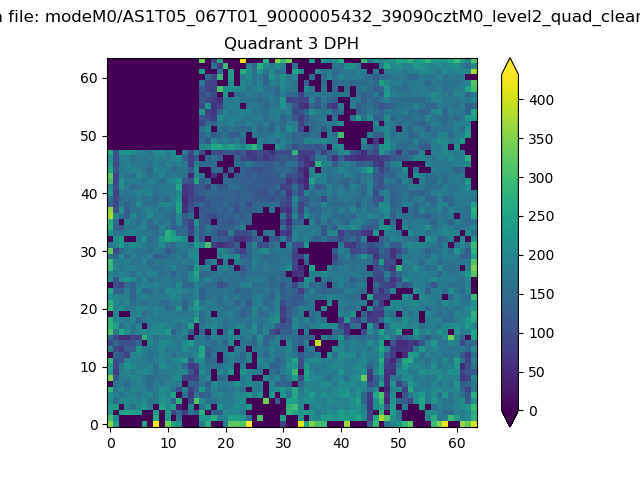 |
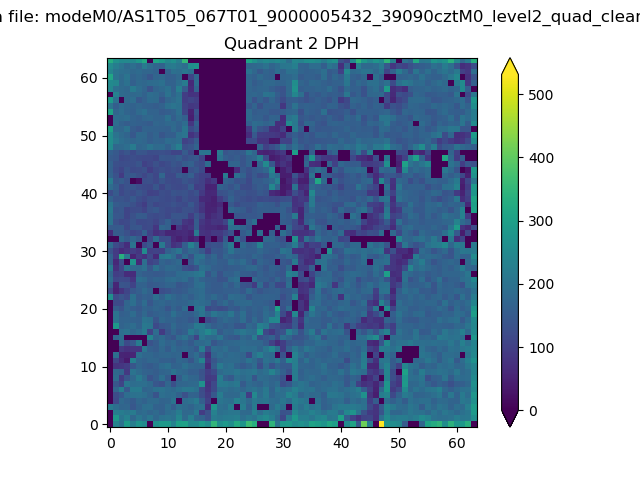 |
Quadrant C |
| Plot type | Count rate plots | Images |
|---|---|---|
| Comparison with Poisson distribution Blue bars denote a histogram of data divided into 1 sec bins. Red curve is a Poisson curve with rate = median count rate of data. |
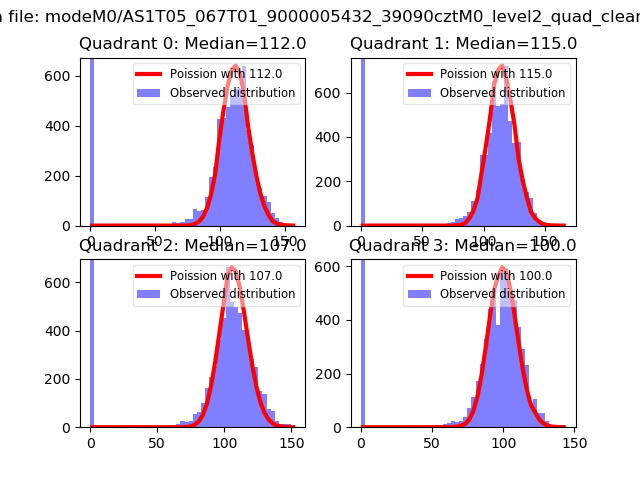 |
 |
| Quadrant-wise count rates Data is divided into 100 sec bins |
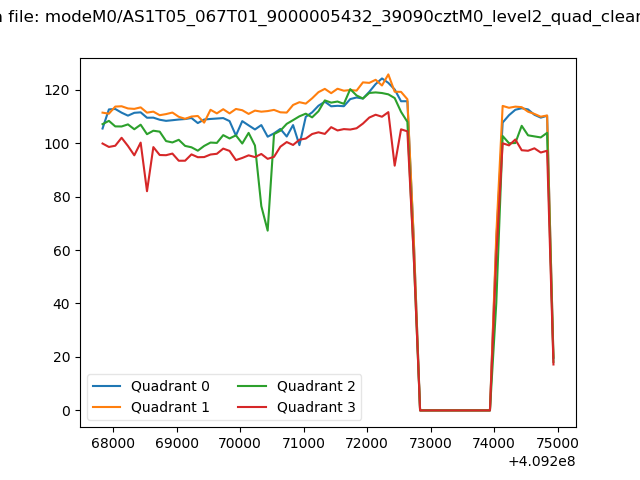 |
|
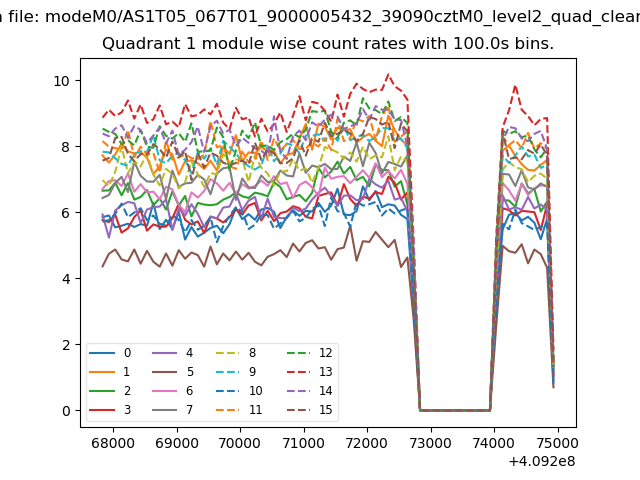
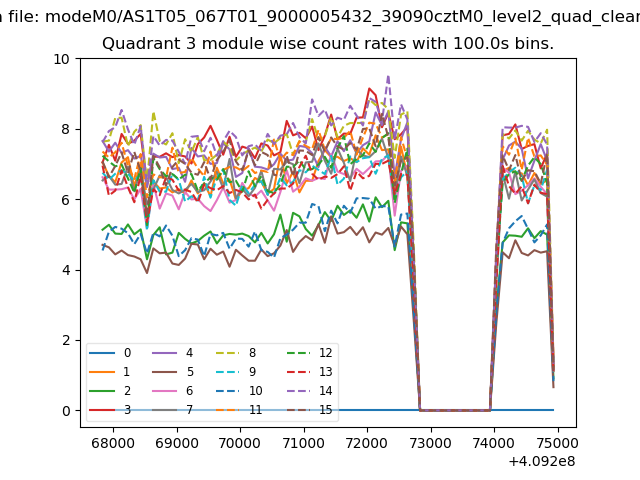
| Module-wise count rates for Quadrant A Data is divided into 100 sec bins |
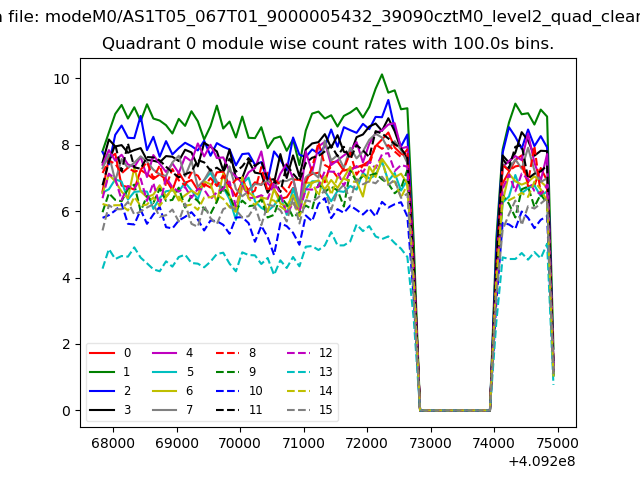 |
 |
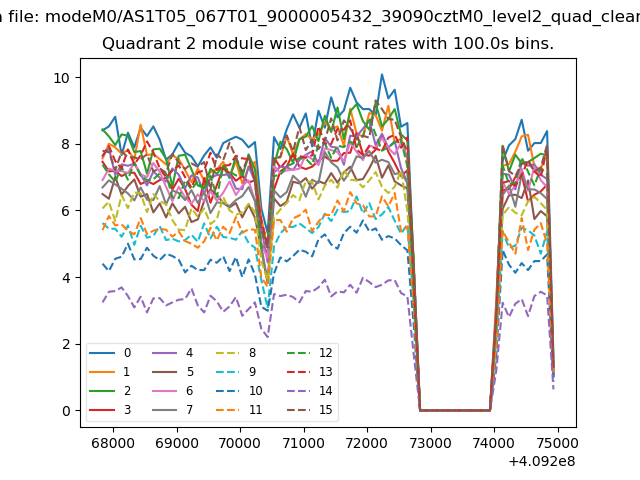
| Module-wise count rates for Quadrant B Data is divided into 100 sec bins |
 |
 |
| Module-wise count rates for Quadrant C Data is divided into 100 sec bins |
 |
 |
| Module-wise count rates for Quadrant D Data is divided into 100 sec bins |
 |
 |
| Parameter | Plot |
|---|---|
| CZT HV Monitor | 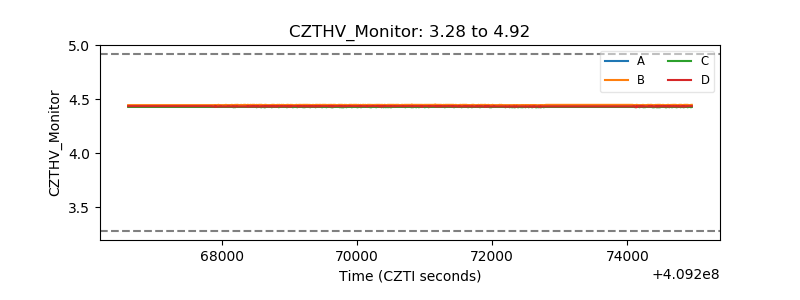 |
| D_VDD | 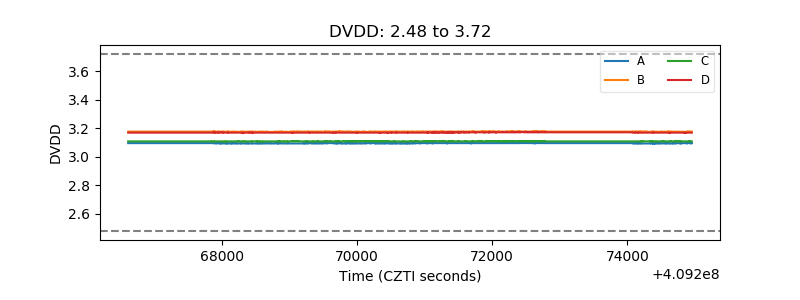 |
| Temperature 1 | 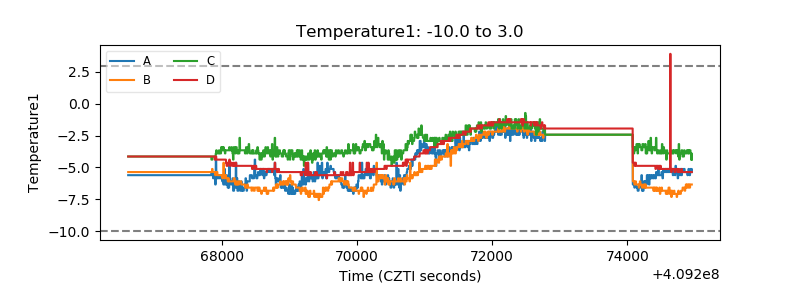 |
| Veto HV Monitor | 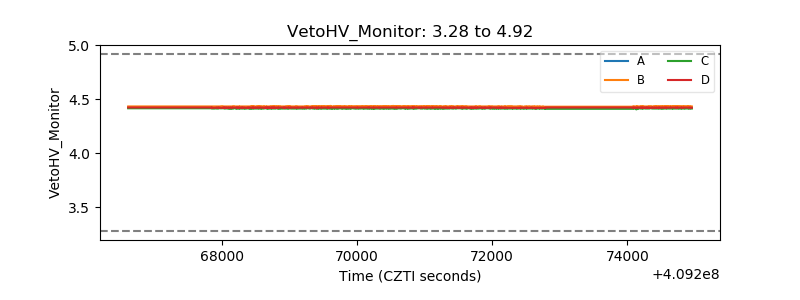 |
| Veto LLD | 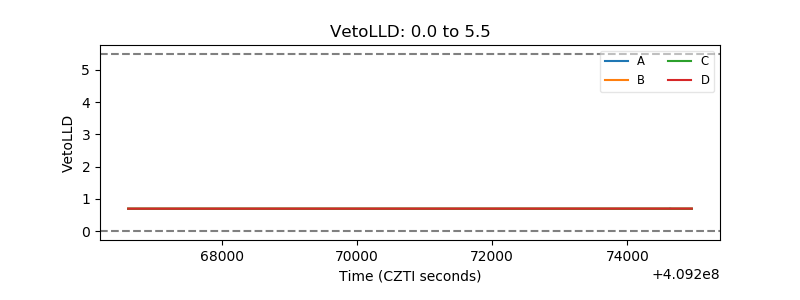 |
| Alpha Counter | 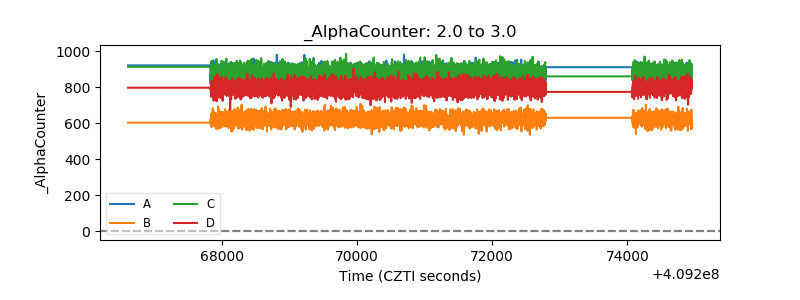 |
| _CPM_Rate | 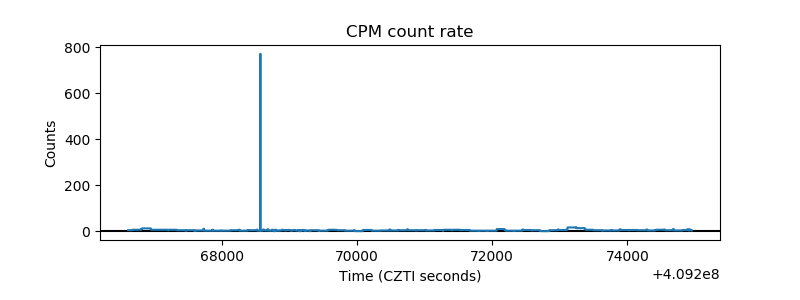 |
| CZT Counter | 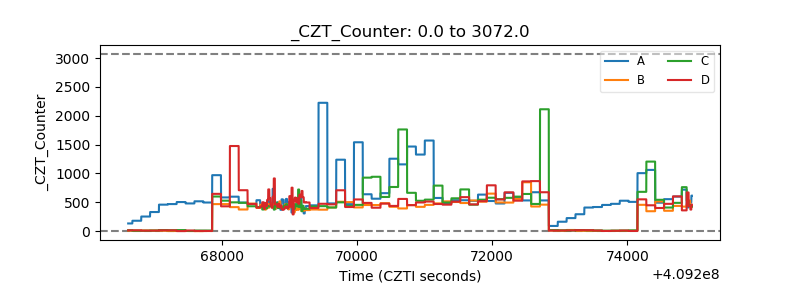 |
| +2.5 Volts monitor |  |
| +5 Volts monitor | 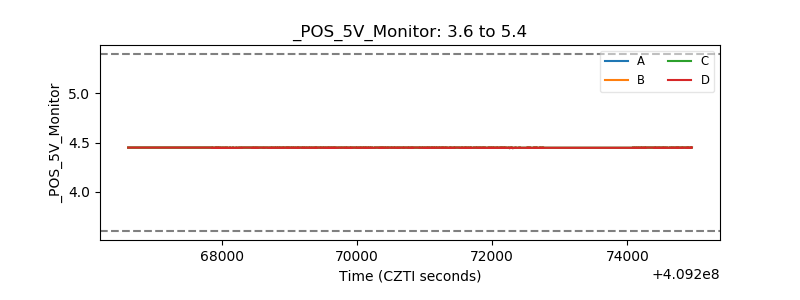 |
| _ROLL_ROT | 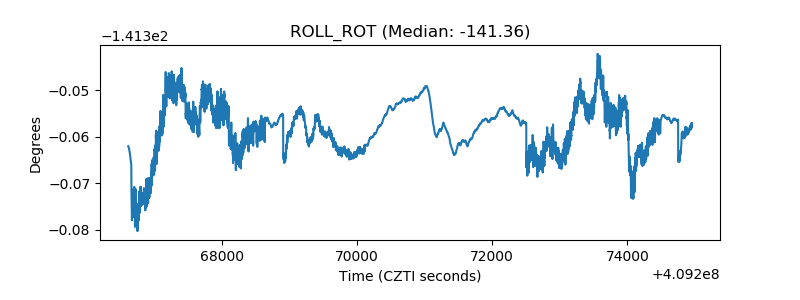 |
| _Roll_DEC | 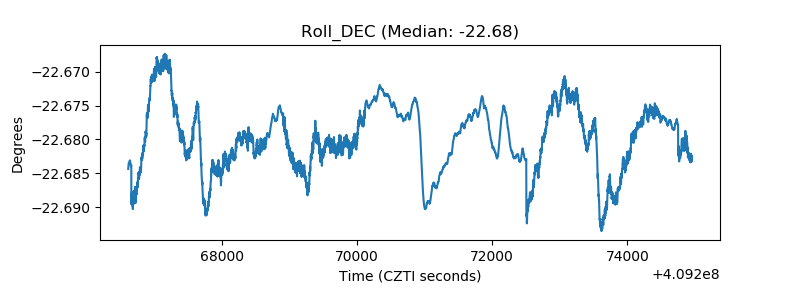 |
| _Roll_RA | 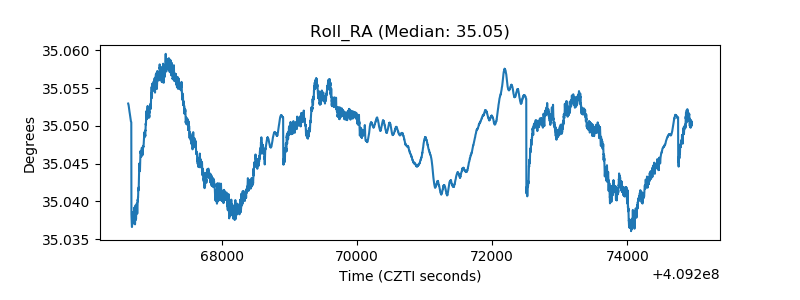 |
| Veto Counter | 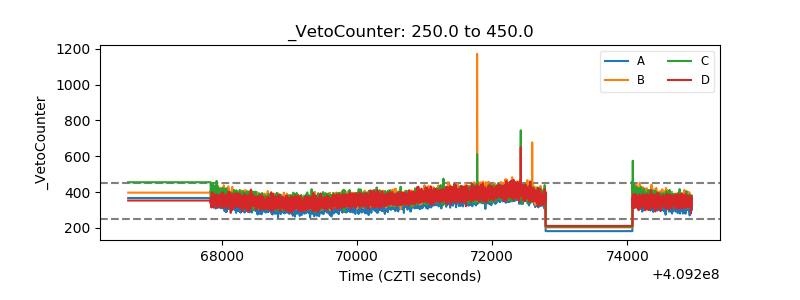 |