| Param | Original file | Final file |
|---|---|---|
| Filename | modeM0/AS1T05_067T01_9000005432_39093cztM0_level2.fits | modeM0/AS1T05_067T01_9000005432_39093cztM0_level2_quad_clean.evt |
| Size (bytes) | 1,070,596,800 | 266,273,280 |
| Size | 1021.0 MB | 253.9 MB |
| Events in quadrant A | 9,812,013 | 1,794,573 |
| Events in quadrant B | 7,765,552 | 1,836,548 |
| Events in quadrant C | 10,758,893 | 1,719,500 |
| Events in quadrant D | 10,031,527 | 1,586,345 |
| Mode M0 | |||
|---|---|---|---|
| Quadrant | BADHDUFLAG | Total packets | Discarded packets |
| A | 0 | 39622 | 4 |
| B | 0 | 33916 | 3 |
| C | 0 | 42150 | 3 |
| D | 0 | 40801 | 3 |
| Mode SS | |||
|---|---|---|---|
| Quadrant | BADHDUFLAG | Total packets | Discarded packets |
| A | 0 | 334 | 0 |
| B | 0 | 334 | 0 |
| C | 0 | 334 | 0 |
| D | 0 | 334 | 0 |
| Mode M9 | |||
|---|---|---|---|
| Quadrant | BADHDUFLAG | Total packets | Discarded packets |
| A | 0 | 55 | 0 |
| B | 0 | 55 | 0 |
| C | 0 | 55 | 0 |
| D | 0 | 55 | 0 |
| Quadrant | Total seconds | Saturated seconds | Saturation percentage |
|---|---|---|---|
| A | 16314 | 77 | 0.471987% |
| B | 16314 | 98 | 0.600711% |
| C | 16314 | 322 | 1.973765% |
| D | 16314 | 344 | 2.108618% |
Noise dominated data is calculated using 1-second bins in cleaned event files. If a bin has >2000 counts, and if more than 50% of those come from <1% of pixels, then it is considered to be noise-dominated and hence unusable.
| Quadrant | # 1 sec bins | Bins with >0 counts | Bins with >2000 counts | High rate bins dominated by noise | Noise dominated (total time) | Noise dominated (detector-on time) | Marked lightcurve |
|---|---|---|---|---|---|---|---|
| A | 21777 | 16318 | 26 | 26 | 0.12% | 0.16% | 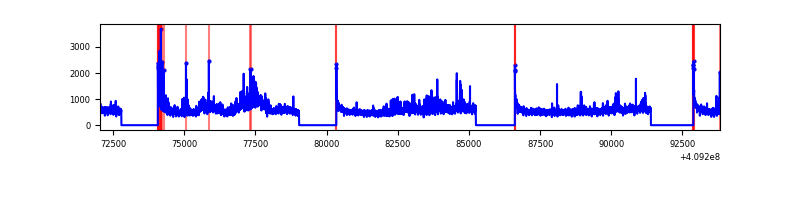 |
| B | 21777 | 16318 | 51 | 51 | 0.23% | 0.31% | 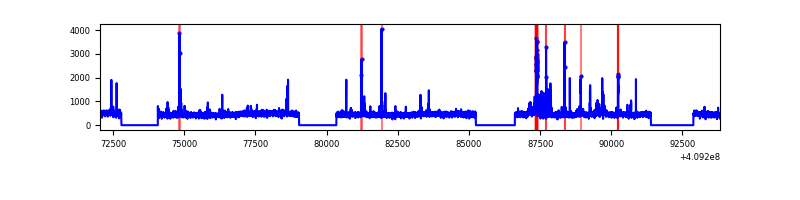 |
| C | 21777 | 16318 | 267 | 267 | 1.23% | 1.64% | 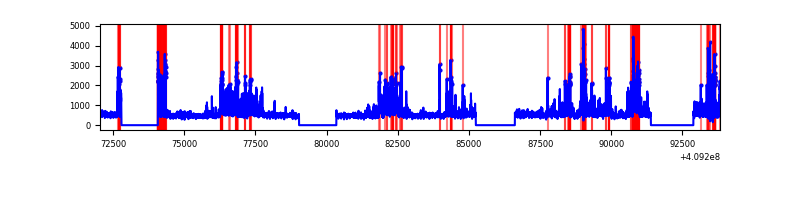 |
| D | 21777 | 16318 | 281 | 281 | 1.29% | 1.72% | 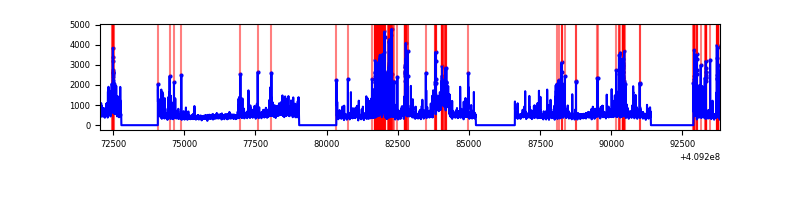 |
Top three noisy pixels from each quadrant. If the there are fewer than three noisy pixels in the level2.evt file, extra rows are filled as -1
| Pixel properties | Quadrant properties | ||||||
|---|---|---|---|---|---|---|---|
| Quadrant | DetID | PixID | Counts | Sigma | Mean | Median | Sigma |
| A | 15 | 223 | 1124300 | 3020.4 | 1840 | 1803 | 371.6 |
| A | 10 | 83 | 1088682 | 2924.55 | 1840 | 1803 | 371.6 |
| A | 12 | 16 | 285782 | 764.13 | 1840 | 1803 | 371.6 |
| B | 5 | 184 | 311016 | 882.24 | 1825 | 1774 | 350.5 |
| B | 5 | 172 | 119826 | 336.79 | 1825 | 1774 | 350.5 |
| B | 0 | 230 | 89789 | 251.1 | 1825 | 1774 | 350.5 |
| C | 15 | 208 | 2612038 | 6357.67 | 1774 | 1785 | 410.6 |
| C | 15 | 214 | 671934 | 1632.25 | 1774 | 1785 | 410.6 |
| C | 9 | 187 | 495173 | 1201.72 | 1774 | 1785 | 410.6 |
| D | 12 | 235 | 1269255 | 2938.23 | 1772 | 1721 | 431.4 |
| D | 2 | 249 | 1139289 | 2636.96 | 1772 | 1721 | 431.4 |
| D | 1 | 47 | 327062 | 754.16 | 1772 | 1721 | 431.4 |
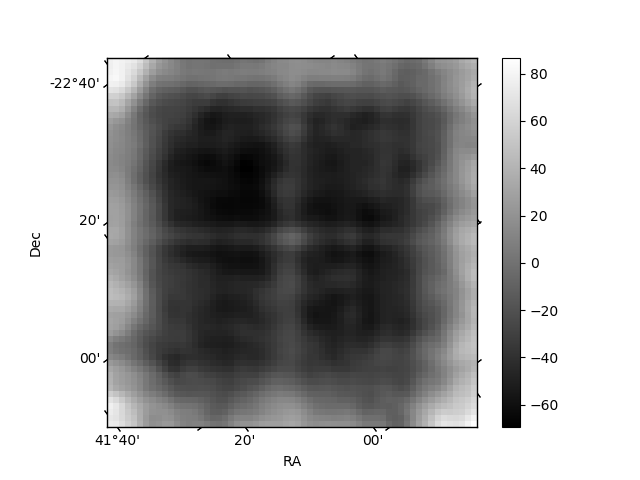
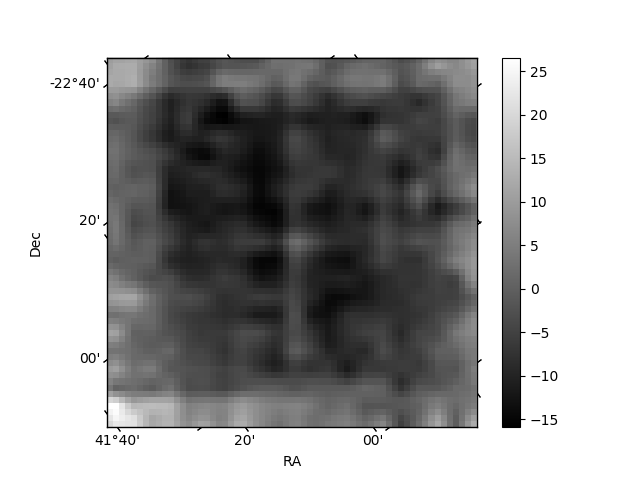
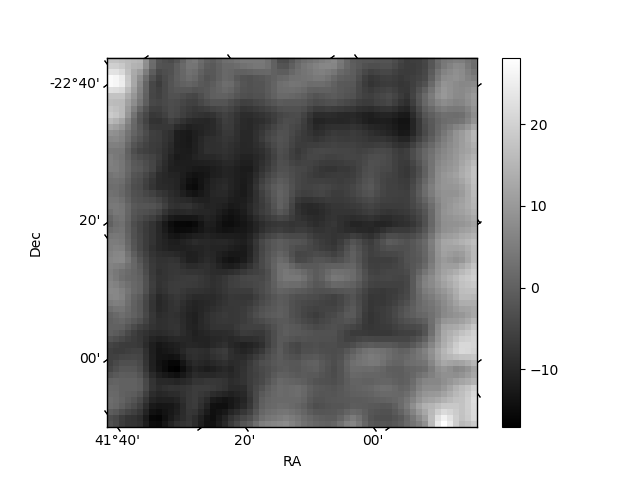
Histogram calculated using DETX and DETY for each event in the final _common_clean file
| Quadrant A | 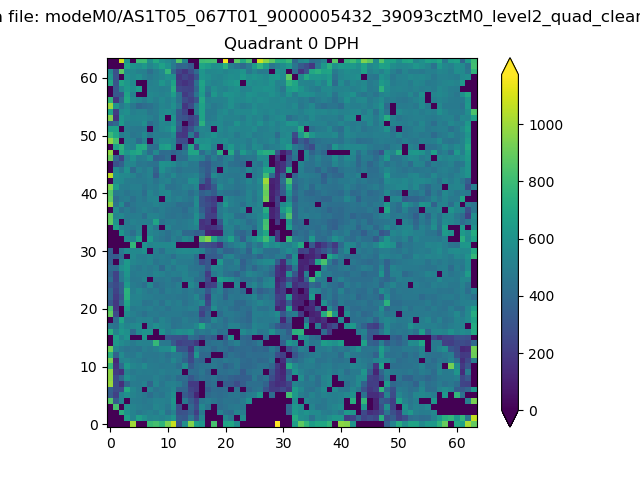 |
 |
Quadrant B |
|---|---|---|---|
| Quadrant D | 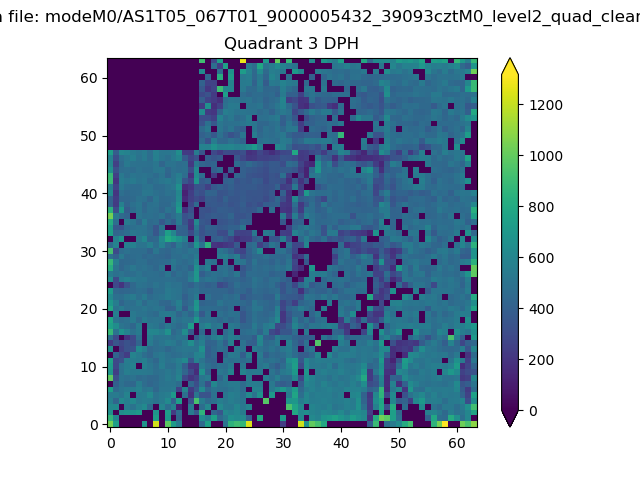 |
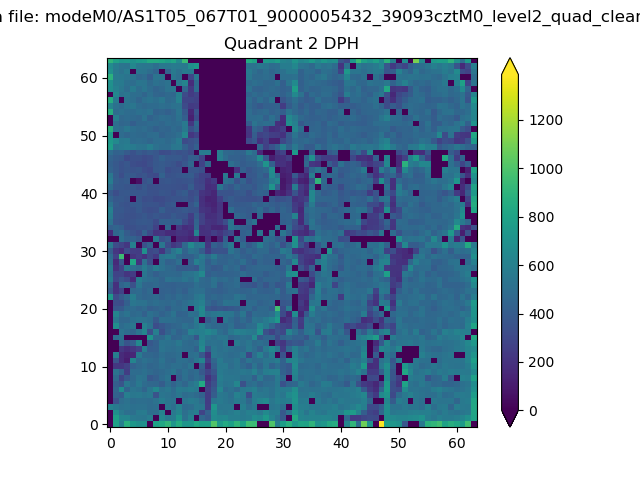 |
Quadrant C |
| Plot type | Count rate plots | Images |
|---|---|---|
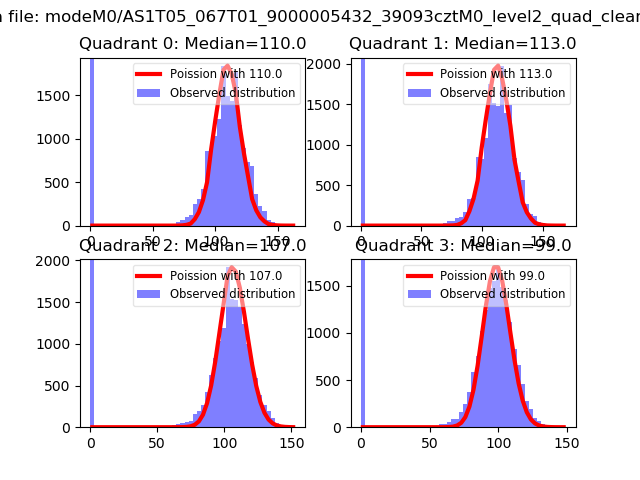
| Comparison with Poisson distribution Blue bars denote a histogram of data divided into 1 sec bins. Red curve is a Poisson curve with rate = median count rate of data. |
 |
 |
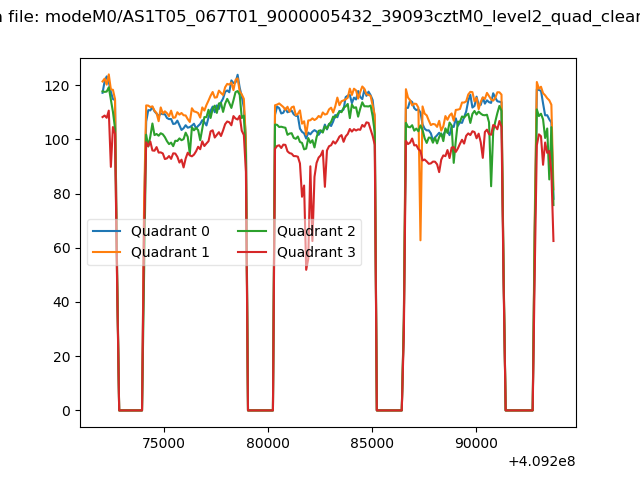
| Quadrant-wise count rates Data is divided into 100 sec bins |
 |
|
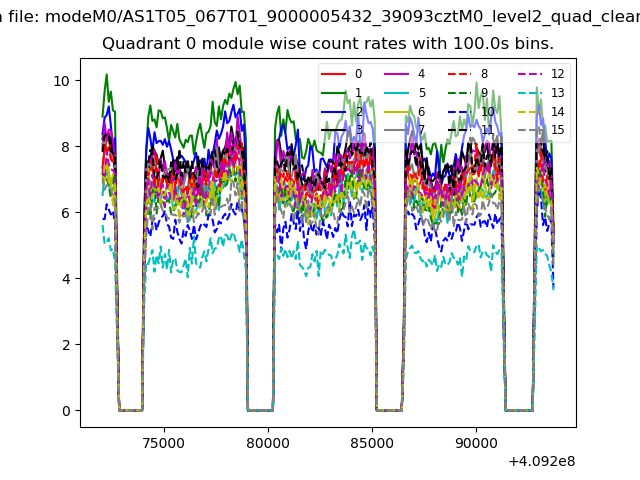
| Module-wise count rates for Quadrant A Data is divided into 100 sec bins |
 |
 |
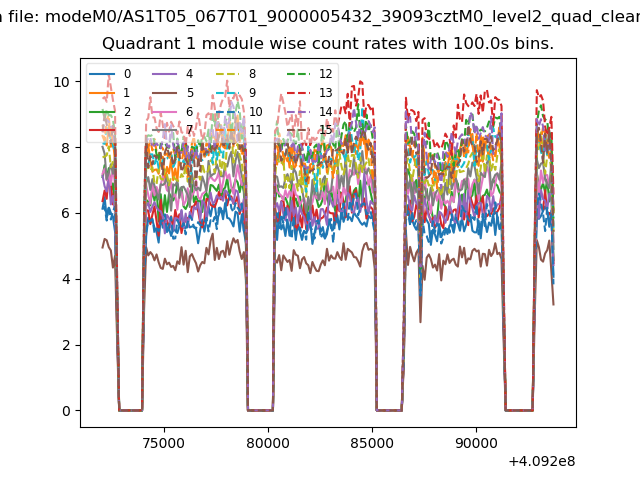
| Module-wise count rates for Quadrant B Data is divided into 100 sec bins |
 |
 |
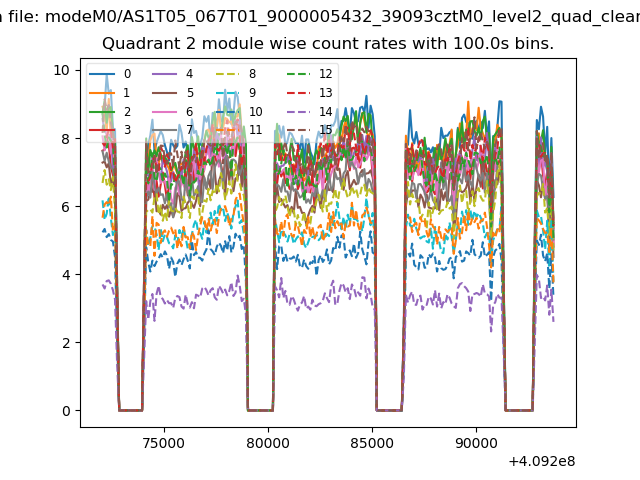
| Module-wise count rates for Quadrant C Data is divided into 100 sec bins |
 |
 |
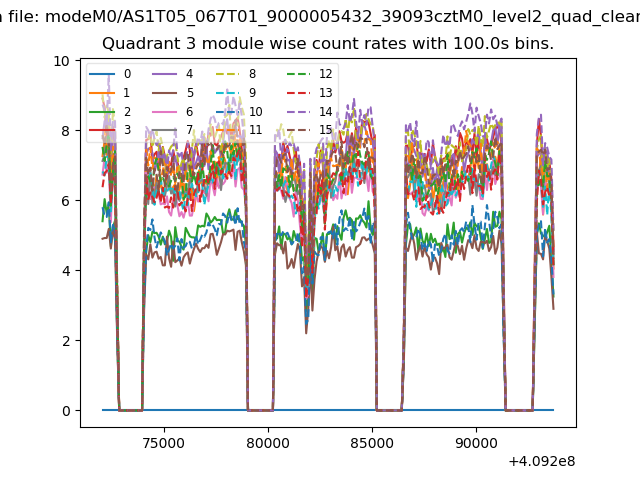
| Module-wise count rates for Quadrant D Data is divided into 100 sec bins |
 |
 |
| Parameter | Plot |
|---|---|
| CZT HV Monitor | 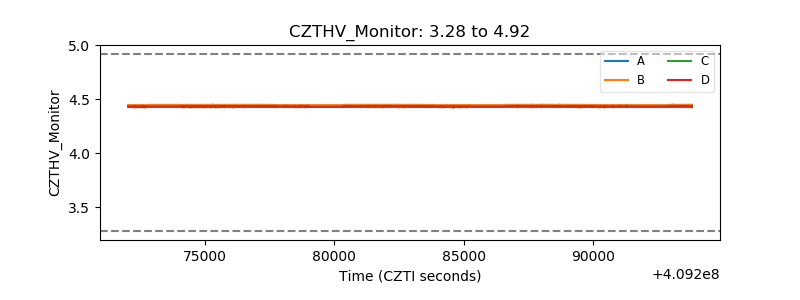 |
| D_VDD | 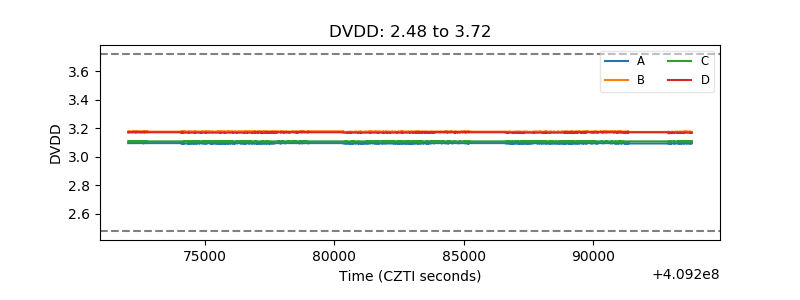 |
| Temperature 1 | 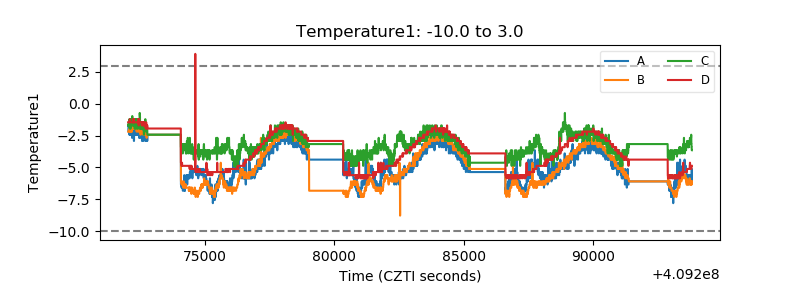 |
| Veto HV Monitor | 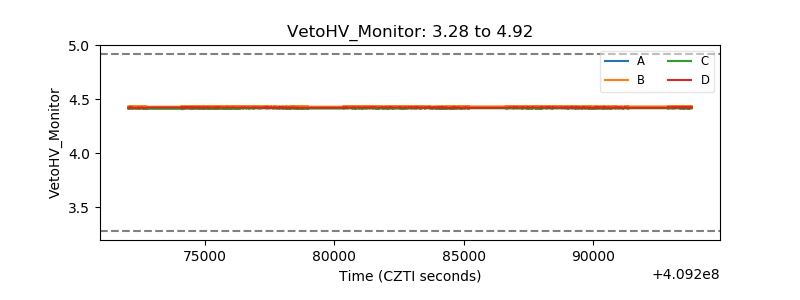 |
| Veto LLD | 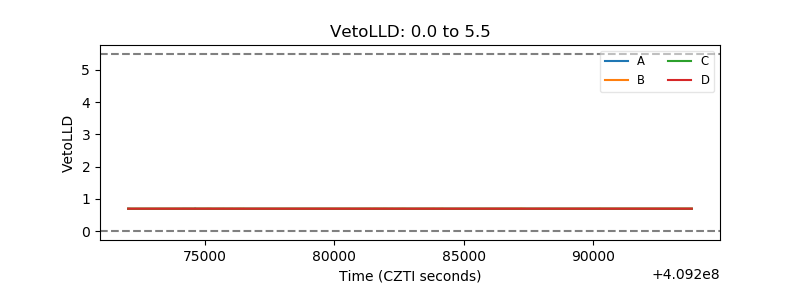 |
| Alpha Counter | 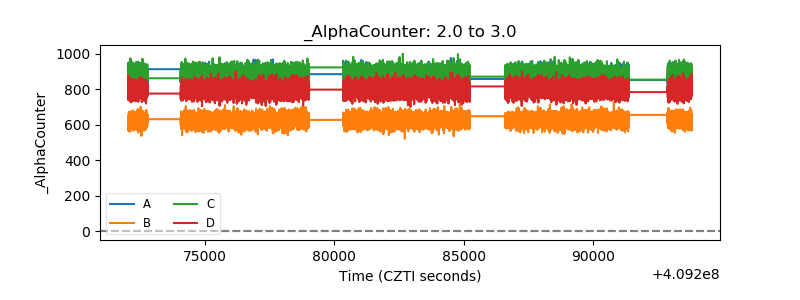 |
| _CPM_Rate | 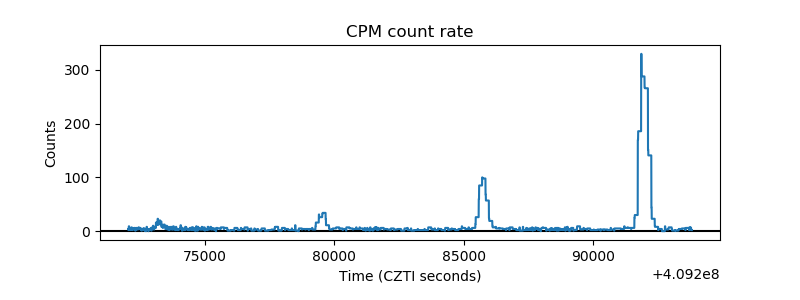 |
| CZT Counter | 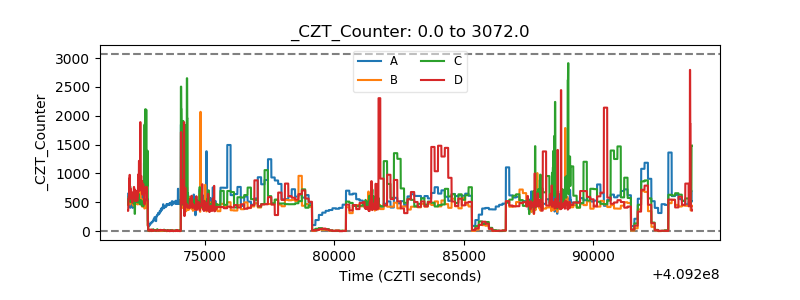 |
| +2.5 Volts monitor | 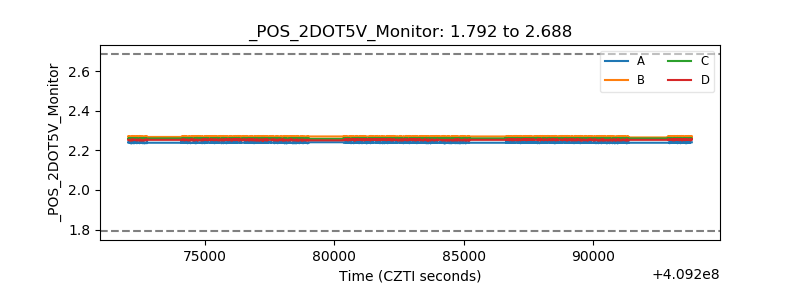 |
| +5 Volts monitor | 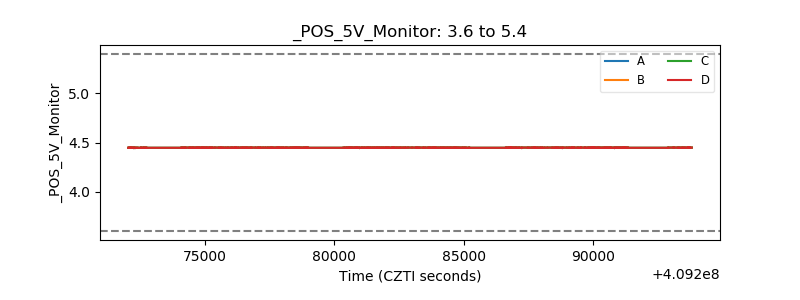 |
| _ROLL_ROT | 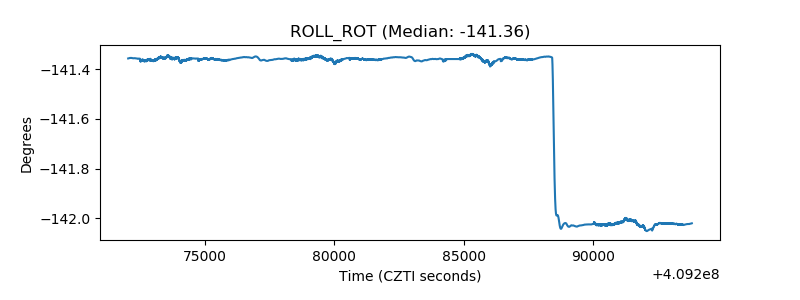 |
| _Roll_DEC | 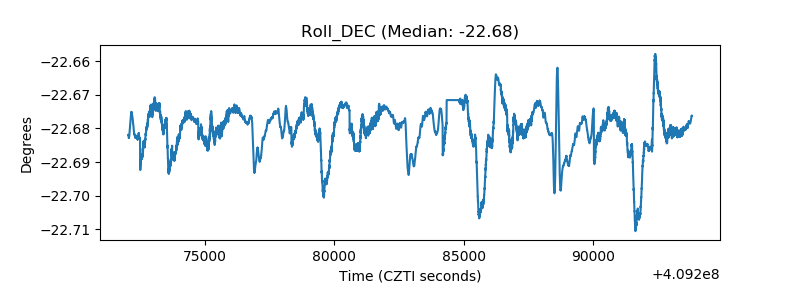 |
| _Roll_RA | 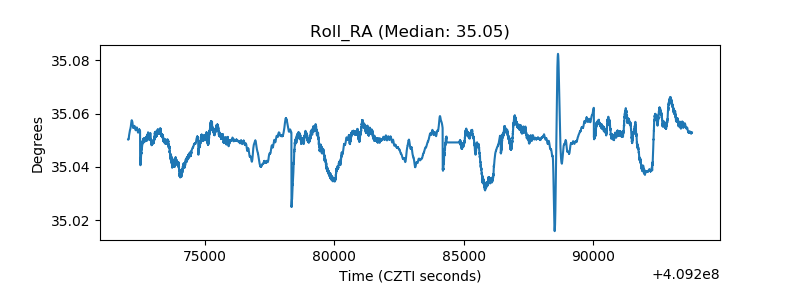 |
| Veto Counter | 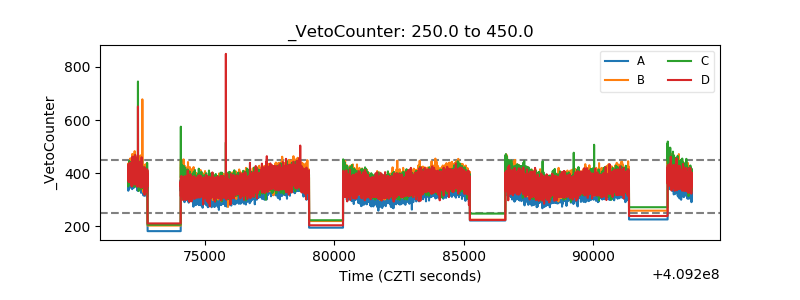 |