| Param | Original file | Final file |
|---|---|---|
| Filename | modeM0/AS1T05_067T01_9000005432_39094cztM0_level2.fits | modeM0/AS1T05_067T01_9000005432_39094cztM0_level2_quad_clean.evt |
| Size (bytes) | 382,734,720 | 92,833,920 |
| Size | 365.0 MB | 88.5 MB |
| Events in quadrant A | 3,504,375 | 623,194 |
| Events in quadrant B | 2,912,302 | 644,309 |
| Events in quadrant C | 3,500,393 | 603,781 |
| Events in quadrant D | 3,818,148 | 550,435 |
| Mode M0 | |||
|---|---|---|---|
| Quadrant | BADHDUFLAG | Total packets | Discarded packets |
| A | 0 | 13982 | 3 |
| B | 0 | 12352 | 2 |
| C | 0 | 13853 | 2 |
| D | 0 | 15126 | 2 |
| Mode SS | |||
|---|---|---|---|
| Quadrant | BADHDUFLAG | Total packets | Discarded packets |
| A | 0 | 114 | 0 |
| B | 0 | 114 | 0 |
| C | 0 | 114 | 0 |
| D | 0 | 114 | 0 |
| Mode M9 | |||
|---|---|---|---|
| Quadrant | BADHDUFLAG | Total packets | Discarded packets |
| A | 0 | 24 | 0 |
| B | 0 | 24 | 0 |
| C | 0 | 24 | 0 |
| D | 0 | 25 | 0 |
| Quadrant | Total seconds | Saturated seconds | Saturation percentage |
|---|---|---|---|
| A | 5562 | 32 | 0.575333% |
| B | 5562 | 36 | 0.647249% |
| C | 5562 | 80 | 1.438332% |
| D | 5562 | 172 | 3.092413% |
Noise dominated data is calculated using 1-second bins in cleaned event files. If a bin has >2000 counts, and if more than 50% of those come from <1% of pixels, then it is considered to be noise-dominated and hence unusable.
| Quadrant | # 1 sec bins | Bins with >0 counts | Bins with >2000 counts | High rate bins dominated by noise | Noise dominated (total time) | Noise dominated (detector-on time) | Marked lightcurve |
|---|---|---|---|---|---|---|---|
| A | 7175 | 5563 | 10 | 10 | 0.14% | 0.18% | 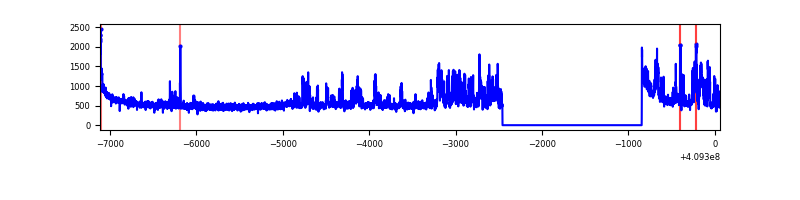 |
| B | 7175 | 5563 | 18 | 18 | 0.25% | 0.32% | 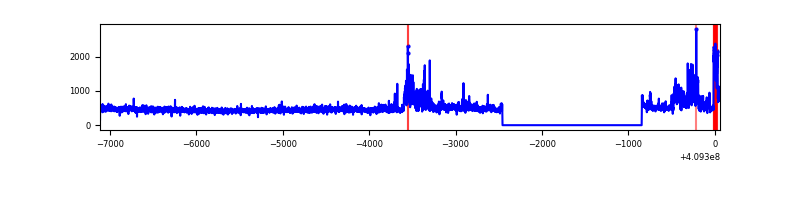 |
| C | 7175 | 5563 | 65 | 65 | 0.91% | 1.17% | 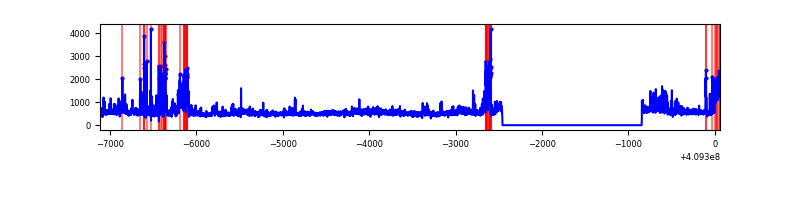 |
| D | 7175 | 5563 | 126 | 126 | 1.76% | 2.26% | 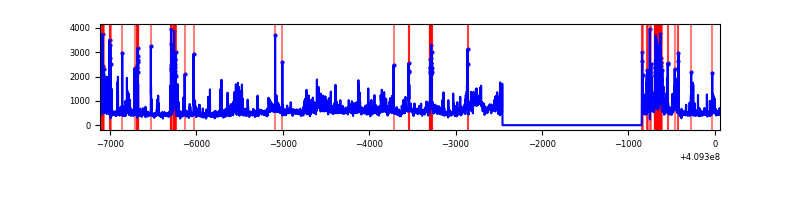 |
Top three noisy pixels from each quadrant. If the there are fewer than three noisy pixels in the level2.evt file, extra rows are filled as -1
| Pixel properties | Quadrant properties | ||||||
|---|---|---|---|---|---|---|---|
| Quadrant | DetID | PixID | Counts | Sigma | Mean | Median | Sigma |
| A | 12 | 16 | 508364 | 4008.05 | 625 | 611 | 126.7 |
| A | 10 | 83 | 412104 | 3248.21 | 625 | 611 | 126.7 |
| A | 12 | 194 | 72683 | 568.92 | 625 | 611 | 126.7 |
| B | 5 | 184 | 415901 | 3432.48 | 623 | 607 | 121.0 |
| B | 0 | 230 | 32630 | 264.68 | 623 | 607 | 121.0 |
| B | 12 | 111 | 15422 | 122.45 | 623 | 607 | 121.0 |
| C | 15 | 208 | 688410 | 4813.79 | 607 | 611 | 142.9 |
| C | 15 | 214 | 236186 | 1648.75 | 607 | 611 | 142.9 |
| C | 9 | 187 | 156494 | 1091.0 | 607 | 611 | 142.9 |
| D | 12 | 227 | 539368 | 3697.83 | 601 | 584 | 145.7 |
| D | 2 | 249 | 427076 | 2927.14 | 601 | 584 | 145.7 |
| D | 1 | 47 | 166768 | 1140.57 | 601 | 584 | 145.7 |
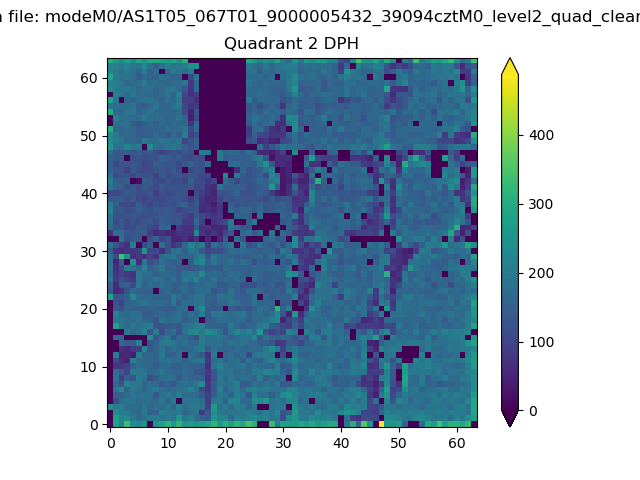
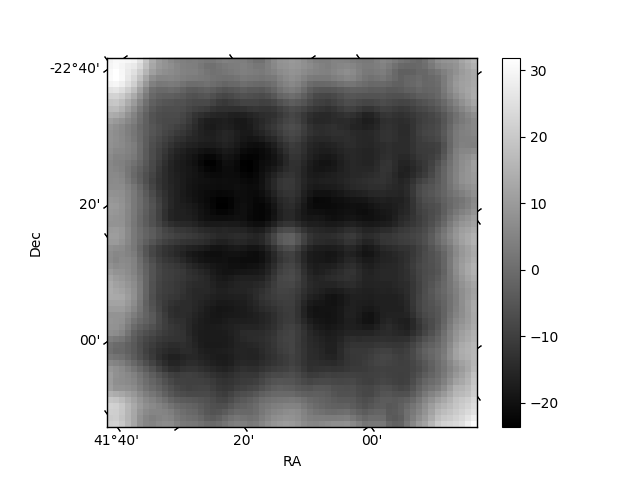
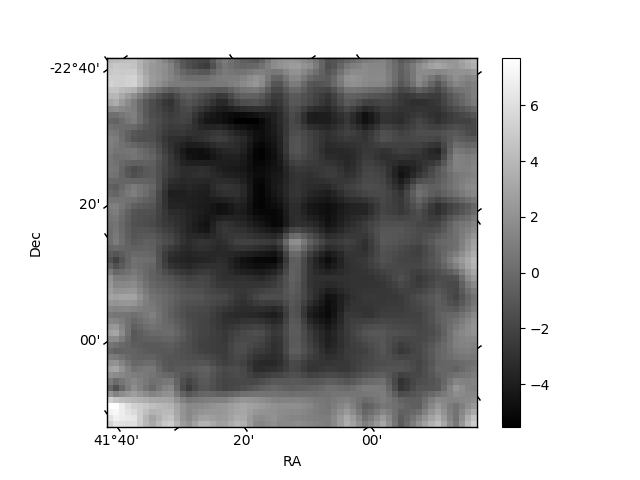
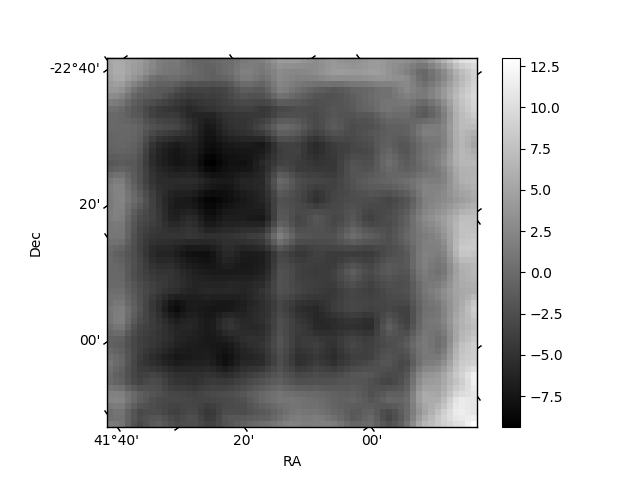
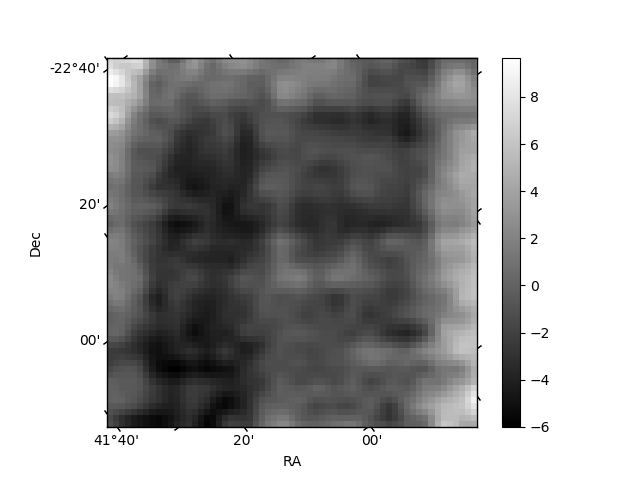
Histogram calculated using DETX and DETY for each event in the final _common_clean file
| Quadrant A | 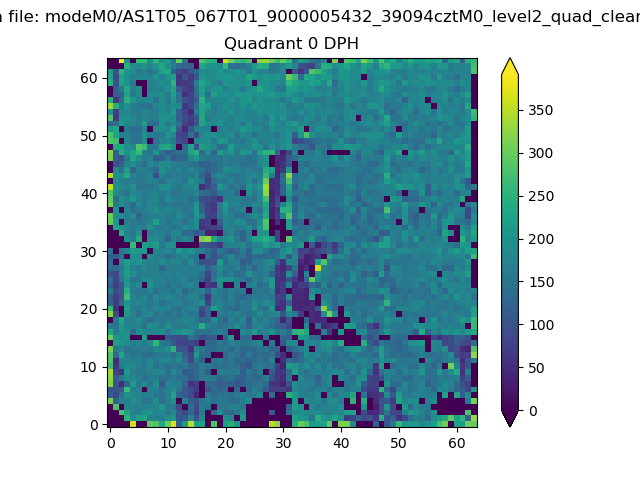 |
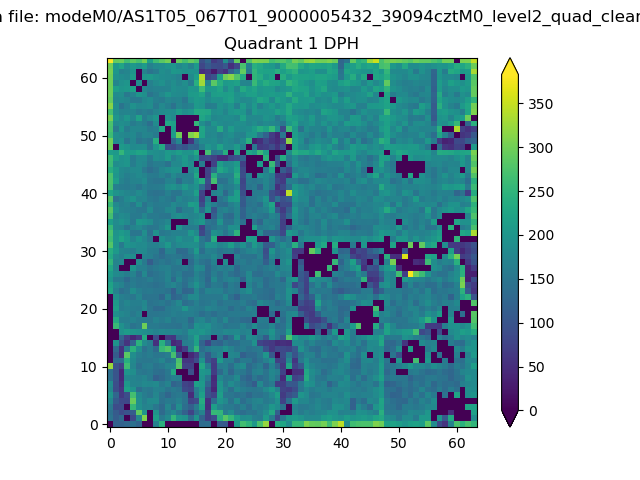 |
Quadrant B |
|---|---|---|---|
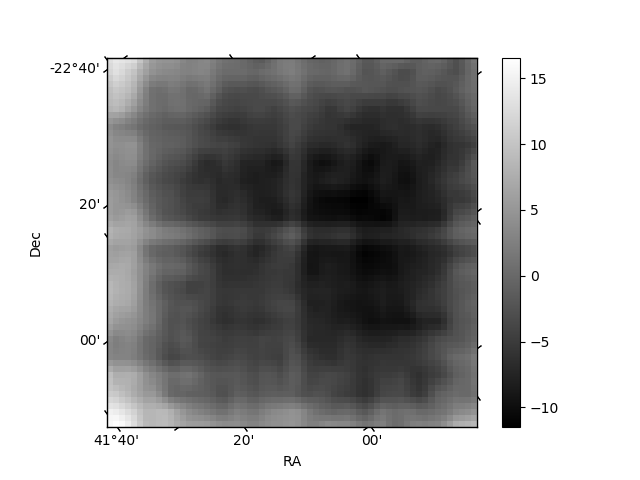
| Quadrant D | 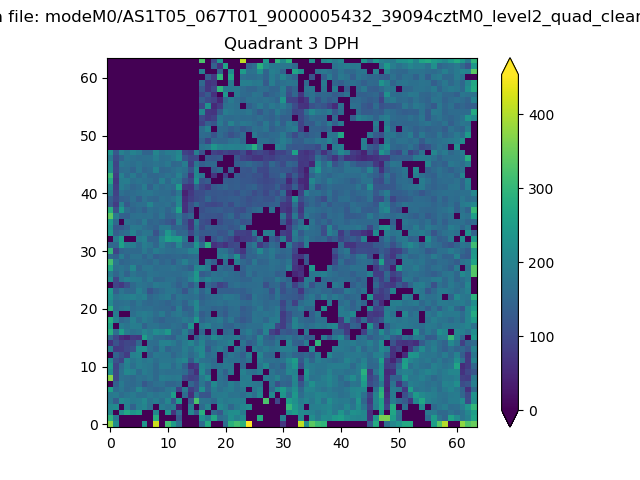 |
 |
Quadrant C |
| Plot type | Count rate plots | Images |
|---|---|---|
| Comparison with Poisson distribution Blue bars denote a histogram of data divided into 1 sec bins. Red curve is a Poisson curve with rate = median count rate of data. |
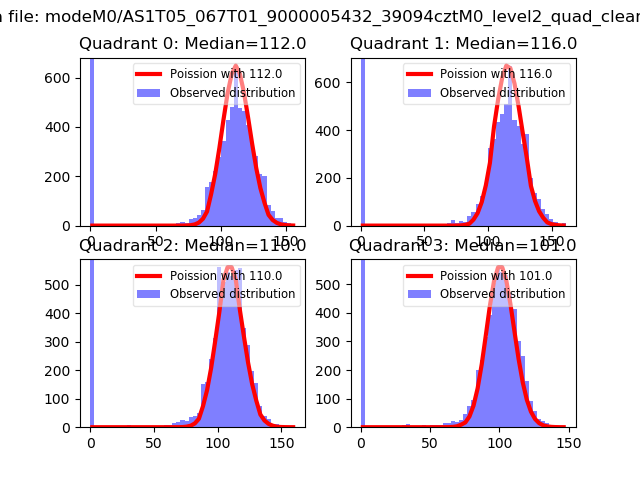 |
 |
| Quadrant-wise count rates Data is divided into 100 sec bins |
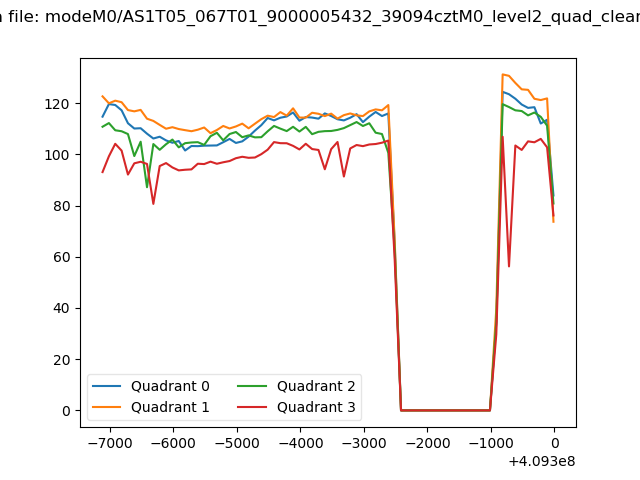 |
|
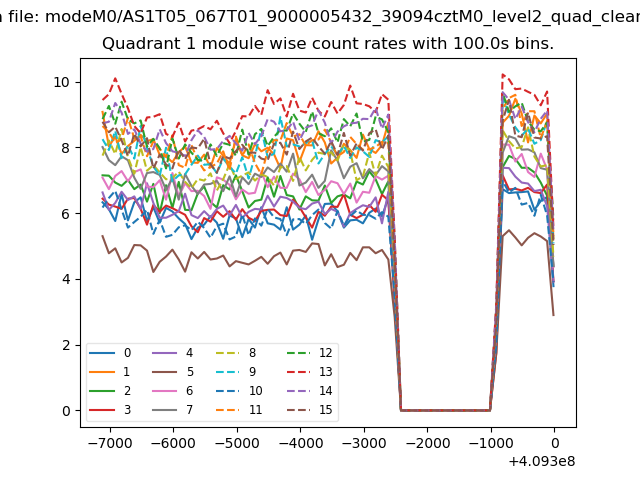
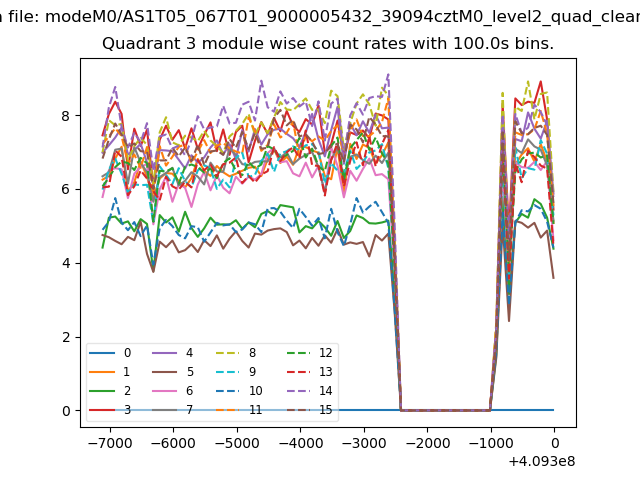
| Module-wise count rates for Quadrant A Data is divided into 100 sec bins |
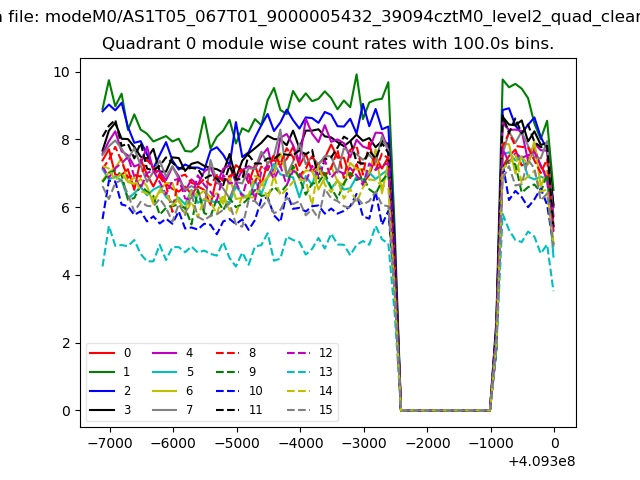 |
 |
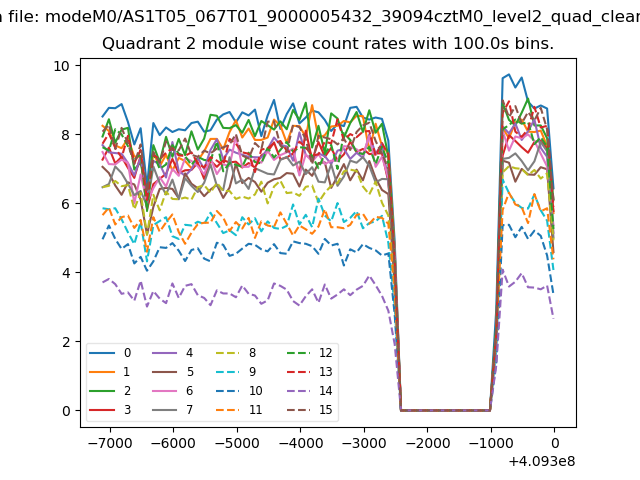
| Module-wise count rates for Quadrant B Data is divided into 100 sec bins |
 |
 |
| Module-wise count rates for Quadrant C Data is divided into 100 sec bins |
 |
 |
| Module-wise count rates for Quadrant D Data is divided into 100 sec bins |
 |
 |
| Parameter | Plot |
|---|---|
| CZT HV Monitor |  |
| D_VDD | 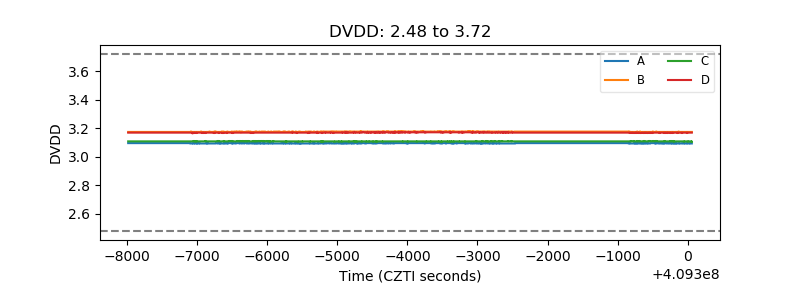 |
| Temperature 1 | 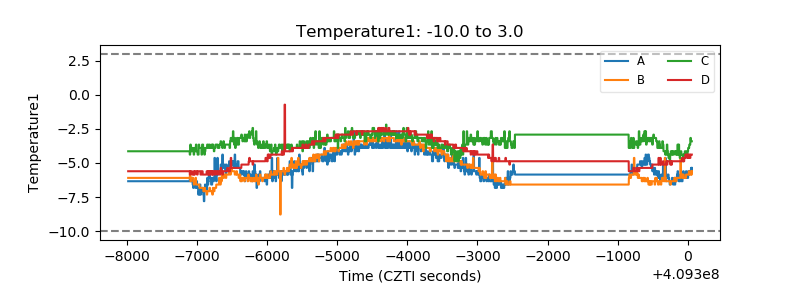 |
| Veto HV Monitor | 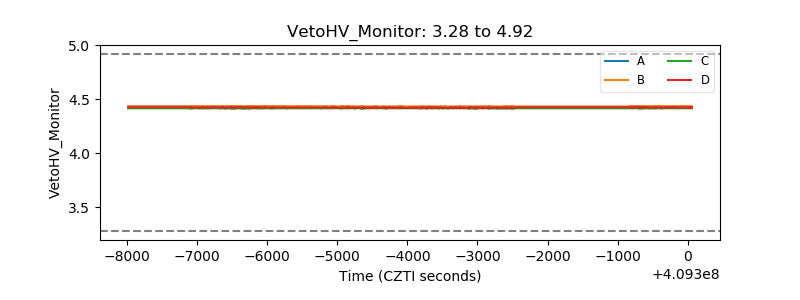 |
| Veto LLD | 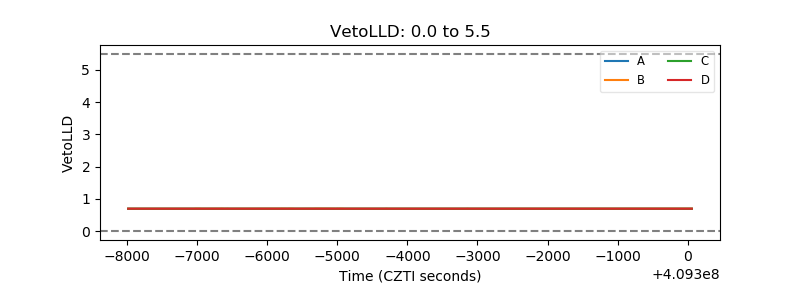 |
| Alpha Counter | 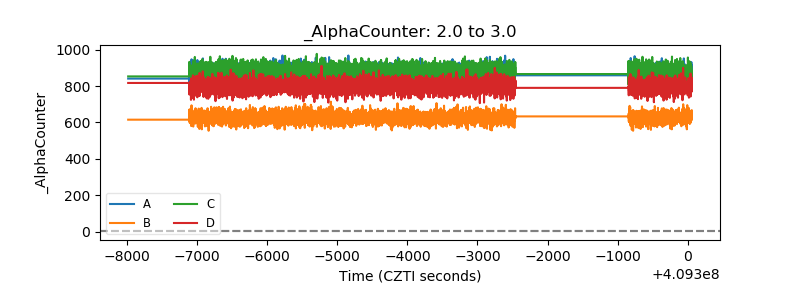 |
| _CPM_Rate | 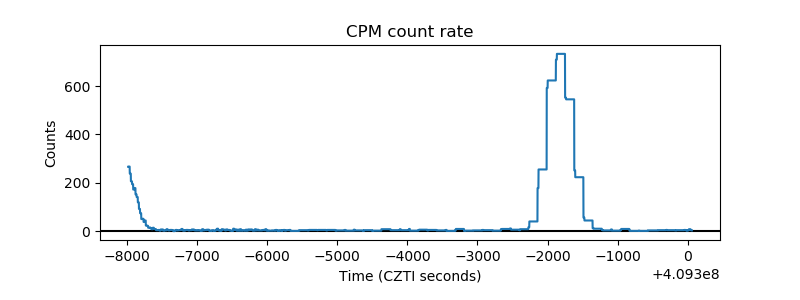 |
| CZT Counter | 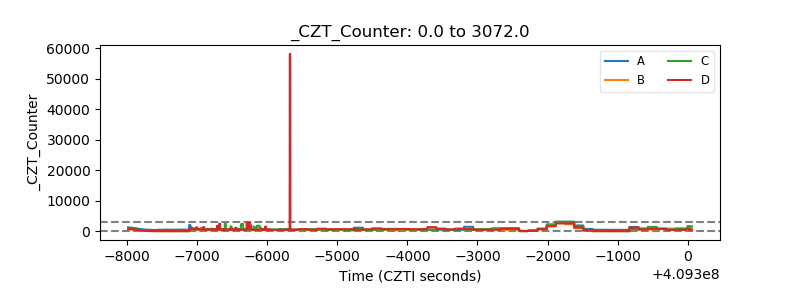 |
| +2.5 Volts monitor | 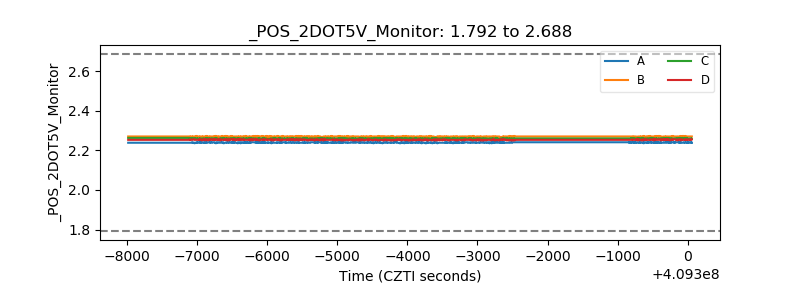 |
| +5 Volts monitor | 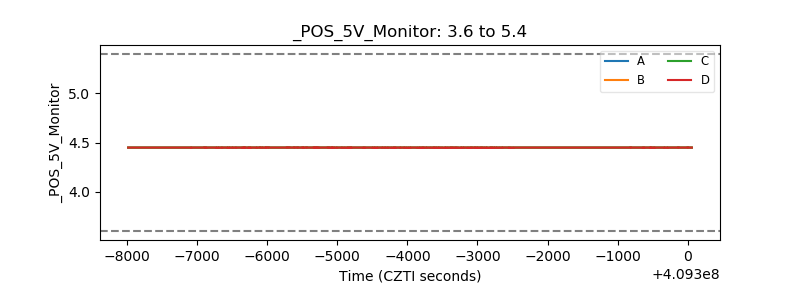 |
| _ROLL_ROT | 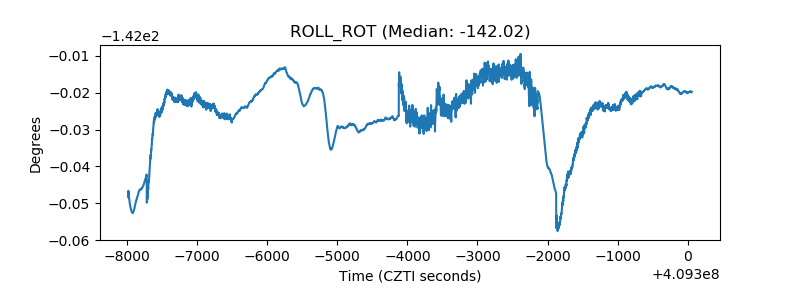 |
| _Roll_DEC | 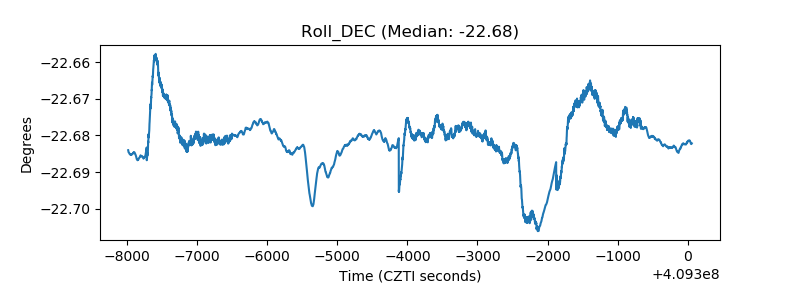 |
| _Roll_RA | 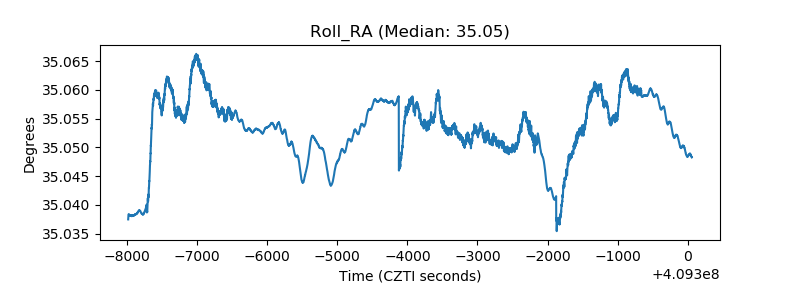 |
| Veto Counter | 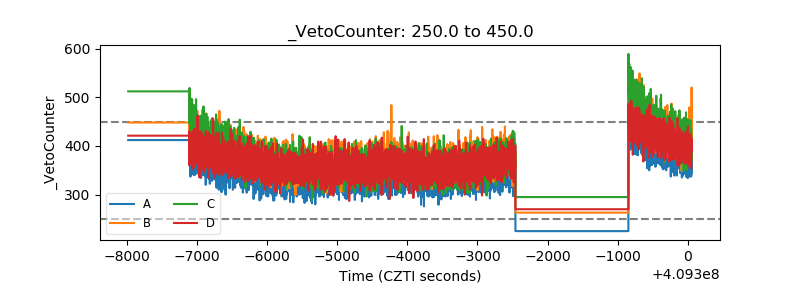 |