| Param | Original file | Final file |
|---|---|---|
| Filename | modeM0/AS1T05_067T01_9000005432_39097cztM0_level2.fits | modeM0/AS1T05_067T01_9000005432_39097cztM0_level2_quad_clean.evt |
| Size (bytes) | 351,146,880 | 95,967,360 |
| Size | 334.9 MB | 91.5 MB |
| Events in quadrant A | 3,365,707 | 652,814 |
| Events in quadrant B | 2,754,267 | 672,160 |
| Events in quadrant C | 3,367,874 | 634,171 |
| Events in quadrant D | 3,105,005 | 581,939 |
| Mode M0 | |||
|---|---|---|---|
| Quadrant | BADHDUFLAG | Total packets | Discarded packets |
| A | 0 | 13374 | 3 |
| B | 0 | 11375 | 2 |
| C | 0 | 13345 | 2 |
| D | 0 | 12556 | 2 |
| Mode SS | |||
|---|---|---|---|
| Quadrant | BADHDUFLAG | Total packets | Discarded packets |
| A | 0 | 106 | 0 |
| B | 0 | 106 | 0 |
| C | 0 | 106 | 0 |
| D | 0 | 106 | 0 |
| Mode M9 | |||
|---|---|---|---|
| Quadrant | BADHDUFLAG | Total packets | Discarded packets |
| A | 0 | 27 | 0 |
| B | 0 | 27 | 0 |
| C | 0 | 27 | 0 |
| D | 0 | 28 | 0 |
| Quadrant | Total seconds | Saturated seconds | Saturation percentage |
|---|---|---|---|
| A | 5212 | 21 | 0.402916% |
| B | 5212 | 64 | 1.227936% |
| C | 5212 | 29 | 0.556408% |
| D | 5212 | 91 | 1.745971% |
Noise dominated data is calculated using 1-second bins in cleaned event files. If a bin has >2000 counts, and if more than 50% of those come from <1% of pixels, then it is considered to be noise-dominated and hence unusable.
| Quadrant | # 1 sec bins | Bins with >0 counts | Bins with >2000 counts | High rate bins dominated by noise | Noise dominated (total time) | Noise dominated (detector-on time) | Marked lightcurve |
|---|---|---|---|---|---|---|---|
| A | 7095 | 5213 | 13 | 13 | 0.18% | 0.25% | 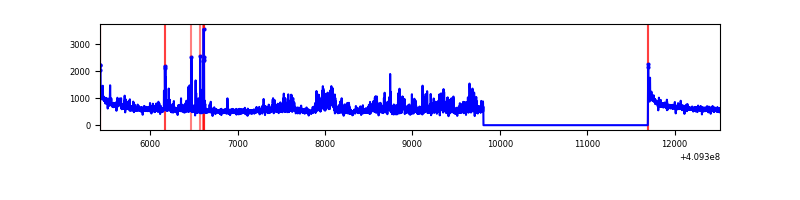 |
| B | 7095 | 5213 | 33 | 33 | 0.47% | 0.63% | 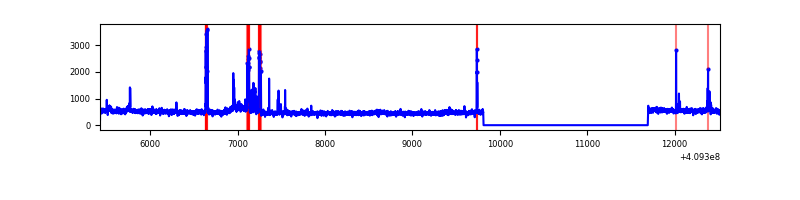 |
| C | 7095 | 5213 | 22 | 22 | 0.31% | 0.42% | 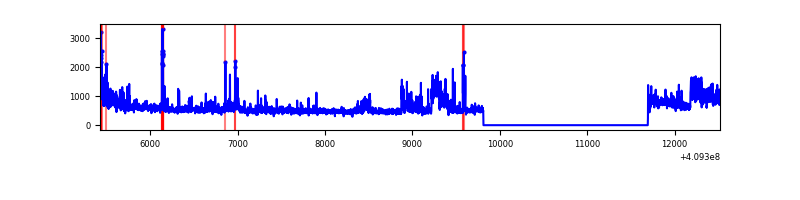 |
| D | 7095 | 5213 | 71 | 71 | 1.00% | 1.36% | 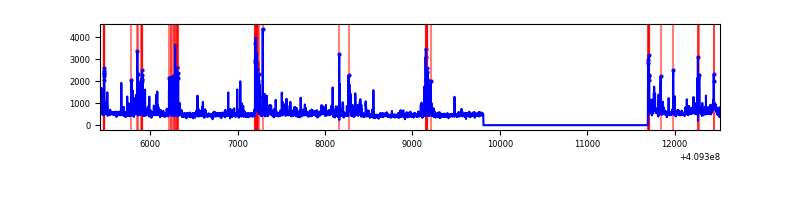 |
Top three noisy pixels from each quadrant. If the there are fewer than three noisy pixels in the level2.evt file, extra rows are filled as -1
| Pixel properties | Quadrant properties | ||||||
|---|---|---|---|---|---|---|---|
| Quadrant | DetID | PixID | Counts | Sigma | Mean | Median | Sigma |
| A | 10 | 83 | 407717 | 3216.08 | 626 | 614 | 126.6 |
| A | 12 | 16 | 383579 | 3025.39 | 626 | 614 | 126.6 |
| A | 7 | 3 | 72598 | 568.67 | 626 | 614 | 126.6 |
| B | 5 | 184 | 187115 | 1571.18 | 620 | 605 | 118.7 |
| B | 5 | 172 | 72409 | 604.88 | 620 | 605 | 118.7 |
| B | 0 | 230 | 33021 | 273.08 | 620 | 605 | 118.7 |
| C | 15 | 208 | 648829 | 4635.21 | 602 | 607 | 139.8 |
| C | 15 | 214 | 224473 | 1600.79 | 602 | 607 | 139.8 |
| C | 9 | 187 | 125109 | 890.27 | 602 | 607 | 139.8 |
| D | 2 | 249 | 253119 | 1742.01 | 602 | 587 | 145.0 |
| D | 12 | 235 | 192012 | 1320.49 | 602 | 587 | 145.0 |
| D | 12 | 233 | 145773 | 1001.52 | 602 | 587 | 145.0 |
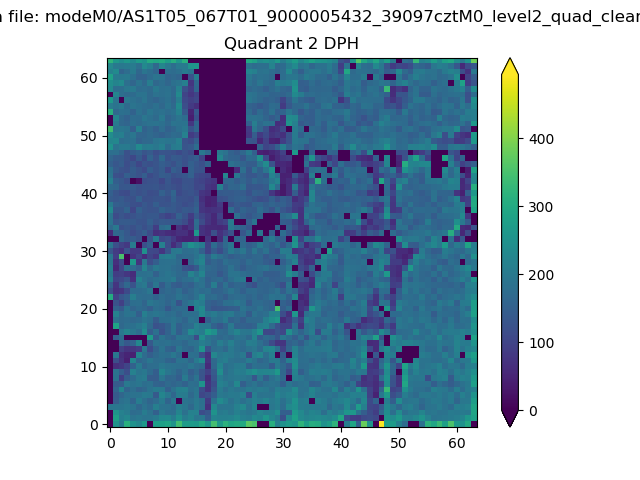
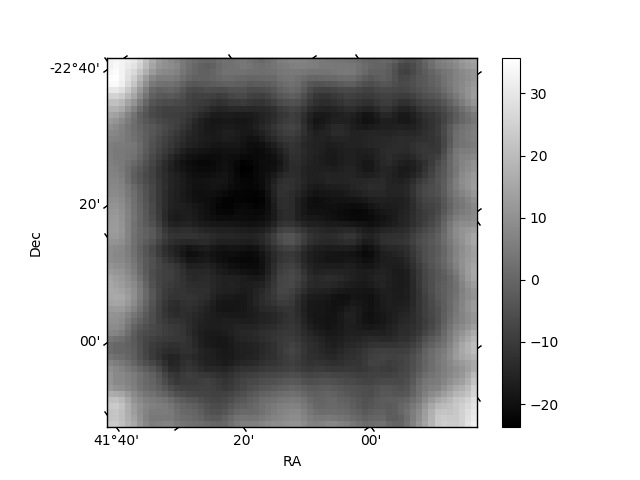
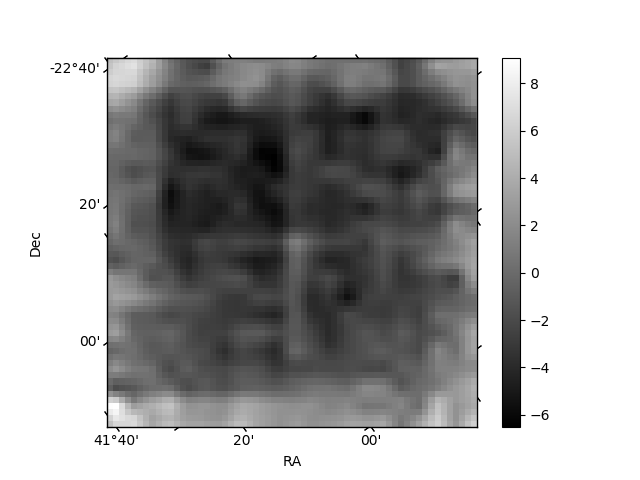
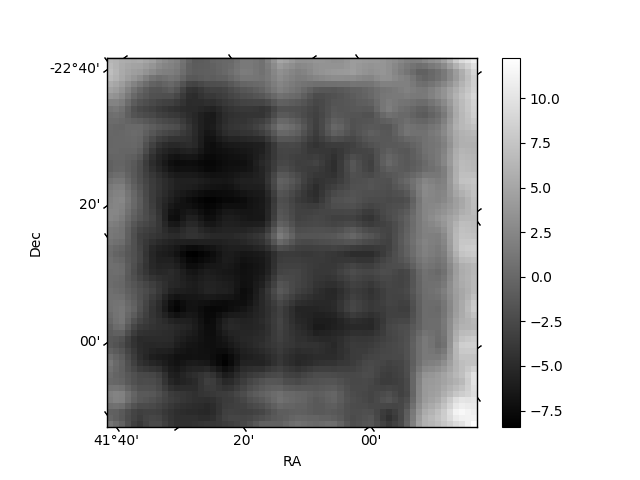
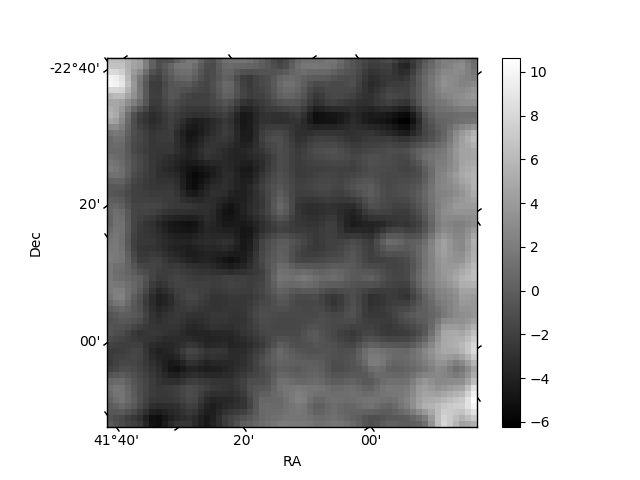
Histogram calculated using DETX and DETY for each event in the final _common_clean file
| Quadrant A | 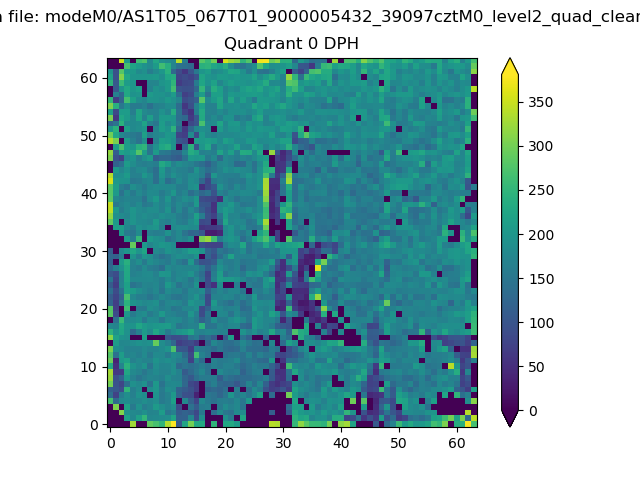 |
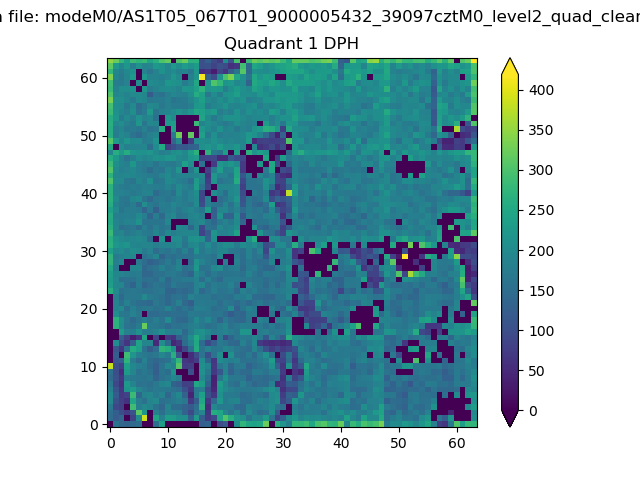 |
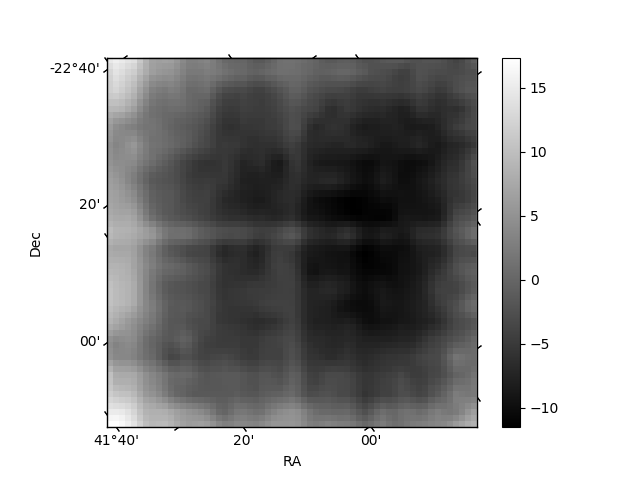
Quadrant B |
|---|---|---|---|
| Quadrant D | 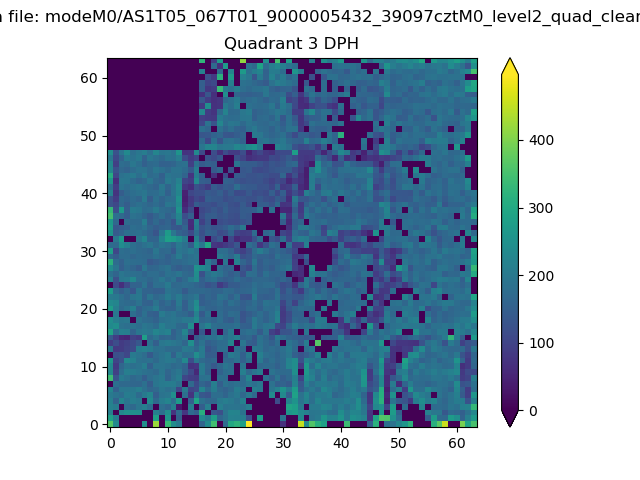 |
 |
Quadrant C |
| Plot type | Count rate plots | Images |
|---|---|---|
| Comparison with Poisson distribution Blue bars denote a histogram of data divided into 1 sec bins. Red curve is a Poisson curve with rate = median count rate of data. |
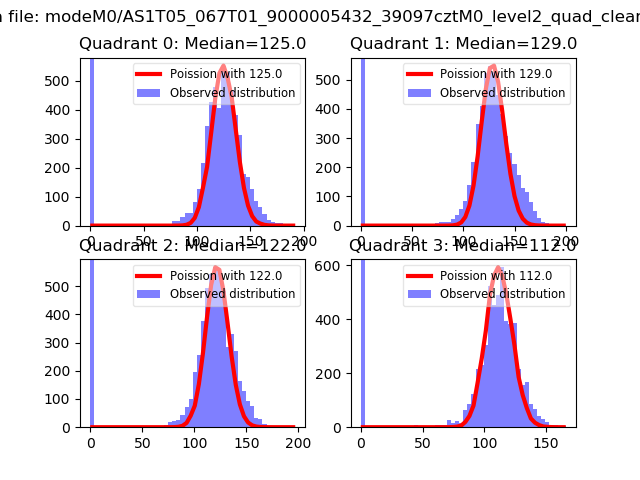 |
 |
| Quadrant-wise count rates Data is divided into 100 sec bins |
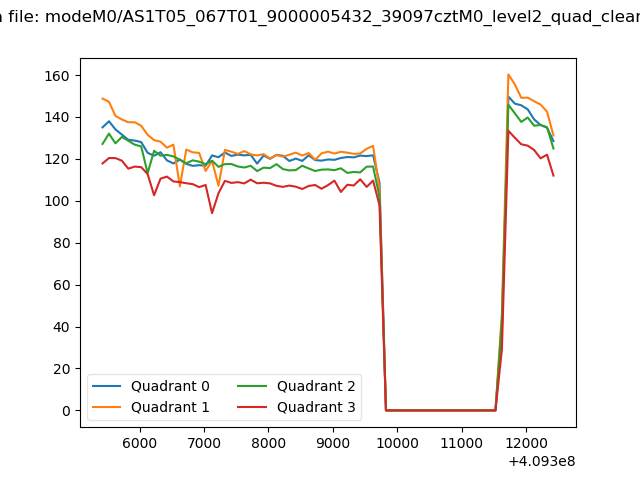 |
|
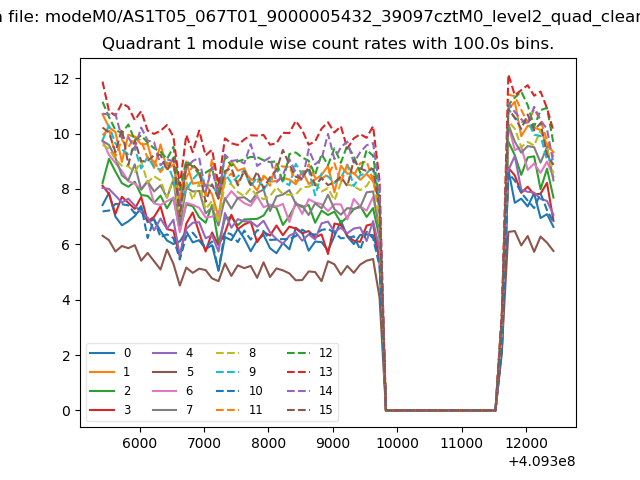
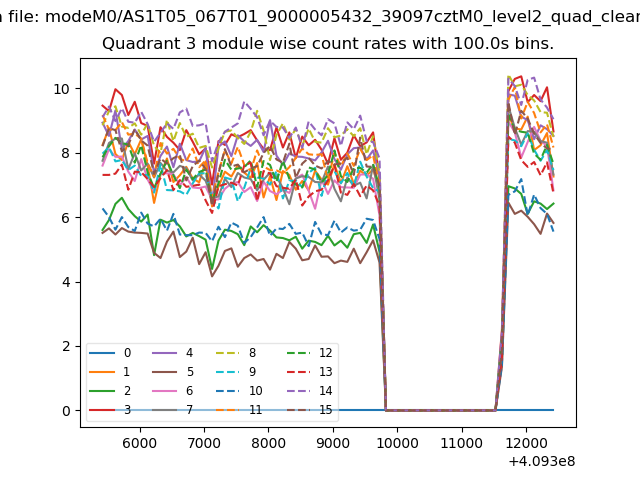
| Module-wise count rates for Quadrant A Data is divided into 100 sec bins |
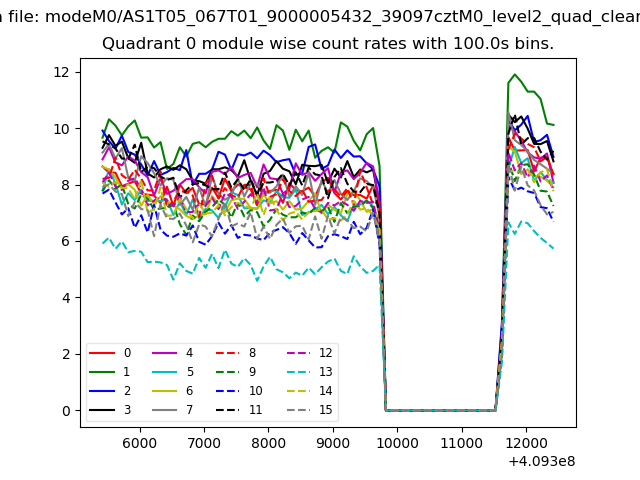 |
 |
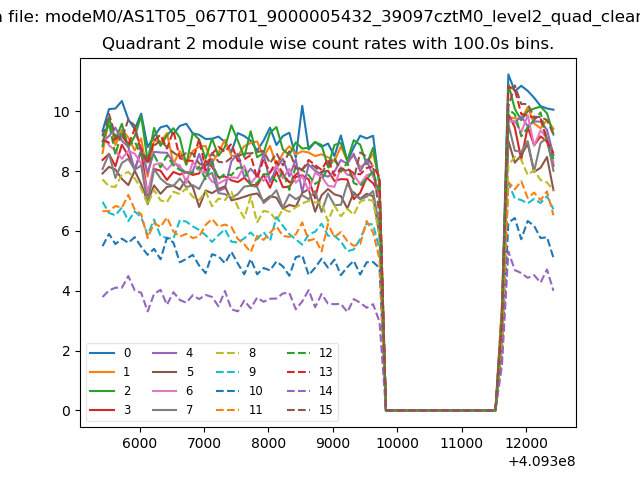
| Module-wise count rates for Quadrant B Data is divided into 100 sec bins |
 |
 |
| Module-wise count rates for Quadrant C Data is divided into 100 sec bins |
 |
 |
| Module-wise count rates for Quadrant D Data is divided into 100 sec bins |
 |
 |
| Parameter | Plot |
|---|---|
| CZT HV Monitor | 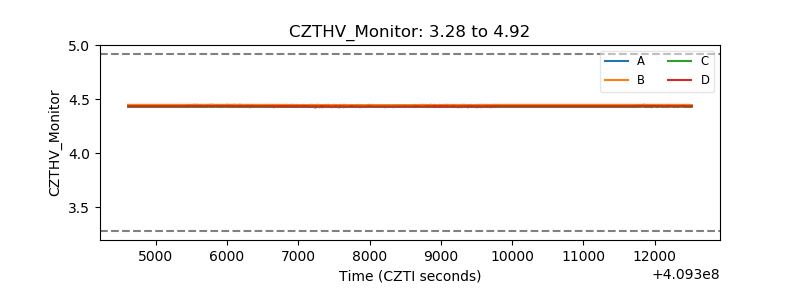 |
| D_VDD | 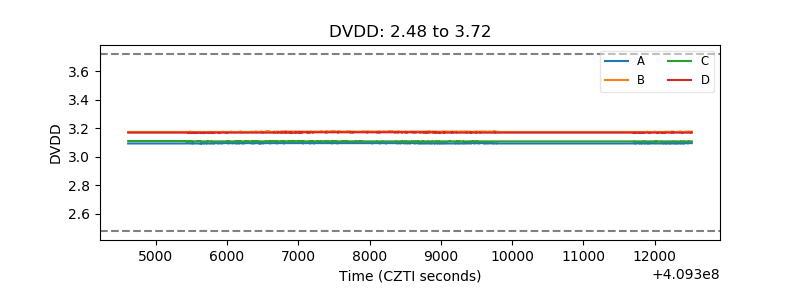 |
| Temperature 1 | 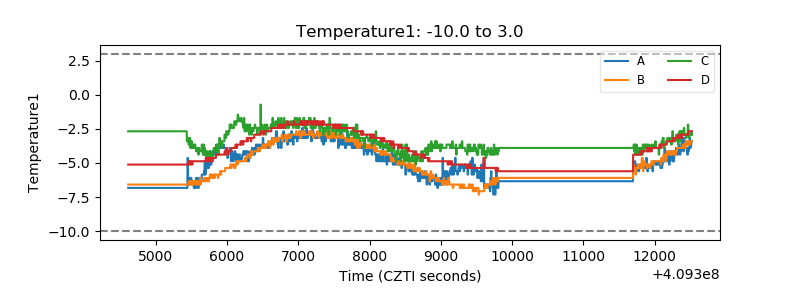 |
| Veto HV Monitor | 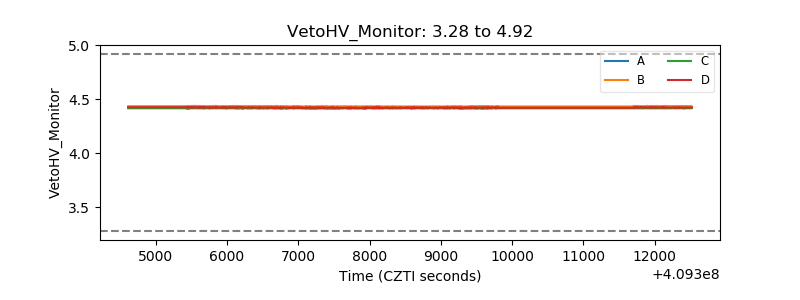 |
| Veto LLD | 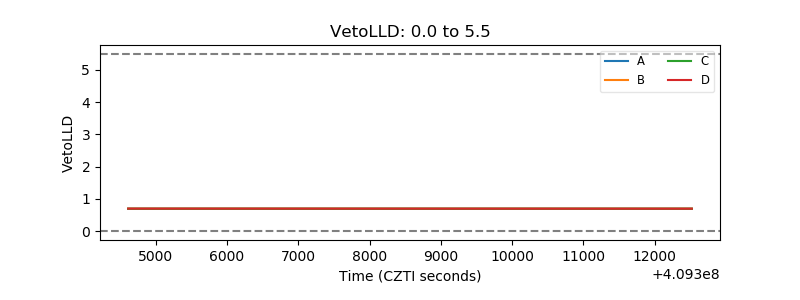 |
| Alpha Counter | 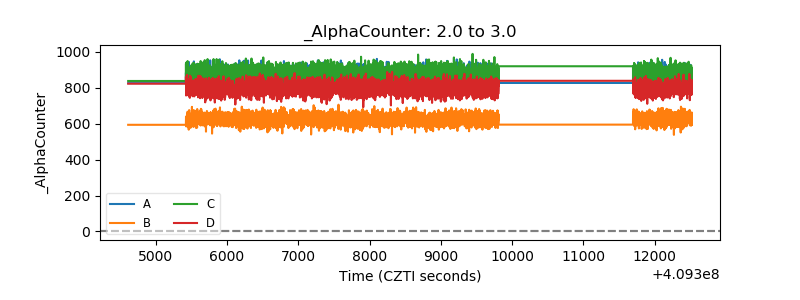 |
| _CPM_Rate | 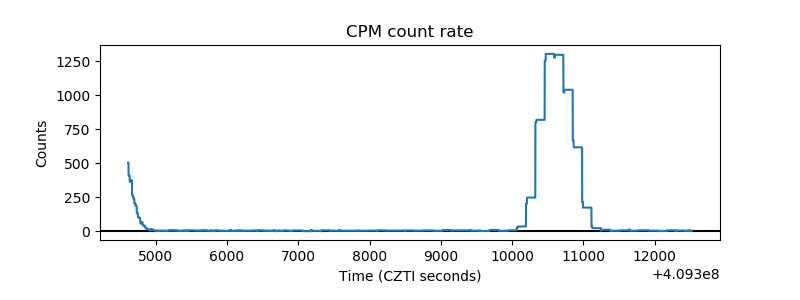 |
| CZT Counter | 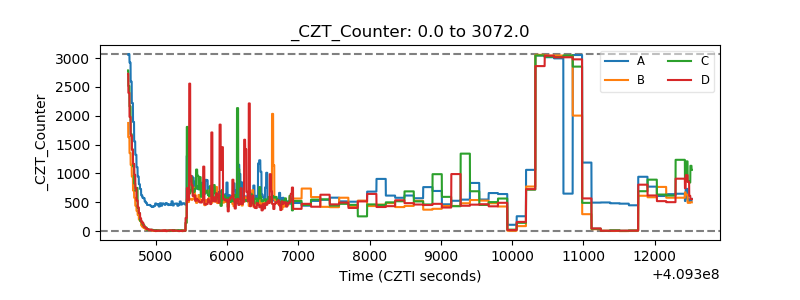 |
| +2.5 Volts monitor | 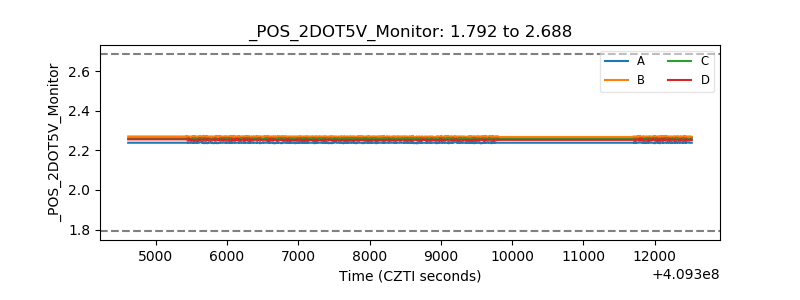 |
| +5 Volts monitor | 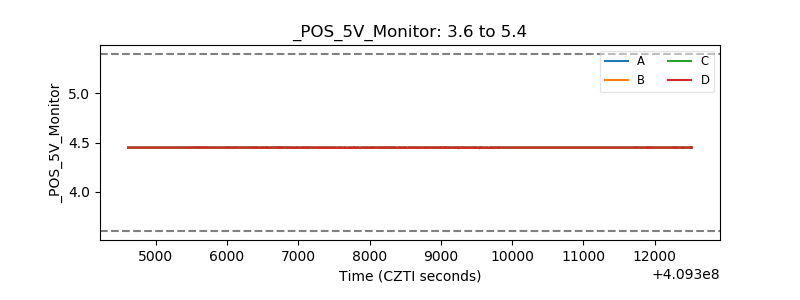 |
| _ROLL_ROT | 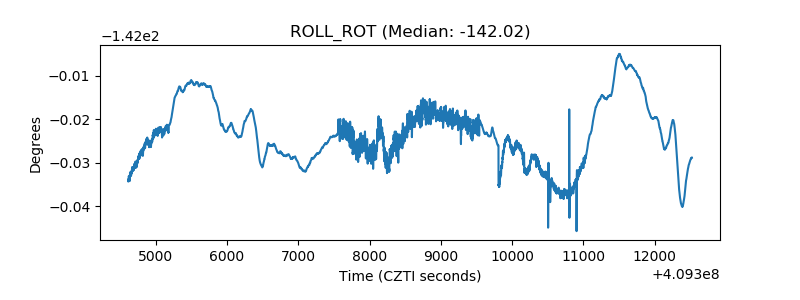 |
| _Roll_DEC | 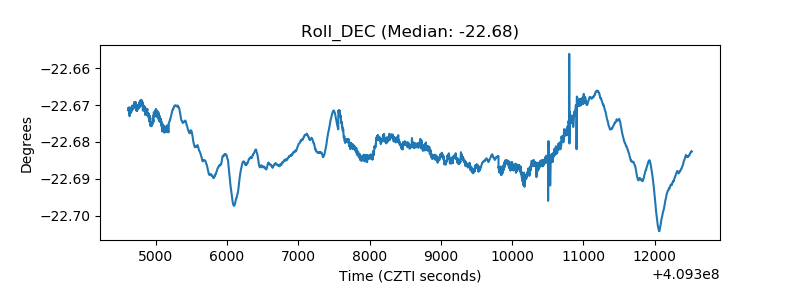 |
| _Roll_RA | 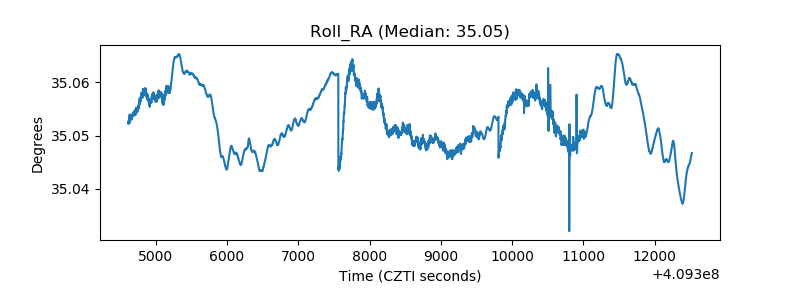 |
| Veto Counter | 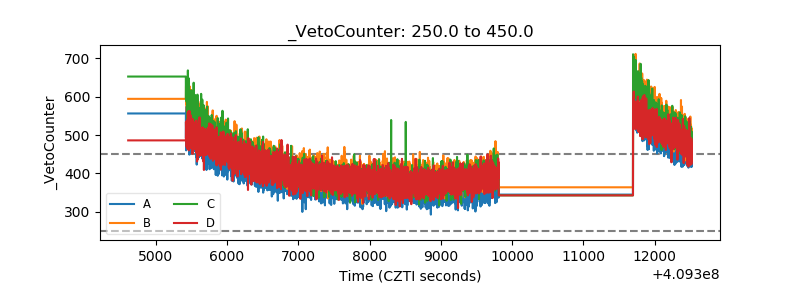 |