| Param | Original file | Final file |
|---|---|---|
| Filename | modeM0/AS1T05_067T01_9000005432_39098cztM0_level2.fits | modeM0/AS1T05_067T01_9000005432_39098cztM0_level2_quad_clean.evt |
| Size (bytes) | 353,966,400 | 102,283,200 |
| Size | 337.6 MB | 97.5 MB |
| Events in quadrant A | 3,140,486 | 702,604 |
| Events in quadrant B | 2,682,103 | 724,016 |
| Events in quadrant C | 3,530,396 | 676,046 |
| Events in quadrant D | 3,334,425 | 621,320 |
| Mode M0 | |||
|---|---|---|---|
| Quadrant | BADHDUFLAG | Total packets | Discarded packets |
| A | 0 | 12685 | 3 |
| B | 0 | 11183 | 2 |
| C | 0 | 13932 | 2 |
| D | 0 | 13284 | 2 |
| Mode SS | |||
|---|---|---|---|
| Quadrant | BADHDUFLAG | Total packets | Discarded packets |
| A | 0 | 110 | 0 |
| B | 0 | 110 | 0 |
| C | 0 | 110 | 0 |
| D | 0 | 110 | 0 |
| Mode M9 | |||
|---|---|---|---|
| Quadrant | BADHDUFLAG | Total packets | Discarded packets |
| A | 0 | 39 | 0 |
| B | 0 | 39 | 0 |
| C | 0 | 39 | 0 |
| D | 0 | 39 | 0 |
| Quadrant | Total seconds | Saturated seconds | Saturation percentage |
|---|---|---|---|
| A | 5339 | 22 | 0.412062% |
| B | 5339 | 14 | 0.262221% |
| C | 5339 | 13 | 0.243491% |
| D | 5339 | 82 | 1.535868% |
Noise dominated data is calculated using 1-second bins in cleaned event files. If a bin has >2000 counts, and if more than 50% of those come from <1% of pixels, then it is considered to be noise-dominated and hence unusable.
| Quadrant | # 1 sec bins | Bins with >0 counts | Bins with >2000 counts | High rate bins dominated by noise | Noise dominated (total time) | Noise dominated (detector-on time) | Marked lightcurve |
|---|---|---|---|---|---|---|---|
| A | 9224 | 5341 | 3 | 3 | 0.03% | 0.06% | 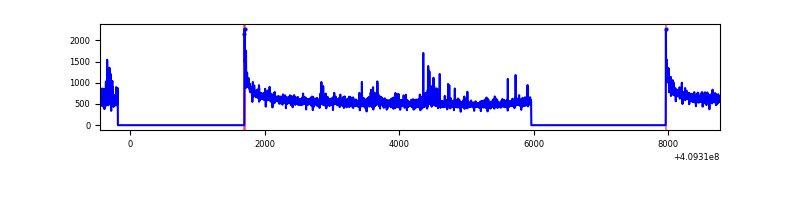 |
| B | 9224 | 5341 | 5 | 5 | 0.05% | 0.09% | 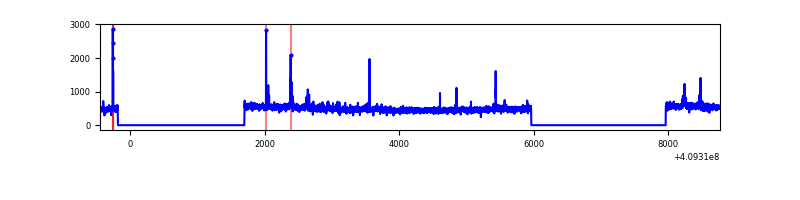 |
| C | 9224 | 5341 | 10 | 10 | 0.11% | 0.19% | 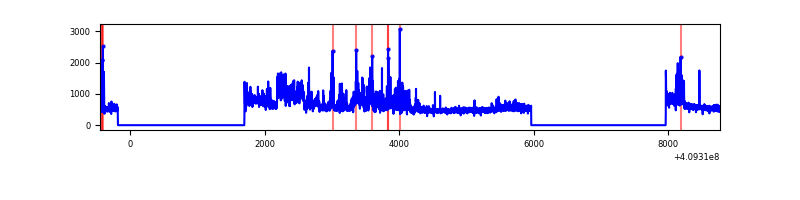 |
| D | 9224 | 5341 | 62 | 62 | 0.67% | 1.16% | 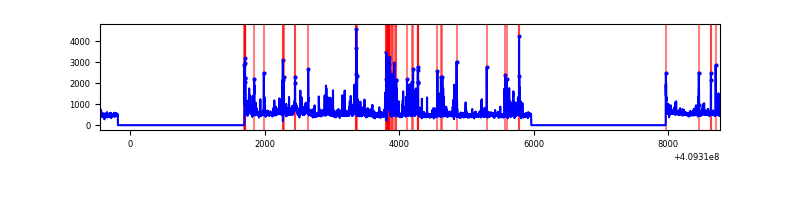 |
Top three noisy pixels from each quadrant. If the there are fewer than three noisy pixels in the level2.evt file, extra rows are filled as -1
| Pixel properties | Quadrant properties | ||||||
|---|---|---|---|---|---|---|---|
| Quadrant | DetID | PixID | Counts | Sigma | Mean | Median | Sigma |
| A | 10 | 83 | 408641 | 3102.12 | 659 | 648 | 131.5 |
| A | 12 | 16 | 130123 | 984.45 | 659 | 648 | 131.5 |
| A | 12 | 194 | 23075 | 170.52 | 659 | 648 | 131.5 |
| B | 5 | 172 | 62611 | 496.17 | 654 | 637 | 124.9 |
| B | 0 | 230 | 20539 | 159.34 | 654 | 637 | 124.9 |
| B | 0 | 199 | 18451 | 142.62 | 654 | 637 | 124.9 |
| C | 15 | 208 | 703844 | 4863.85 | 628 | 634 | 144.6 |
| C | 15 | 214 | 228961 | 1579.26 | 628 | 634 | 144.6 |
| C | 9 | 187 | 120199 | 826.99 | 628 | 634 | 144.6 |
| D | 12 | 235 | 227644 | 1501.43 | 631 | 617 | 151.2 |
| D | 13 | 171 | 169683 | 1118.11 | 631 | 617 | 151.2 |
| D | 2 | 249 | 130842 | 861.24 | 631 | 617 | 151.2 |
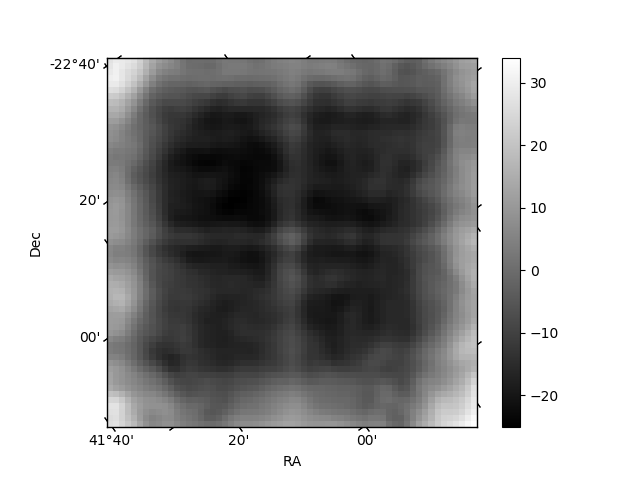
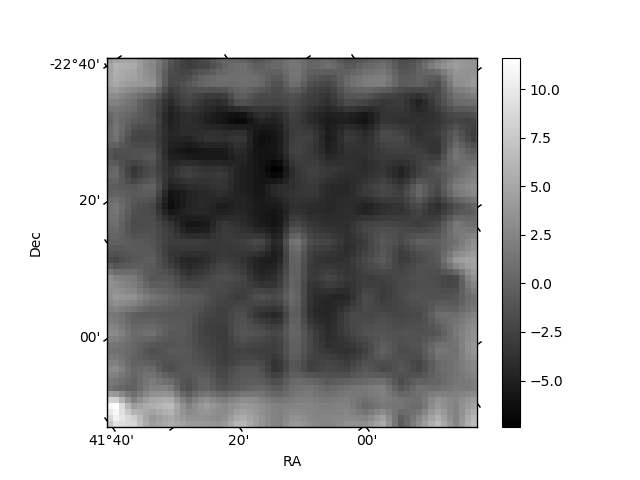
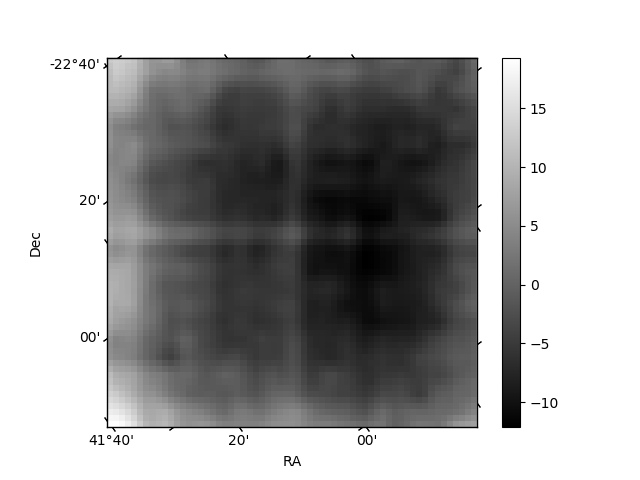
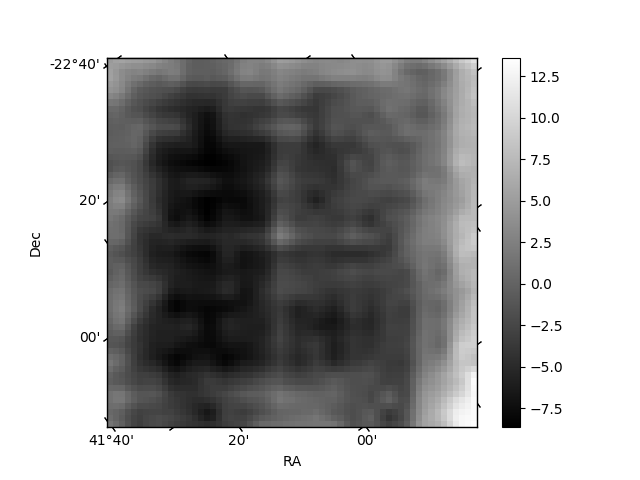
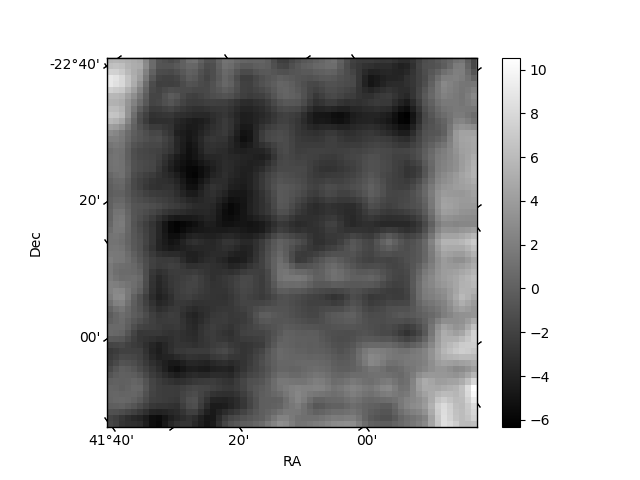
Histogram calculated using DETX and DETY for each event in the final _common_clean file
| Quadrant A | 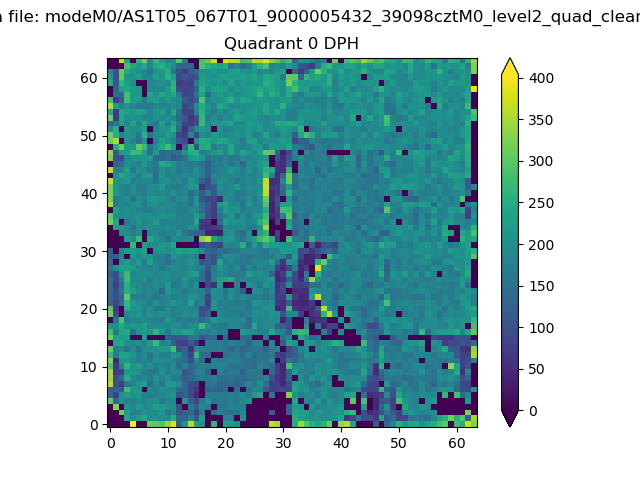 |
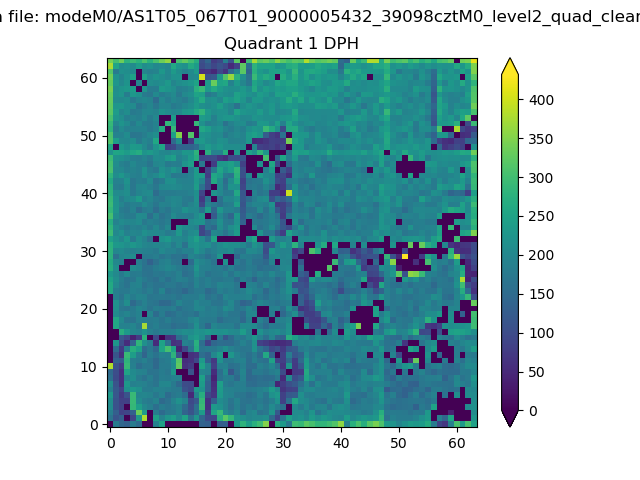 |
Quadrant B |
|---|---|---|---|
| Quadrant D | 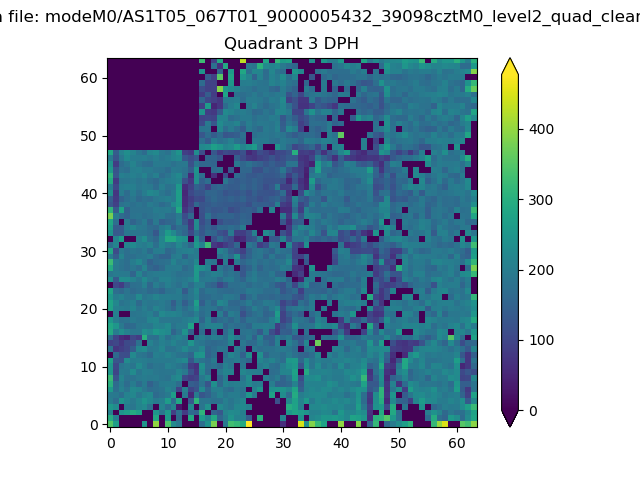 |
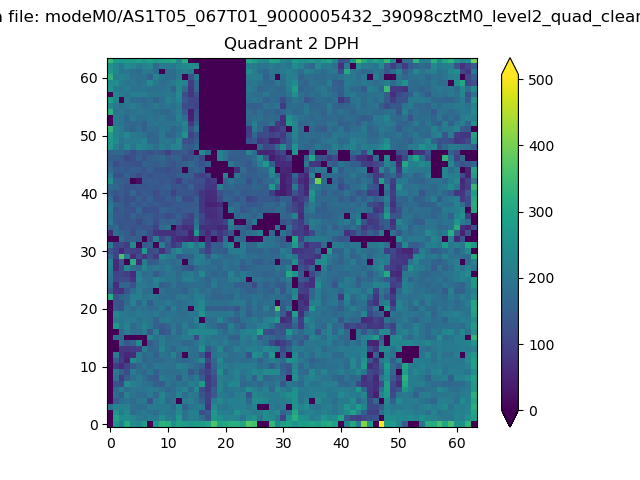 |
Quadrant C |
| Plot type | Count rate plots | Images |
|---|---|---|
| Comparison with Poisson distribution Blue bars denote a histogram of data divided into 1 sec bins. Red curve is a Poisson curve with rate = median count rate of data. |
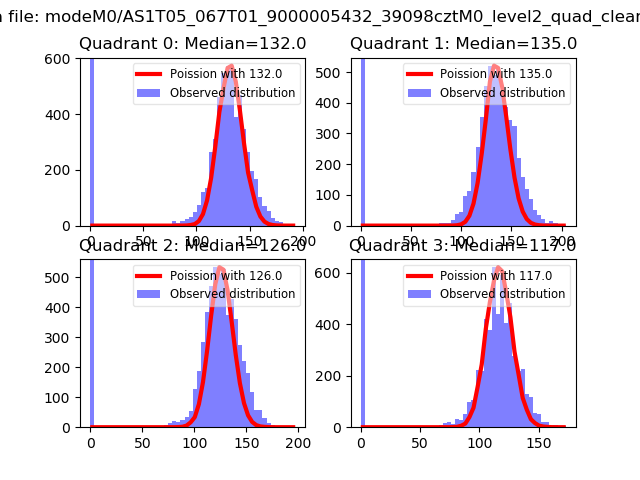 |
 |
| Quadrant-wise count rates Data is divided into 100 sec bins |
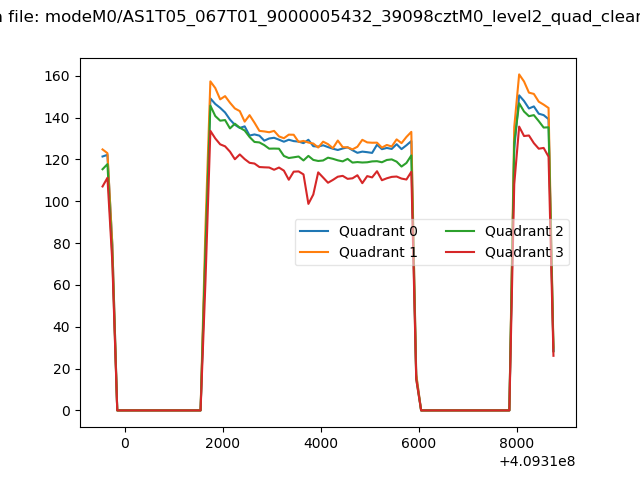 |
|
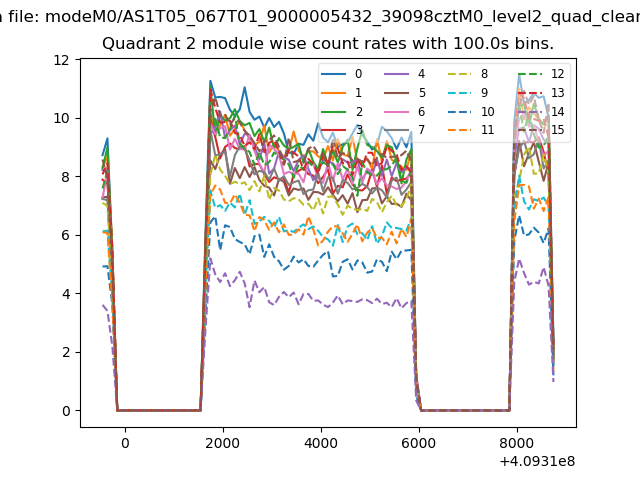
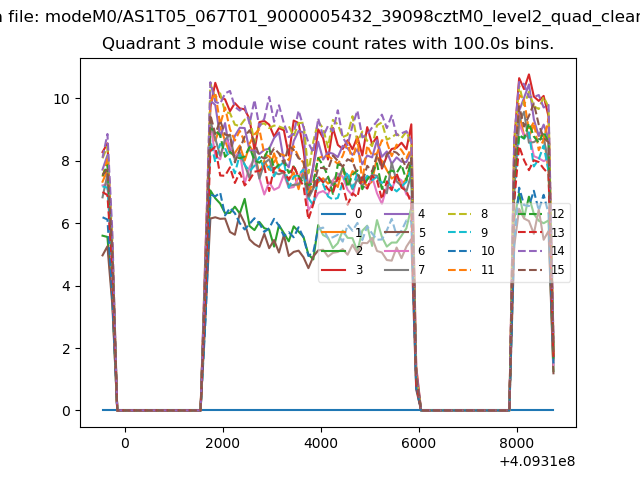
| Module-wise count rates for Quadrant A Data is divided into 100 sec bins |
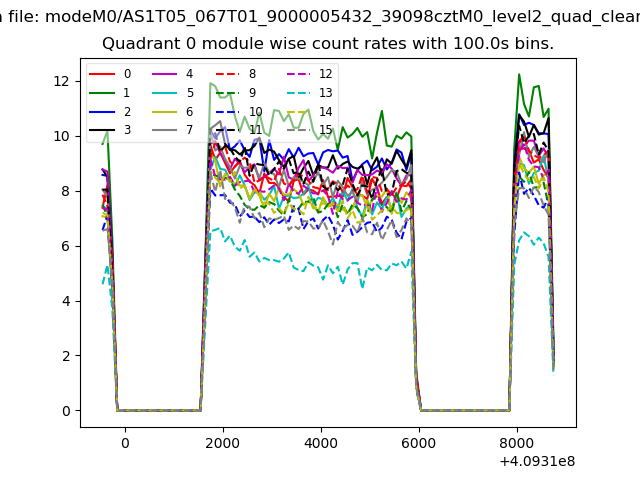 |
 |
| Module-wise count rates for Quadrant B Data is divided into 100 sec bins |
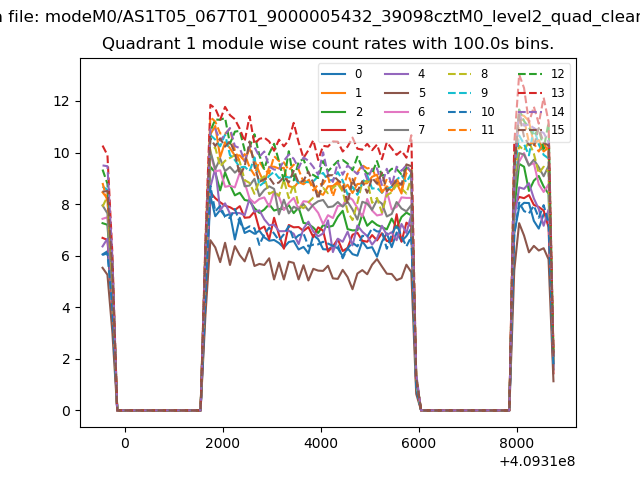 |
 |
| Module-wise count rates for Quadrant C Data is divided into 100 sec bins |
 |
 |
| Module-wise count rates for Quadrant D Data is divided into 100 sec bins |
 |
 |
| Parameter | Plot |
|---|---|
| CZT HV Monitor | 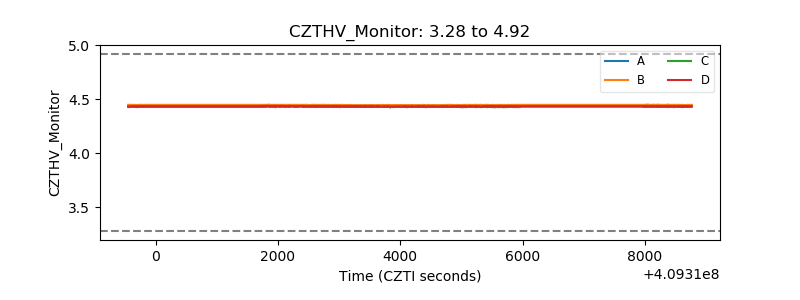 |
| D_VDD | 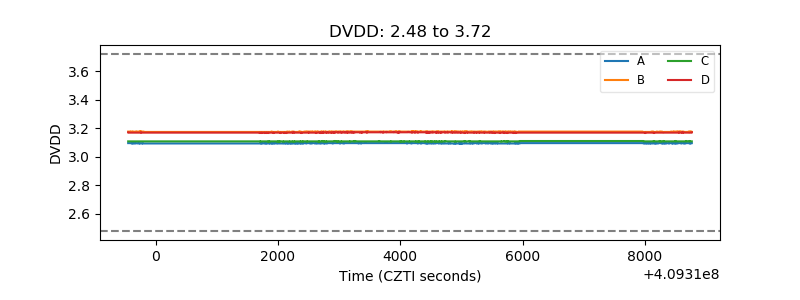 |
| Temperature 1 | 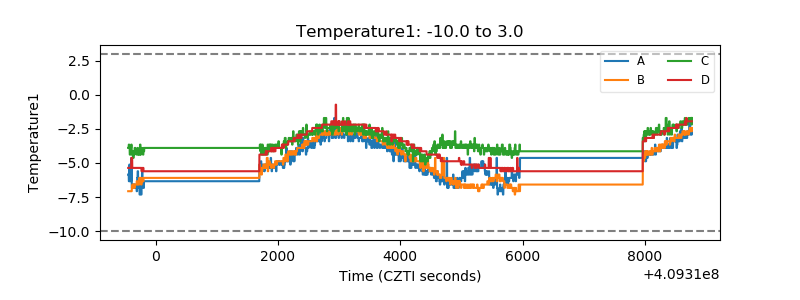 |
| Veto HV Monitor | 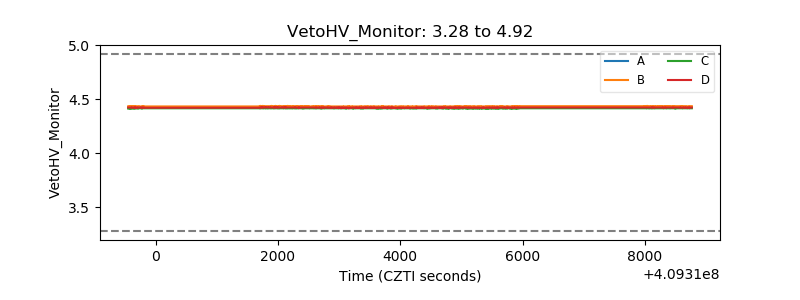 |
| Veto LLD | 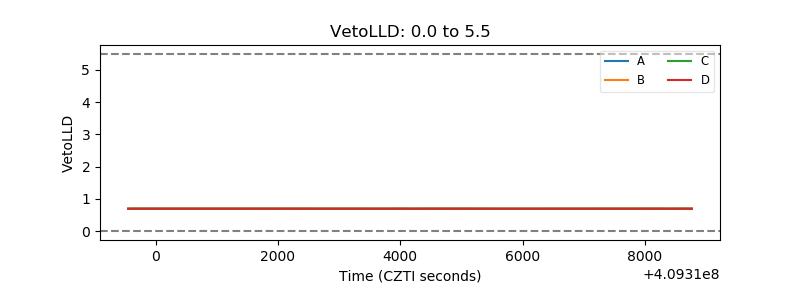 |
| Alpha Counter | 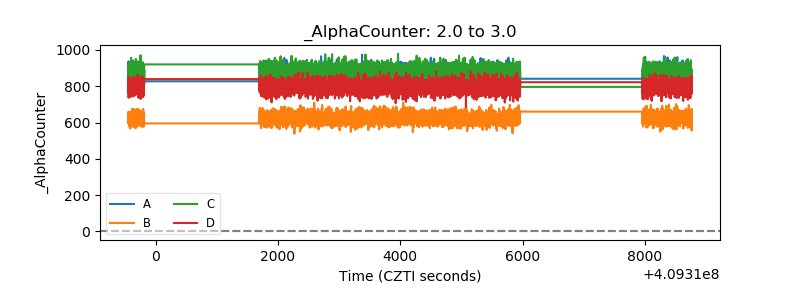 |
| _CPM_Rate | 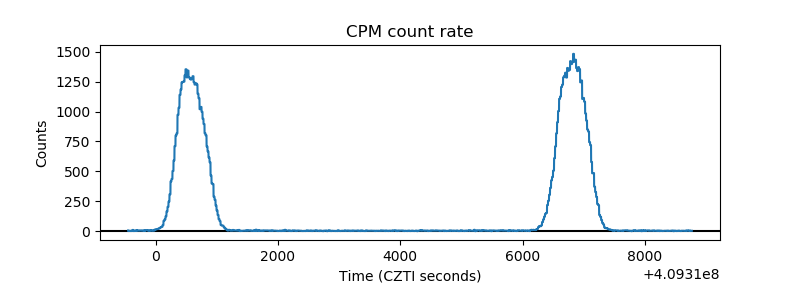 |
| CZT Counter | 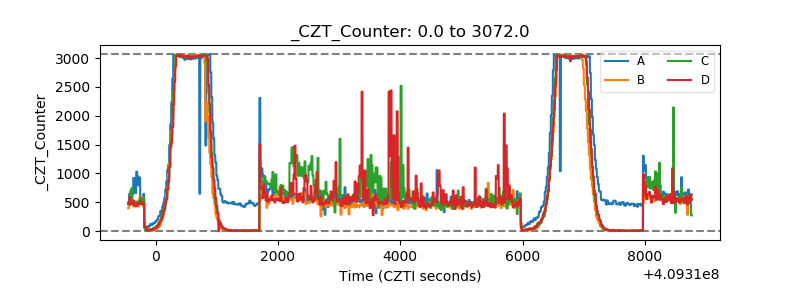 |
| +2.5 Volts monitor | 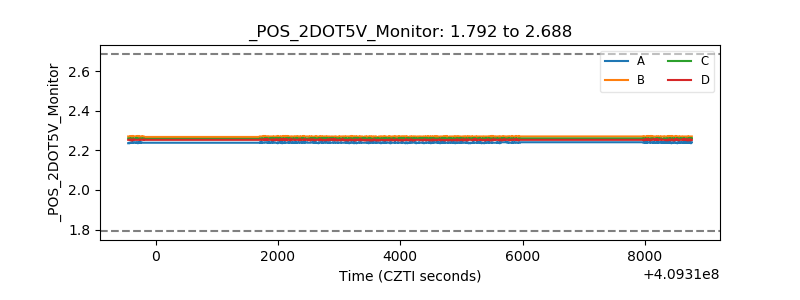 |
| +5 Volts monitor | 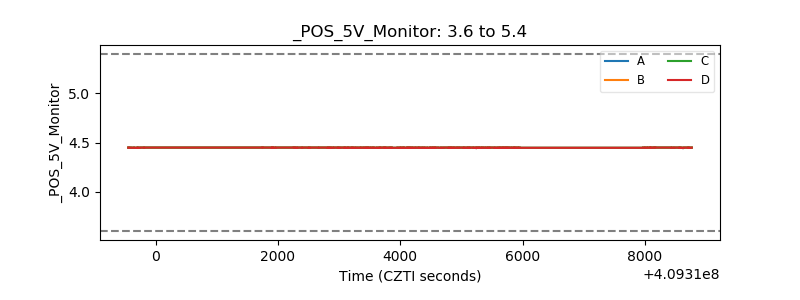 |
| _ROLL_ROT | 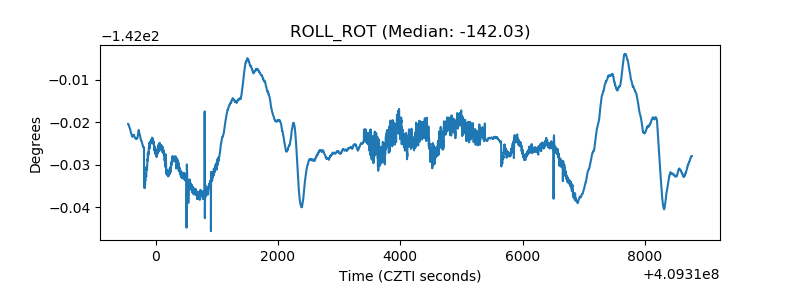 |
| _Roll_DEC | 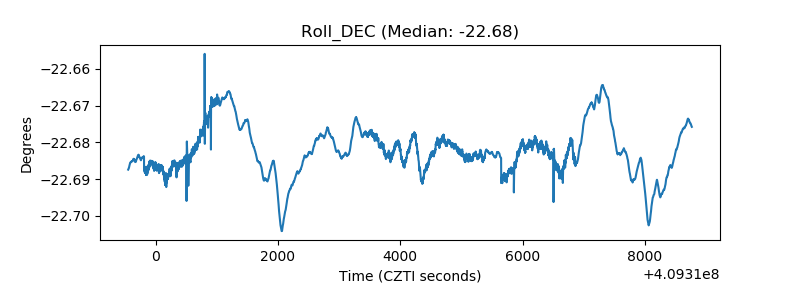 |
| _Roll_RA | 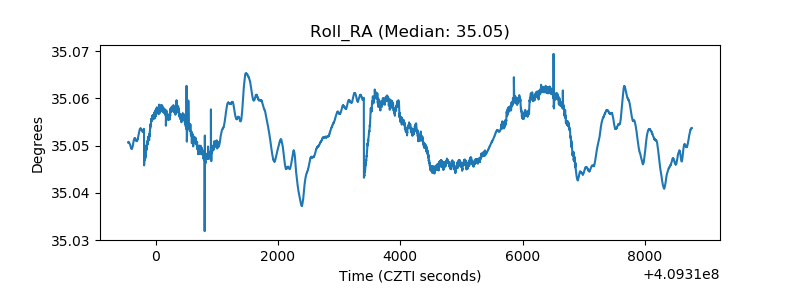 |
| Veto Counter | 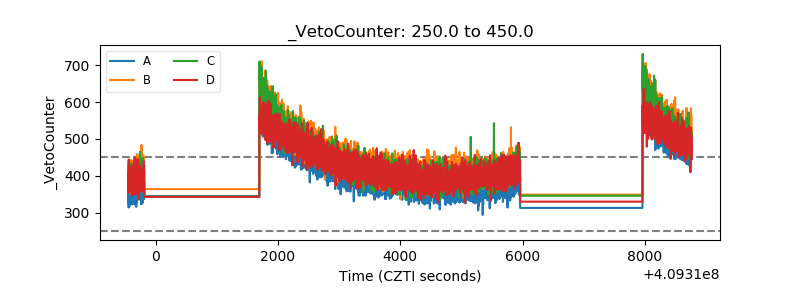 |