| Param | Original file | Final file |
|---|---|---|
| Filename | modeM0/AS1T05_067T01_9000005432_39099cztM0_level2.fits | modeM0/AS1T05_067T01_9000005432_39099cztM0_level2_quad_clean.evt |
| Size (bytes) | 334,056,960 | 96,661,440 |
| Size | 318.6 MB | 92.2 MB |
| Events in quadrant A | 3,346,039 | 669,711 |
| Events in quadrant B | 2,587,474 | 685,304 |
| Events in quadrant C | 2,929,602 | 636,607 |
| Events in quadrant D | 3,111,913 | 583,991 |
| Mode M0 | |||
|---|---|---|---|
| Quadrant | BADHDUFLAG | Total packets | Discarded packets |
| A | 0 | 13332 | 3 |
| B | 0 | 10737 | 2 |
| C | 0 | 11898 | 2 |
| D | 0 | 12518 | 2 |
| Mode SS | |||
|---|---|---|---|
| Quadrant | BADHDUFLAG | Total packets | Discarded packets |
| A | 0 | 102 | 0 |
| B | 0 | 102 | 0 |
| C | 0 | 102 | 0 |
| D | 0 | 102 | 0 |
| Mode M9 | |||
|---|---|---|---|
| Quadrant | BADHDUFLAG | Total packets | Discarded packets |
| A | 0 | 34 | 0 |
| B | 0 | 34 | 0 |
| C | 0 | 34 | 0 |
| D | 0 | 35 | 0 |
| Quadrant | Total seconds | Saturated seconds | Saturation percentage |
|---|---|---|---|
| A | 5017 | 23 | 0.458441% |
| B | 5017 | 20 | 0.398645% |
| C | 5017 | 6 | 0.119593% |
| D | 5017 | 117 | 2.332071% |
Noise dominated data is calculated using 1-second bins in cleaned event files. If a bin has >2000 counts, and if more than 50% of those come from <1% of pixels, then it is considered to be noise-dominated and hence unusable.
| Quadrant | # 1 sec bins | Bins with >0 counts | Bins with >2000 counts | High rate bins dominated by noise | Noise dominated (total time) | Noise dominated (detector-on time) | Marked lightcurve |
|---|---|---|---|---|---|---|---|
| A | 7110 | 5018 | 4 | 4 | 0.06% | 0.08% | 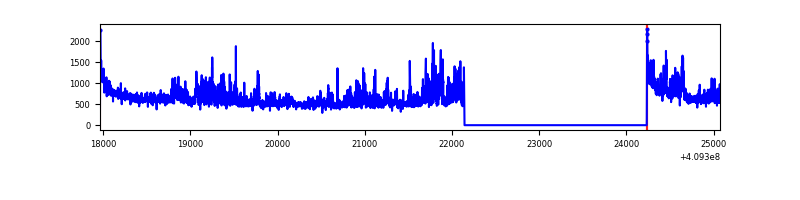 |
| B | 7110 | 5018 | 4 | 4 | 0.06% | 0.08% | 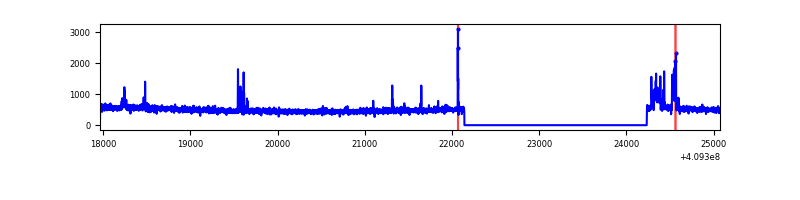 |
| C | 7110 | 5018 | 1 | 1 | 0.01% | 0.02% | 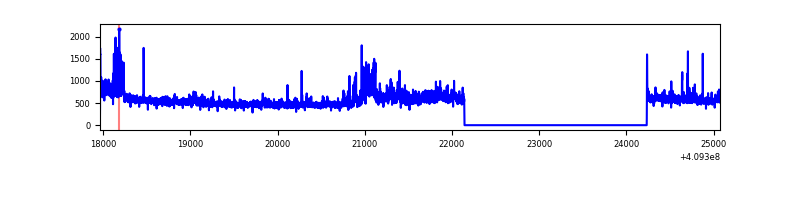 |
| D | 7110 | 5018 | 90 | 90 | 1.27% | 1.79% | 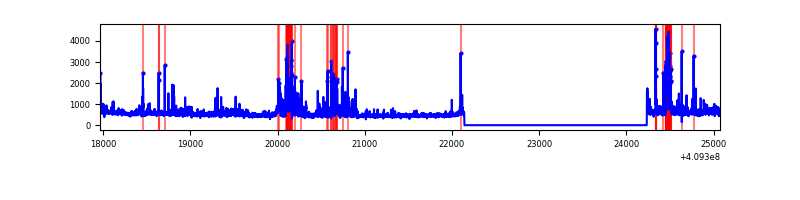 |
Top three noisy pixels from each quadrant. If the there are fewer than three noisy pixels in the level2.evt file, extra rows are filled as -1
| Pixel properties | Quadrant properties | ||||||
|---|---|---|---|---|---|---|---|
| Quadrant | DetID | PixID | Counts | Sigma | Mean | Median | Sigma |
| A | 12 | 16 | 419827 | 3380.49 | 619 | 609 | 124.0 |
| A | 10 | 83 | 404662 | 3258.2 | 619 | 609 | 124.0 |
| A | 12 | 194 | 63371 | 506.1 | 619 | 609 | 124.0 |
| B | 5 | 184 | 98806 | 842.93 | 613 | 600 | 116.5 |
| B | 5 | 172 | 38096 | 321.84 | 613 | 600 | 116.5 |
| B | 0 | 230 | 23570 | 197.16 | 613 | 600 | 116.5 |
| C | 15 | 208 | 334187 | 2462.62 | 587 | 592 | 135.5 |
| C | 15 | 214 | 212118 | 1561.5 | 587 | 592 | 135.5 |
| C | 9 | 187 | 48138 | 350.99 | 587 | 592 | 135.5 |
| D | 12 | 233 | 274291 | 1933.45 | 589 | 576 | 141.6 |
| D | 12 | 235 | 225290 | 1587.32 | 589 | 576 | 141.6 |
| D | 13 | 171 | 168325 | 1184.93 | 589 | 576 | 141.6 |
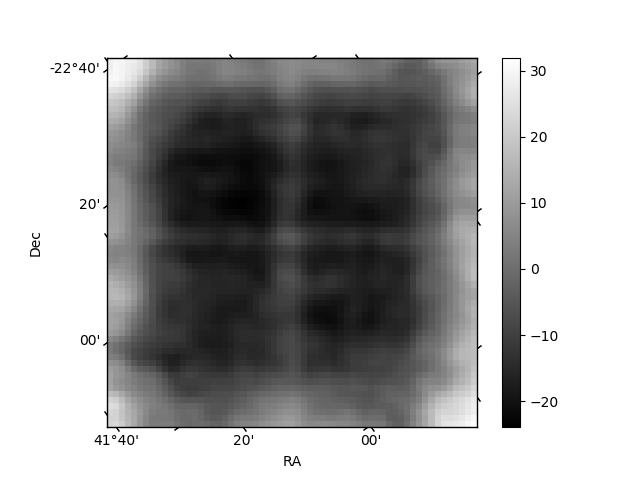
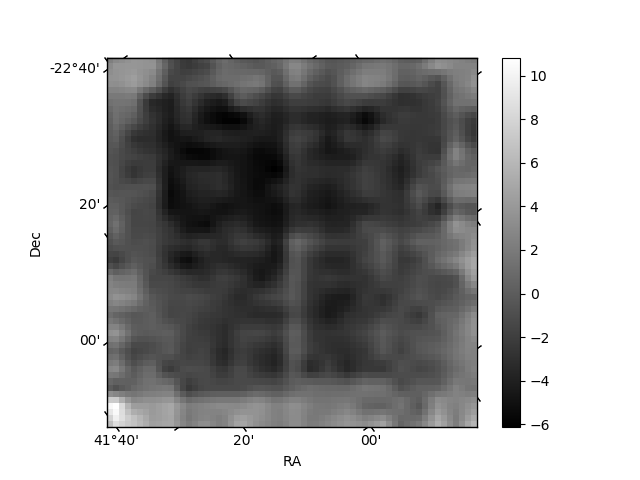
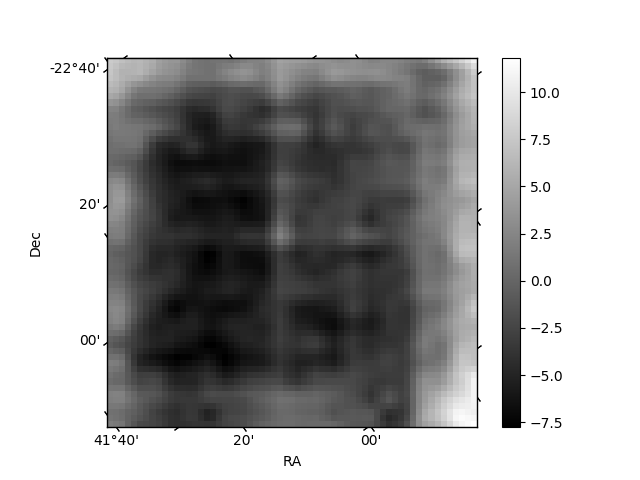
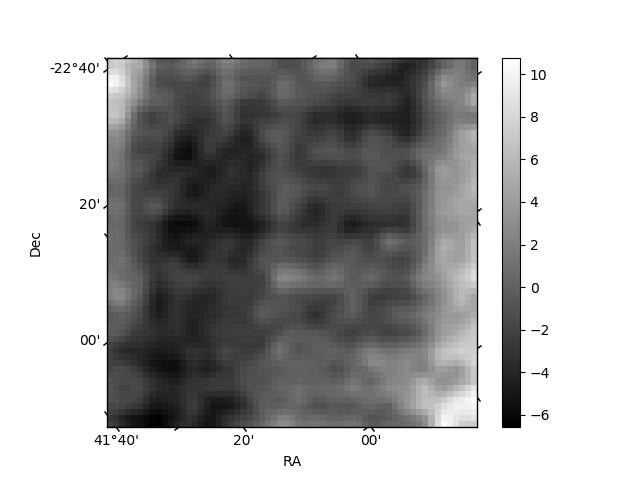
Histogram calculated using DETX and DETY for each event in the final _common_clean file
| Quadrant A | 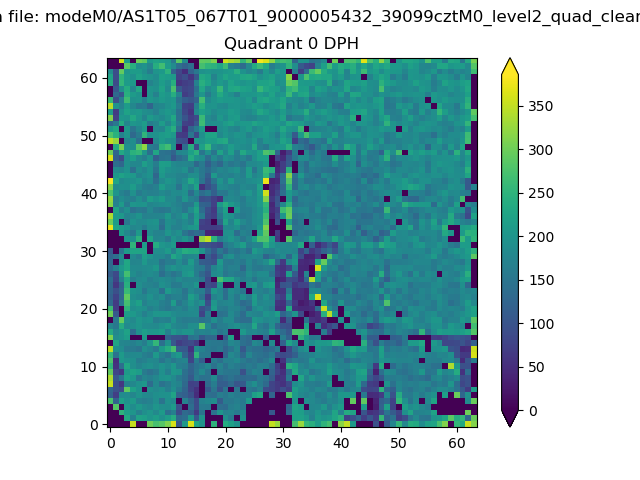 |
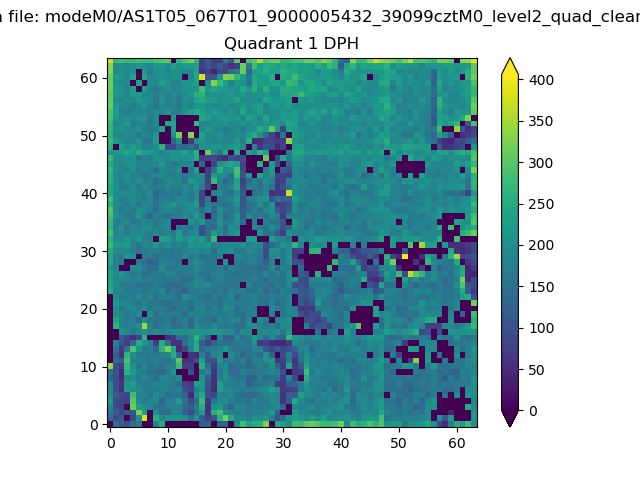 |
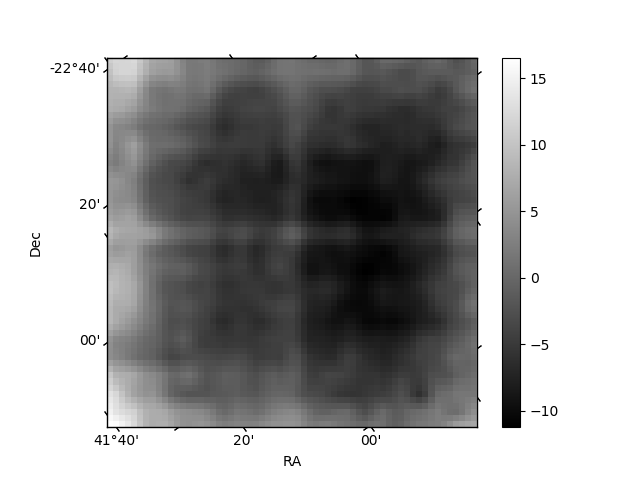
Quadrant B |
|---|---|---|---|
| Quadrant D | 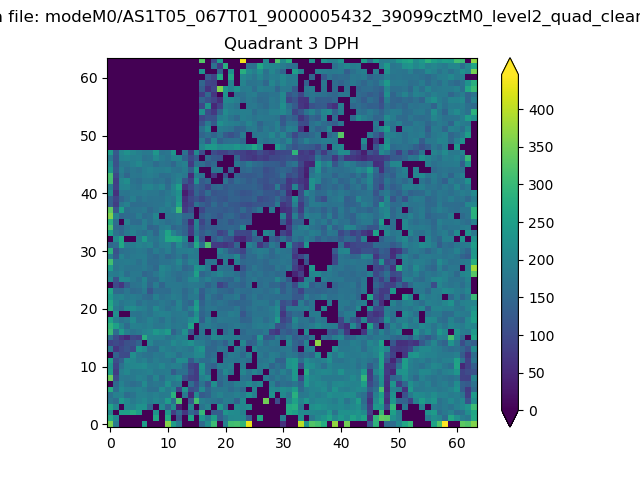 |
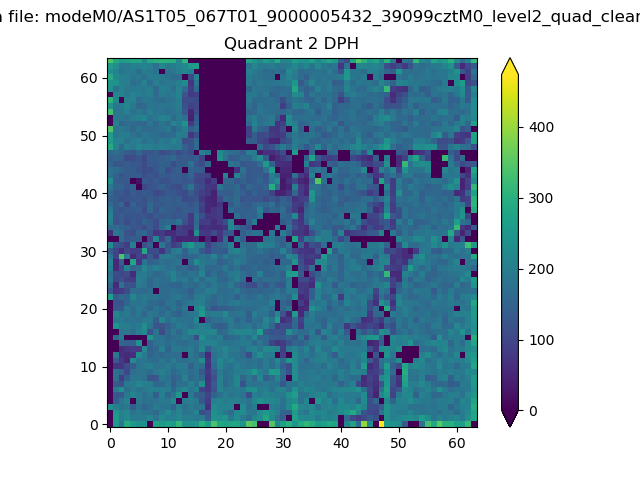 |
Quadrant C |
| Plot type | Count rate plots | Images |
|---|---|---|
| Comparison with Poisson distribution Blue bars denote a histogram of data divided into 1 sec bins. Red curve is a Poisson curve with rate = median count rate of data. |
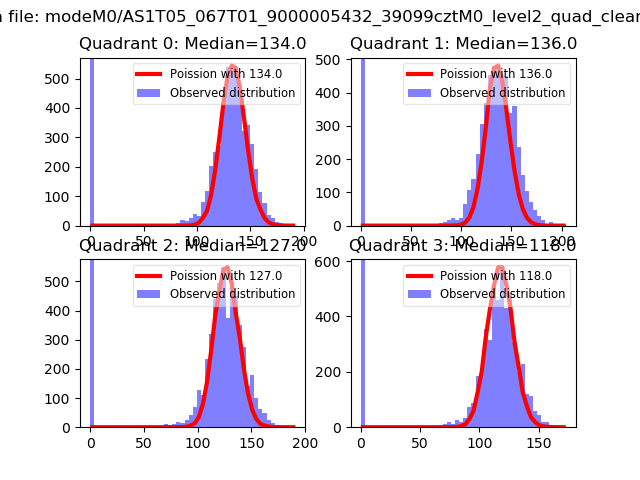 |
 |
| Quadrant-wise count rates Data is divided into 100 sec bins |
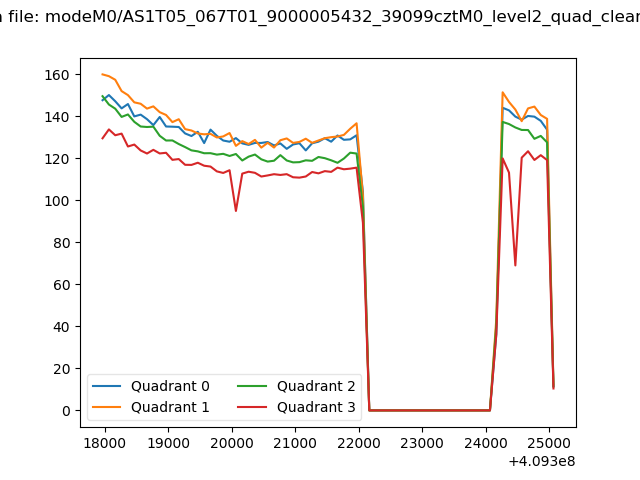 |
|
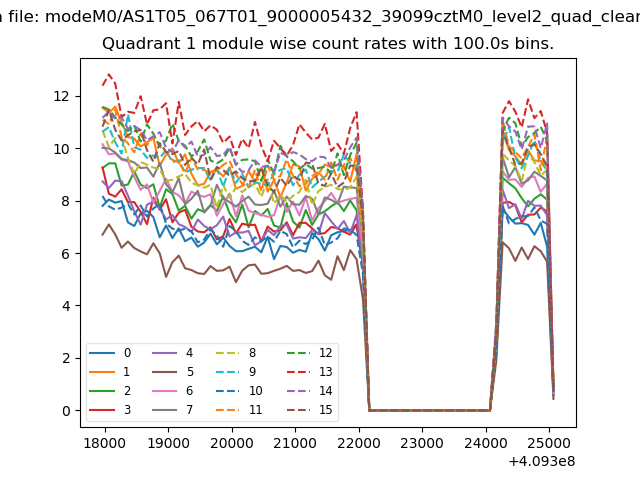
| Module-wise count rates for Quadrant A Data is divided into 100 sec bins |
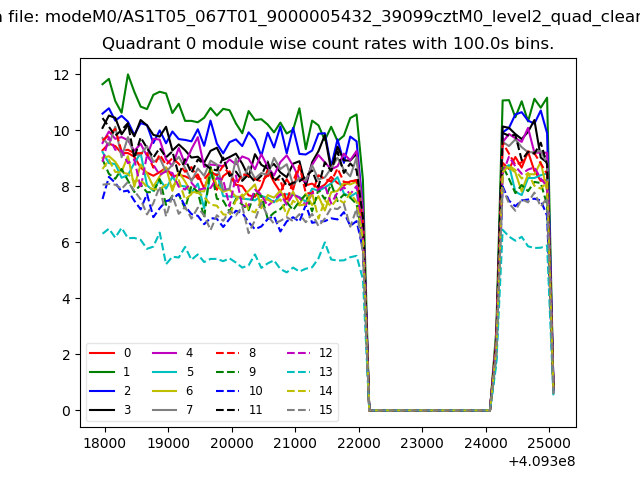 |
 |
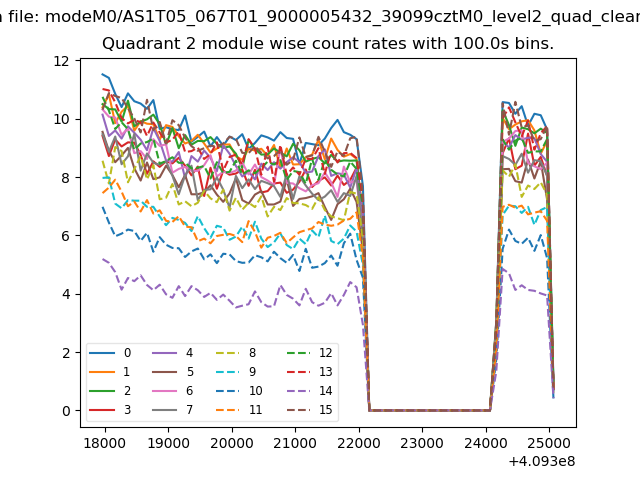
| Module-wise count rates for Quadrant B Data is divided into 100 sec bins |
 |
 |
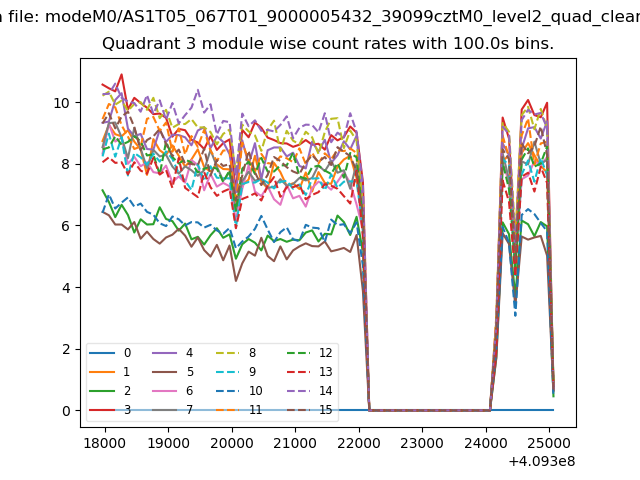
| Module-wise count rates for Quadrant C Data is divided into 100 sec bins |
 |
 |
| Module-wise count rates for Quadrant D Data is divided into 100 sec bins |
 |
 |
| Parameter | Plot |
|---|---|
| CZT HV Monitor | 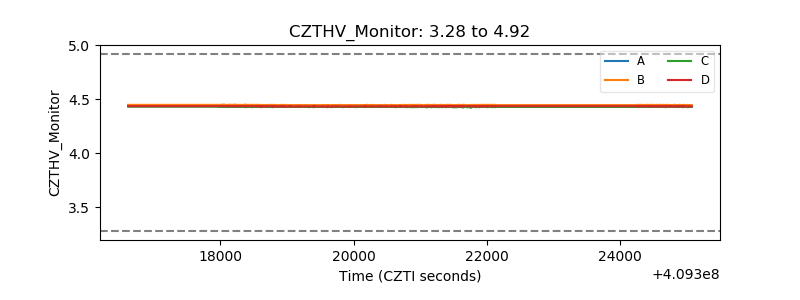 |
| D_VDD | 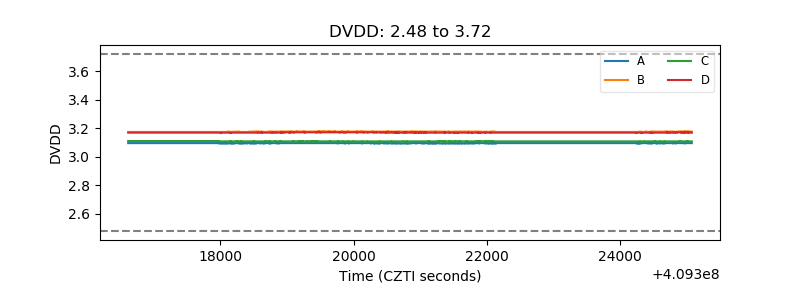 |
| Temperature 1 | 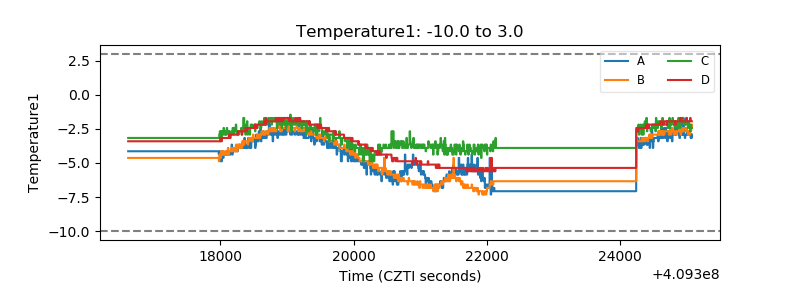 |
| Veto HV Monitor | 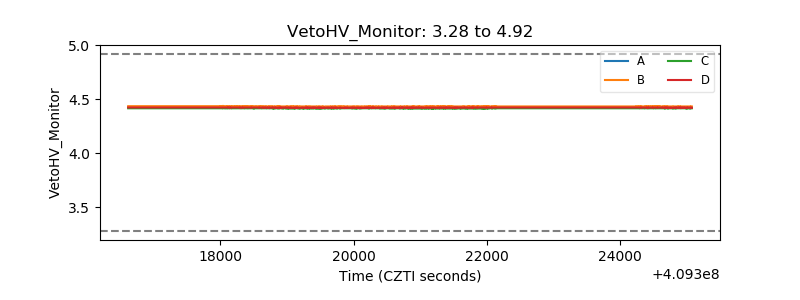 |
| Veto LLD | 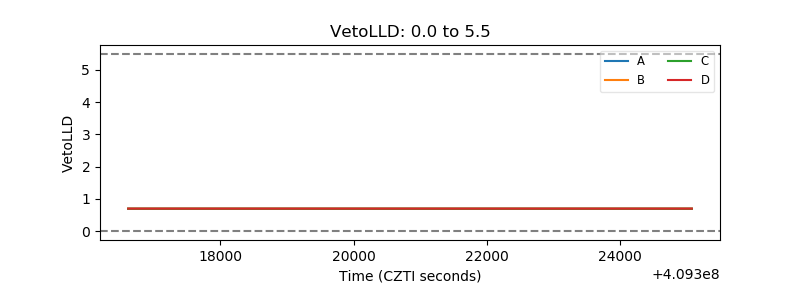 |
| Alpha Counter | 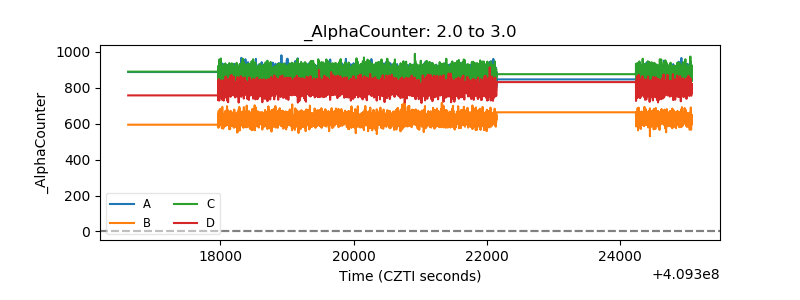 |
| _CPM_Rate | 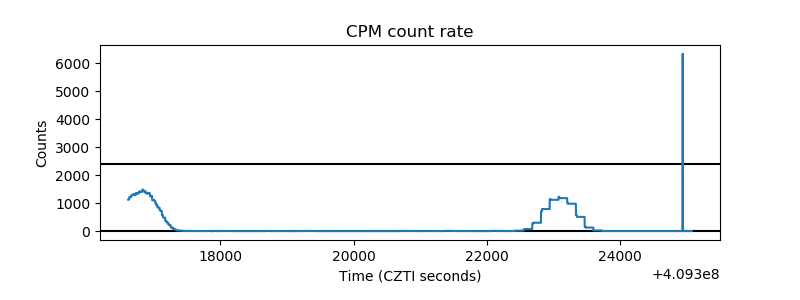 |
| CZT Counter | 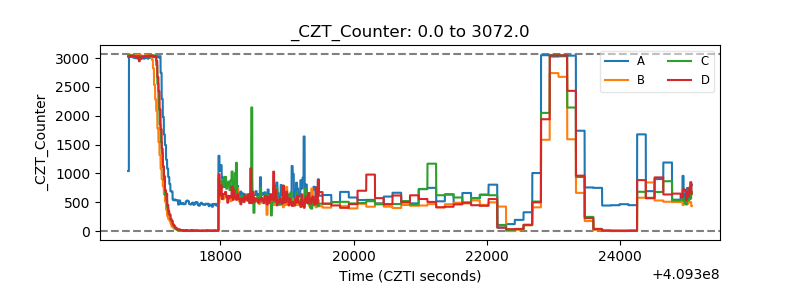 |
| +2.5 Volts monitor | 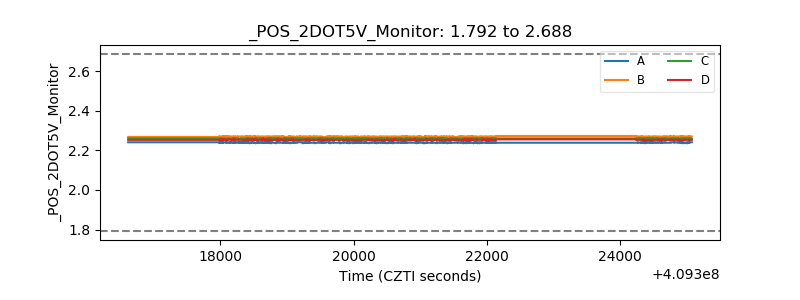 |
| +5 Volts monitor | 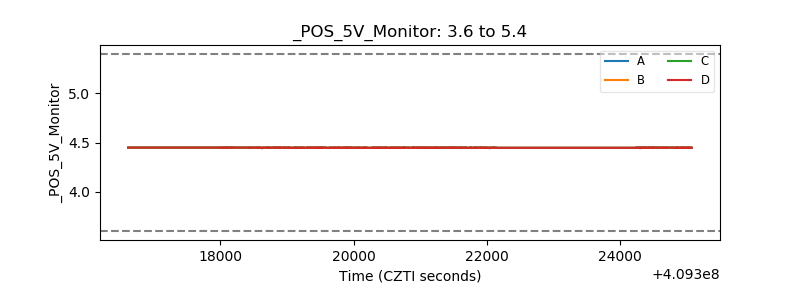 |
| _ROLL_ROT | 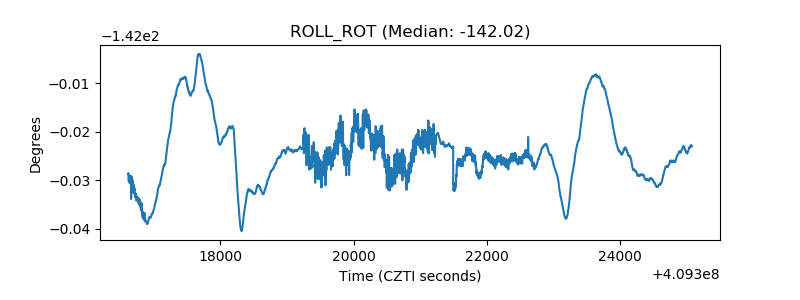 |
| _Roll_DEC | 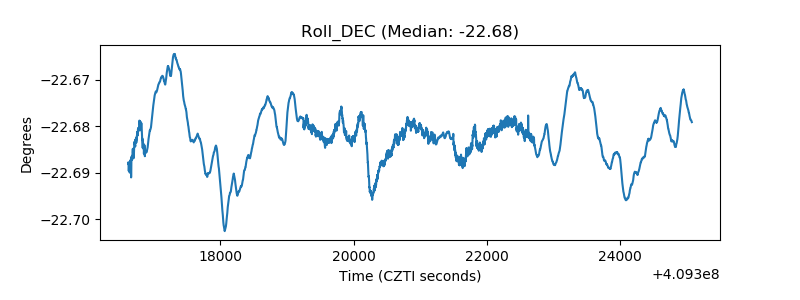 |
| _Roll_RA | 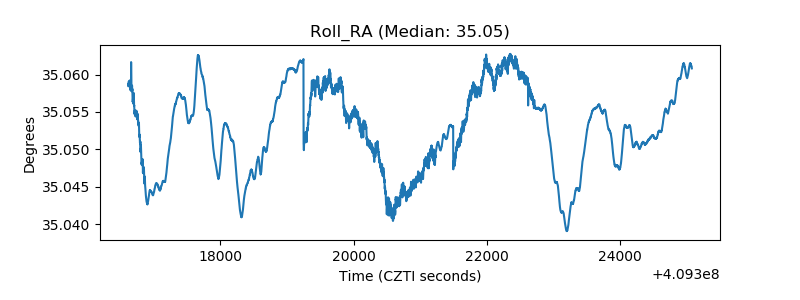 |
| Veto Counter | 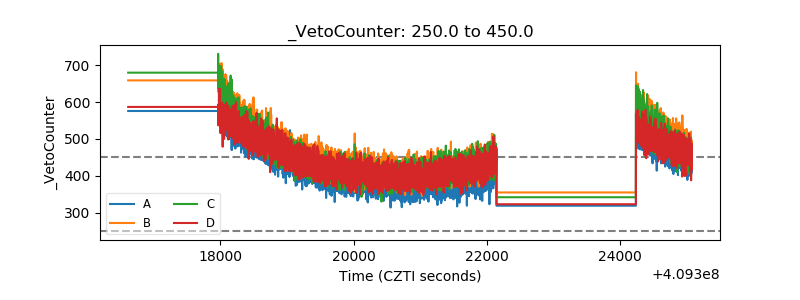 |