| Param | Original file | Final file |
|---|---|---|
| Filename | modeM0/AS1T05_067T01_9000005432_39100cztM0_level2.fits | modeM0/AS1T05_067T01_9000005432_39100cztM0_level2_quad_clean.evt |
| Size (bytes) | 420,500,160 | 94,360,320 |
| Size | 401.0 MB | 90.0 MB |
| Events in quadrant A | 3,418,829 | 670,640 |
| Events in quadrant B | 2,707,303 | 680,426 |
| Events in quadrant C | 3,514,492 | 624,032 |
| Events in quadrant D | 5,520,498 | 517,146 |
| Mode M0 | |||
|---|---|---|---|
| Quadrant | BADHDUFLAG | Total packets | Discarded packets |
| A | 0 | 13578 | 3 |
| B | 0 | 11276 | 2 |
| C | 0 | 13791 | 2 |
| D | 0 | 19979 | 2 |
| Mode SS | |||
|---|---|---|---|
| Quadrant | BADHDUFLAG | Total packets | Discarded packets |
| A | 0 | 108 | 0 |
| B | 0 | 108 | 0 |
| C | 0 | 108 | 0 |
| D | 0 | 108 | 0 |
| Mode M9 | |||
|---|---|---|---|
| Quadrant | BADHDUFLAG | Total packets | Discarded packets |
| A | 0 | 21 | 0 |
| B | 0 | 21 | 0 |
| C | 0 | 21 | 0 |
| D | 0 | 21 | 0 |
| Quadrant | Total seconds | Saturated seconds | Saturation percentage |
|---|---|---|---|
| A | 5207 | 16 | 0.307279% |
| B | 5207 | 37 | 0.710582% |
| C | 5207 | 80 | 1.536393% |
| D | 5207 | 791 | 15.191089% |
Noise dominated data is calculated using 1-second bins in cleaned event files. If a bin has >2000 counts, and if more than 50% of those come from <1% of pixels, then it is considered to be noise-dominated and hence unusable.
| Quadrant | # 1 sec bins | Bins with >0 counts | Bins with >2000 counts | High rate bins dominated by noise | Noise dominated (total time) | Noise dominated (detector-on time) | Marked lightcurve |
|---|---|---|---|---|---|---|---|
| A | 7359 | 5208 | 5 | 5 | 0.07% | 0.10% | 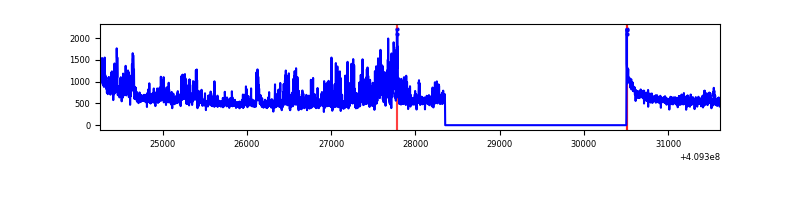 |
| B | 7359 | 5208 | 15 | 15 | 0.20% | 0.29% | 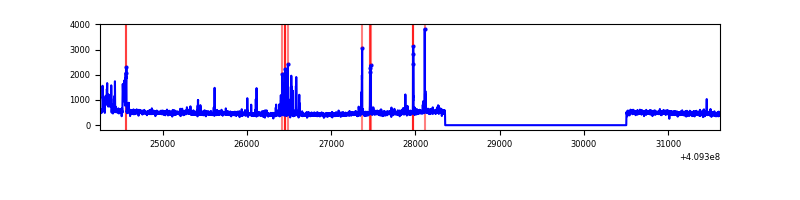 |
| C | 7359 | 5208 | 101 | 101 | 1.37% | 1.94% | 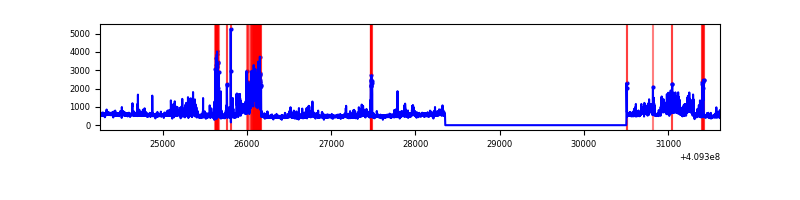 |
| D | 7359 | 5208 | 673 | 673 | 9.15% | 12.92% | 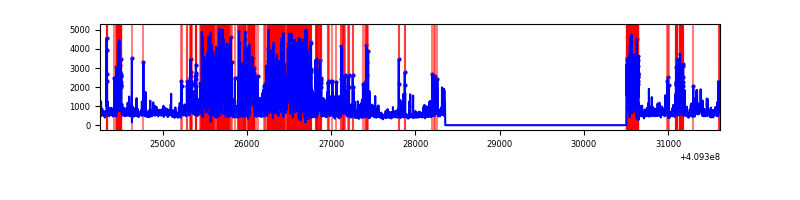 |
Top three noisy pixels from each quadrant. If the there are fewer than three noisy pixels in the level2.evt file, extra rows are filled as -1
| Pixel properties | Quadrant properties | ||||||
|---|---|---|---|---|---|---|---|
| Quadrant | DetID | PixID | Counts | Sigma | Mean | Median | Sigma |
| A | 12 | 16 | 526357 | 4208.77 | 618 | 608 | 124.9 |
| A | 10 | 83 | 401747 | 3211.23 | 618 | 608 | 124.9 |
| A | 12 | 194 | 78938 | 627.05 | 618 | 608 | 124.9 |
| B | 5 | 184 | 188410 | 1597.26 | 611 | 595 | 117.6 |
| B | 5 | 172 | 60961 | 513.38 | 611 | 595 | 117.6 |
| B | 0 | 230 | 39381 | 329.85 | 611 | 595 | 117.6 |
| C | 15 | 208 | 795962 | 5911.74 | 582 | 587 | 134.5 |
| C | 9 | 187 | 222244 | 1647.5 | 582 | 587 | 134.5 |
| C | 15 | 214 | 218257 | 1617.86 | 582 | 587 | 134.5 |
| D | 5 | 222 | 2490026 | 18557.05 | 551 | 535 | 134.2 |
| D | 12 | 235 | 260275 | 1936.14 | 551 | 535 | 134.2 |
| D | 12 | 233 | 259787 | 1932.5 | 551 | 535 | 134.2 |
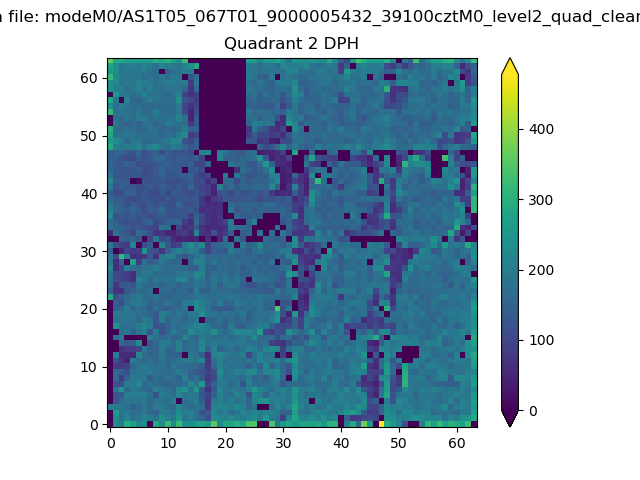
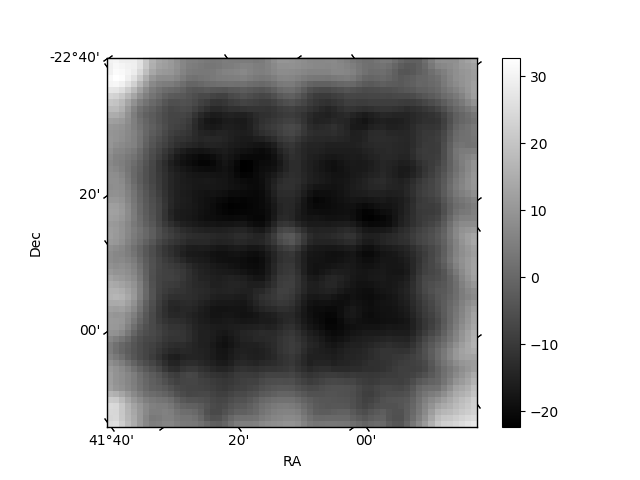
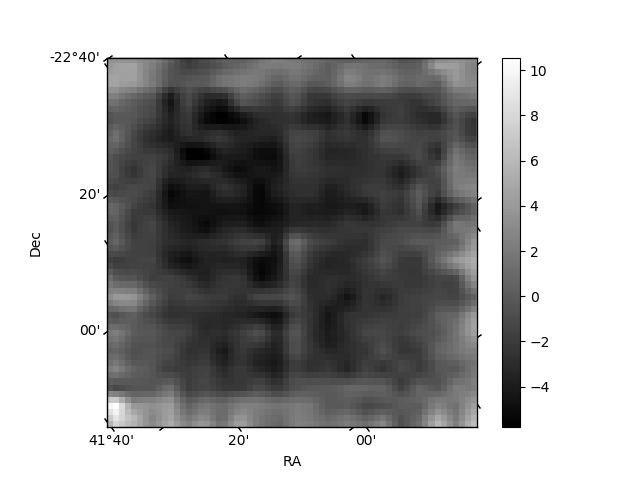
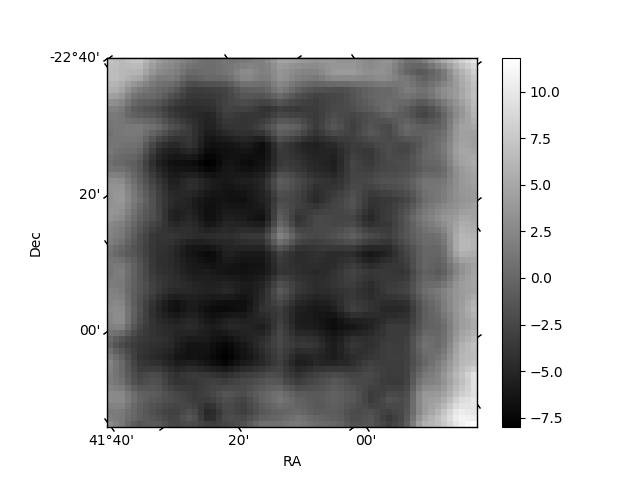
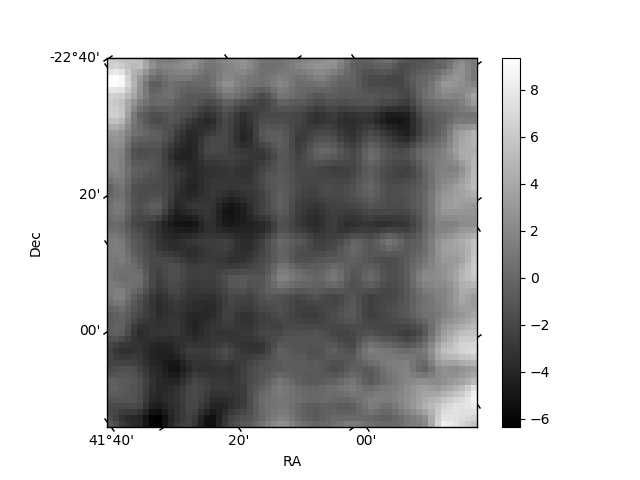
Histogram calculated using DETX and DETY for each event in the final _common_clean file
| Quadrant A | 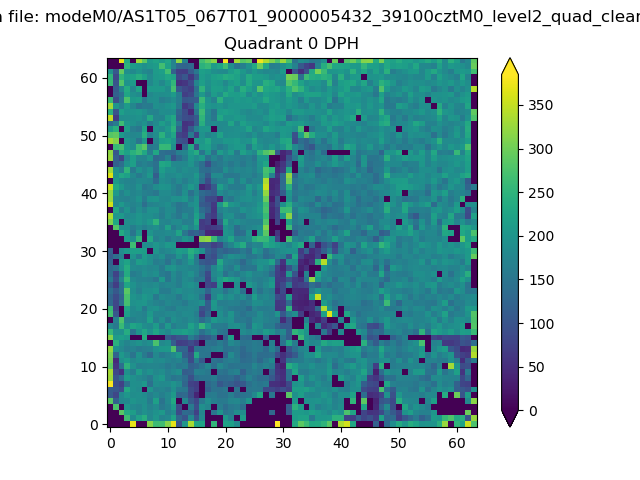 |
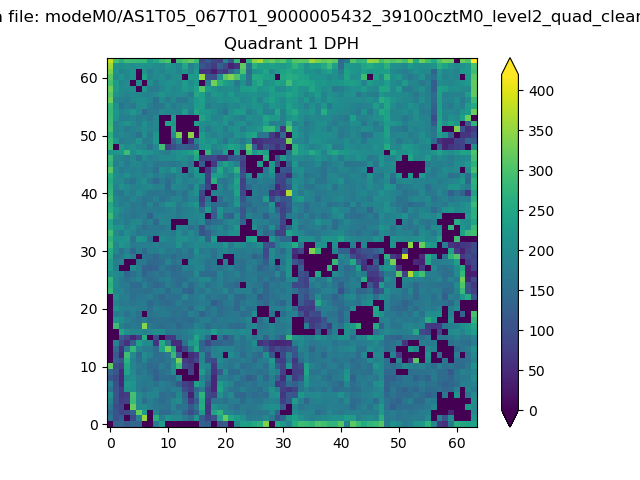 |
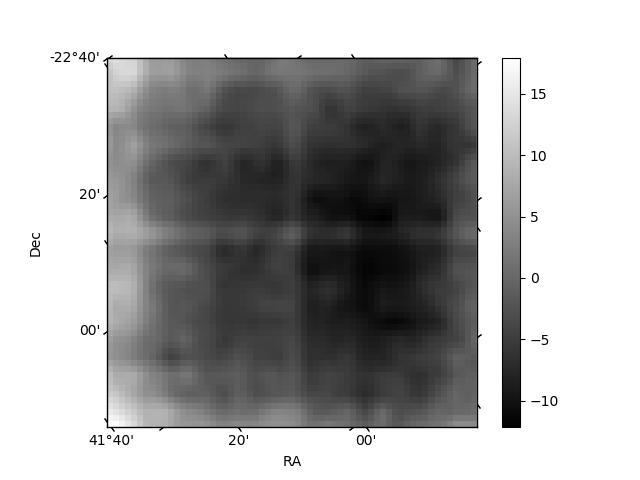
Quadrant B |
|---|---|---|---|
| Quadrant D | 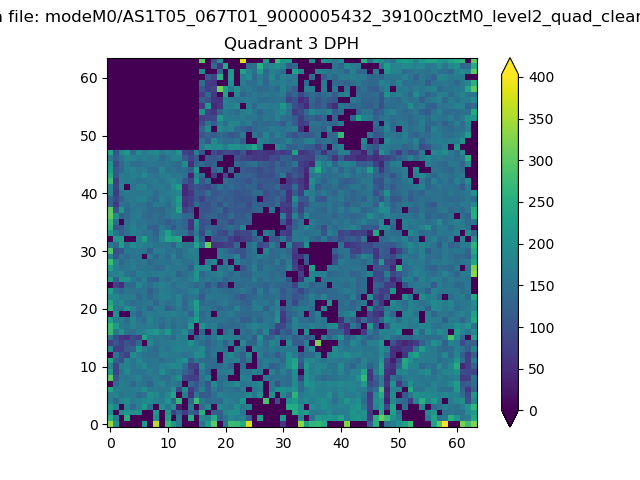 |
 |
Quadrant C |
| Plot type | Count rate plots | Images |
|---|---|---|
| Comparison with Poisson distribution Blue bars denote a histogram of data divided into 1 sec bins. Red curve is a Poisson curve with rate = median count rate of data. |
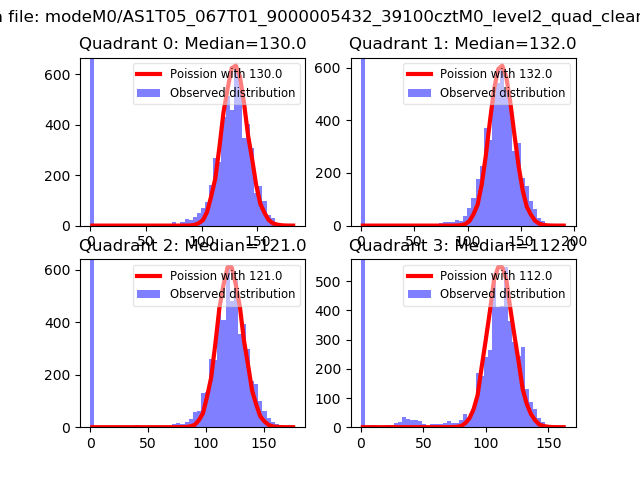 |
 |
| Quadrant-wise count rates Data is divided into 100 sec bins |
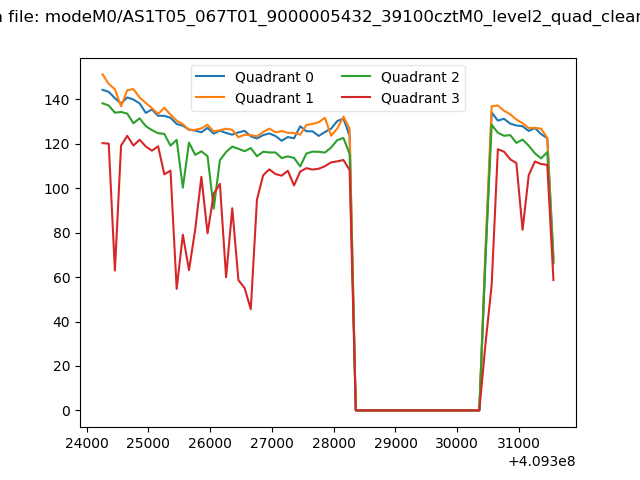 |
|
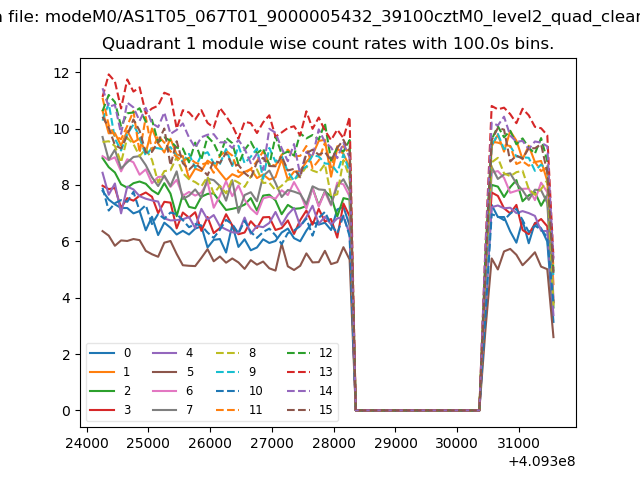
| Module-wise count rates for Quadrant A Data is divided into 100 sec bins |
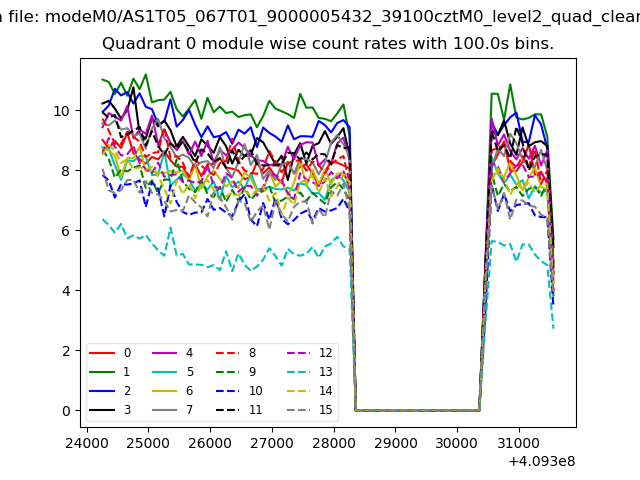 |
 |
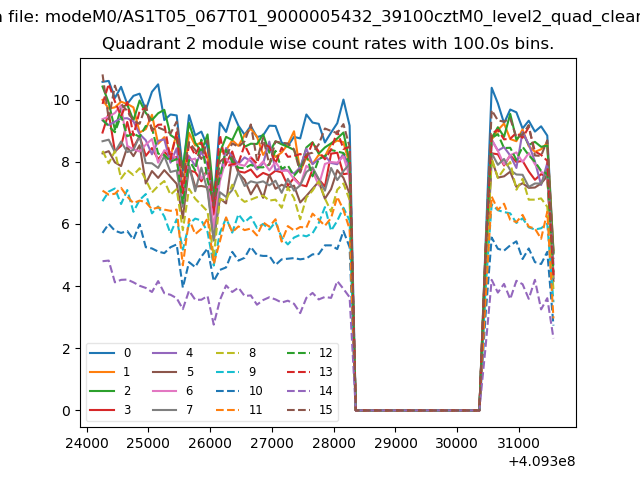
| Module-wise count rates for Quadrant B Data is divided into 100 sec bins |
 |
 |
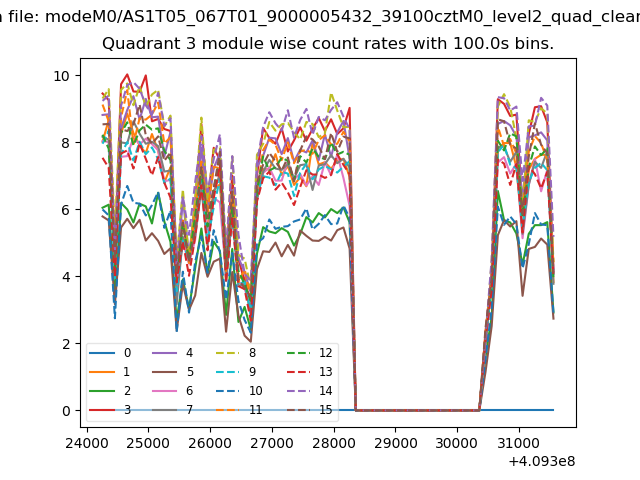
| Module-wise count rates for Quadrant C Data is divided into 100 sec bins |
 |
 |
| Module-wise count rates for Quadrant D Data is divided into 100 sec bins |
 |
 |
| Parameter | Plot |
|---|---|
| CZT HV Monitor | 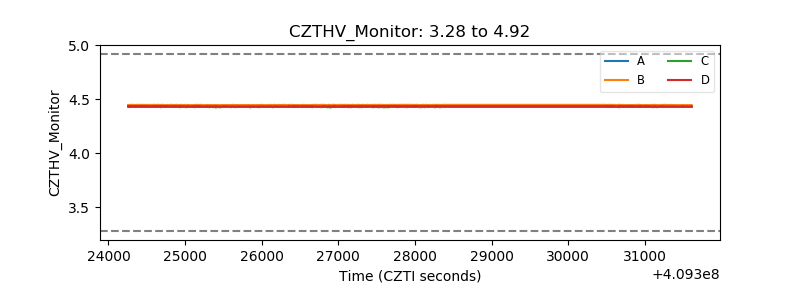 |
| D_VDD | 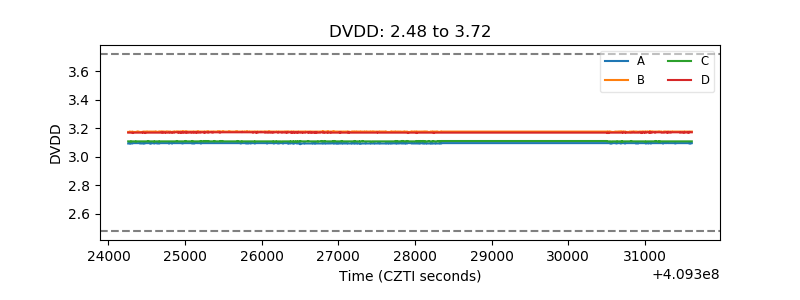 |
| Temperature 1 | 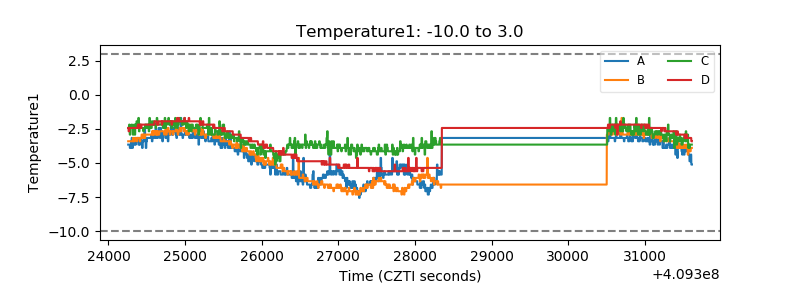 |
| Veto HV Monitor | 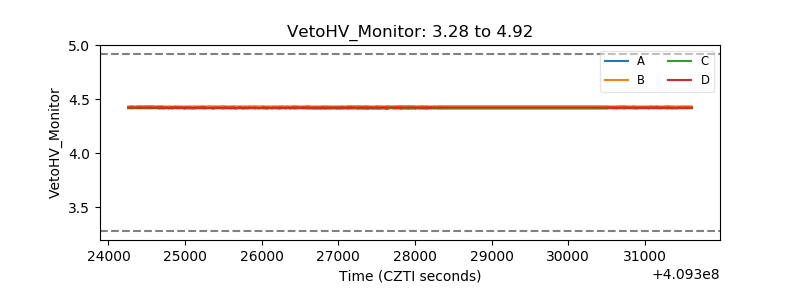 |
| Veto LLD | 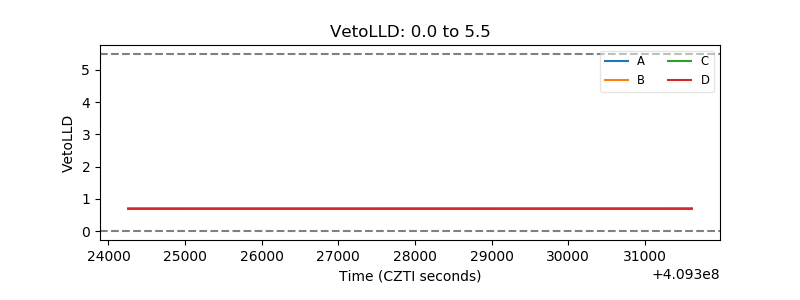 |
| Alpha Counter | 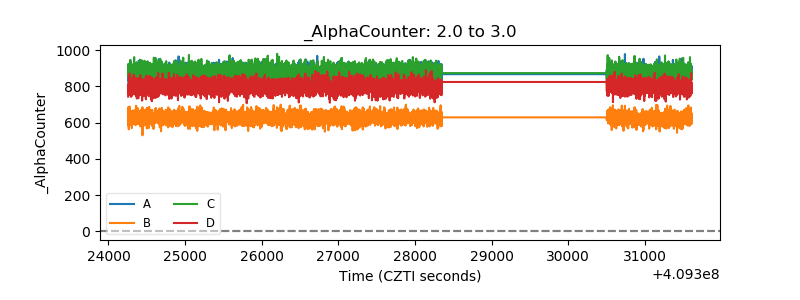 |
| _CPM_Rate | 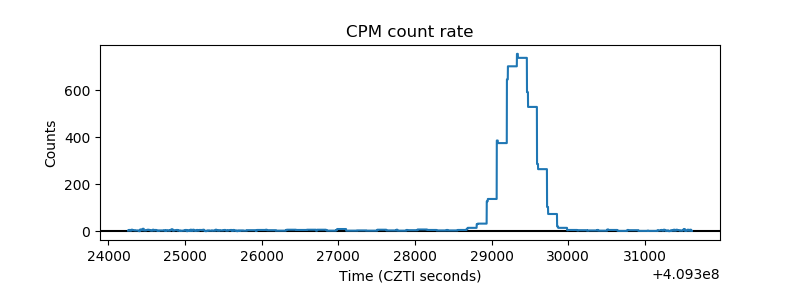 |
| CZT Counter |  |
| +2.5 Volts monitor |  |
| +5 Volts monitor | 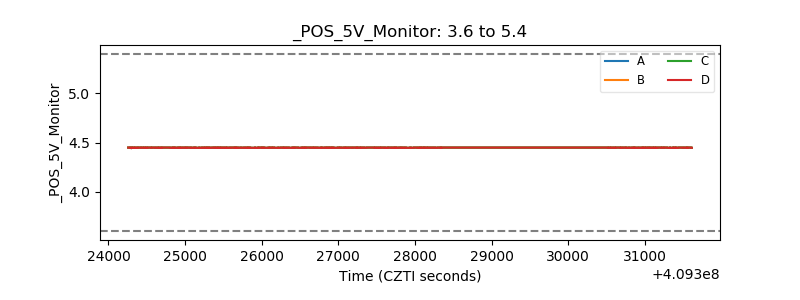 |
| _ROLL_ROT | 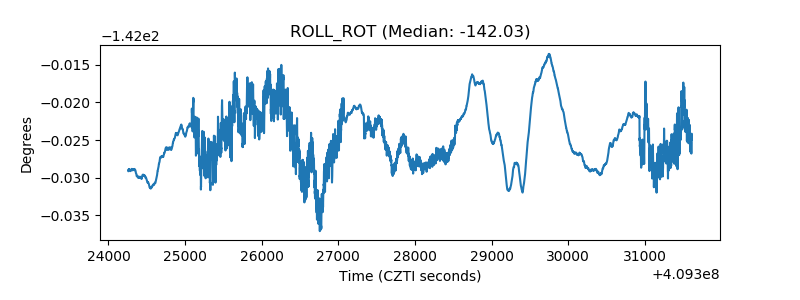 |
| _Roll_DEC | 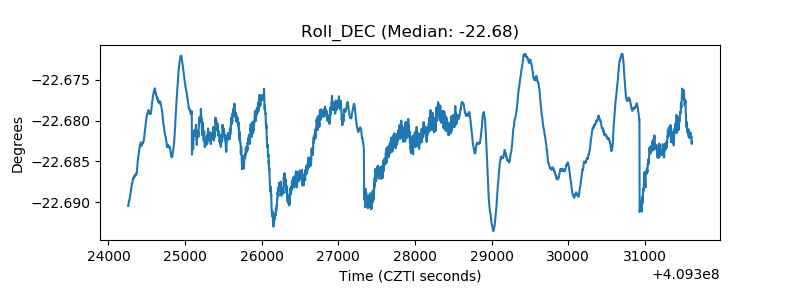 |
| _Roll_RA | 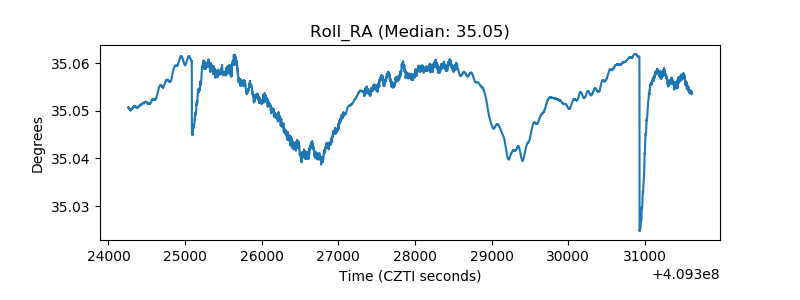 |
| Veto Counter | 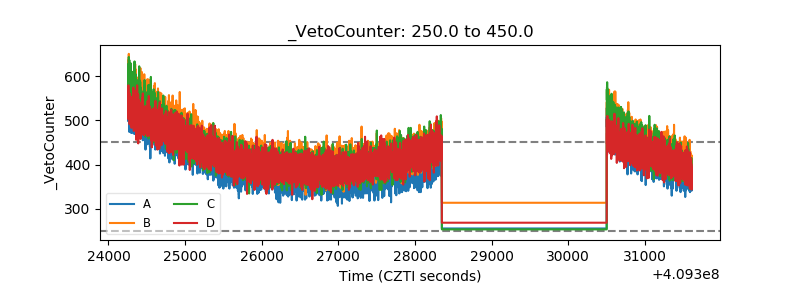 |