| Param | Original file | Final file |
|---|---|---|
| Filename | modeM0/AS1T05_067T01_9000005432_39101cztM0_level2.fits | modeM0/AS1T05_067T01_9000005432_39101cztM0_level2_quad_clean.evt |
| Size (bytes) | 357,719,040 | 89,300,160 |
| Size | 341.1 MB | 85.2 MB |
| Events in quadrant A | 2,917,346 | 614,895 |
| Events in quadrant B | 2,527,719 | 627,272 |
| Events in quadrant C | 3,548,048 | 580,524 |
| Events in quadrant D | 3,852,914 | 525,005 |
| Mode M0 | |||
|---|---|---|---|
| Quadrant | BADHDUFLAG | Total packets | Discarded packets |
| A | 0 | 11851 | 2 |
| B | 0 | 10869 | 1 |
| C | 0 | 13911 | 1 |
| D | 0 | 14881 | 1 |
| Mode SS | |||
|---|---|---|---|
| Quadrant | BADHDUFLAG | Total packets | Discarded packets |
| A | 0 | 104 | 0 |
| B | 0 | 104 | 0 |
| C | 0 | 104 | 0 |
| D | 0 | 104 | 0 |
| Mode M9 | |||
|---|---|---|---|
| Quadrant | BADHDUFLAG | Total packets | Discarded packets |
| A | 0 | 21 | 0 |
| B | 0 | 21 | 0 |
| C | 0 | 21 | 0 |
| D | 0 | 21 | 0 |
| Quadrant | Total seconds | Saturated seconds | Saturation percentage |
|---|---|---|---|
| A | 5084 | 29 | 0.570417% |
| B | 5084 | 20 | 0.393391% |
| C | 5084 | 32 | 0.629426% |
| D | 5084 | 270 | 5.310779% |
Noise dominated data is calculated using 1-second bins in cleaned event files. If a bin has >2000 counts, and if more than 50% of those come from <1% of pixels, then it is considered to be noise-dominated and hence unusable.
| Quadrant | # 1 sec bins | Bins with >0 counts | Bins with >2000 counts | High rate bins dominated by noise | Noise dominated (total time) | Noise dominated (detector-on time) | Marked lightcurve |
|---|---|---|---|---|---|---|---|
| A | 7175 | 5085 | 19 | 19 | 0.26% | 0.37% | 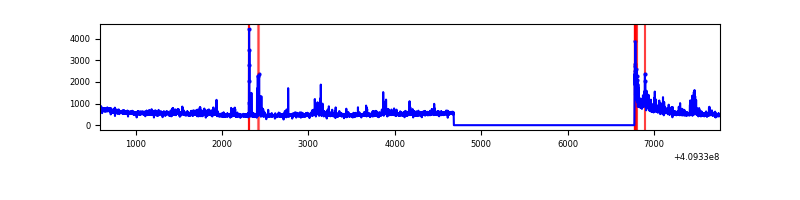 |
| B | 7175 | 5085 | 5 | 5 | 0.07% | 0.10% | 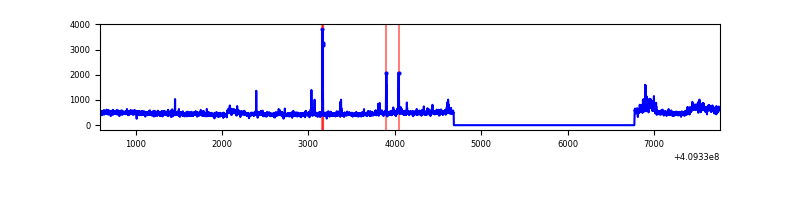 |
| C | 7175 | 5085 | 41 | 41 | 0.57% | 0.81% | 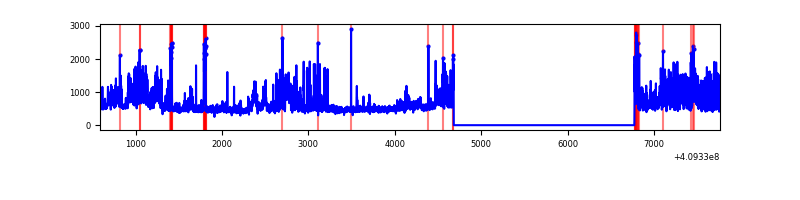 |
| D | 7175 | 5085 | 285 | 285 | 3.97% | 5.60% | 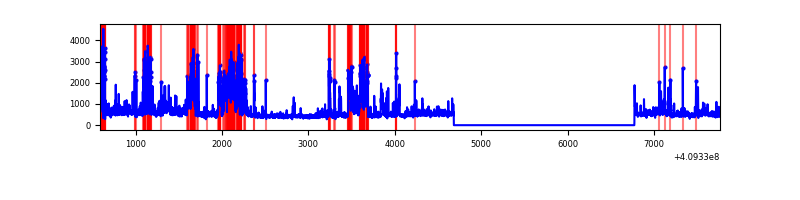 |
Top three noisy pixels from each quadrant. If the there are fewer than three noisy pixels in the level2.evt file, extra rows are filled as -1
| Pixel properties | Quadrant properties | ||||||
|---|---|---|---|---|---|---|---|
| Quadrant | DetID | PixID | Counts | Sigma | Mean | Median | Sigma |
| A | 10 | 83 | 367966 | 3154.81 | 575 | 566 | 116.5 |
| A | 12 | 16 | 164767 | 1409.97 | 575 | 566 | 116.5 |
| A | 7 | 3 | 81402 | 694.13 | 575 | 566 | 116.5 |
| B | 5 | 184 | 151030 | 1352.17 | 573 | 559 | 111.3 |
| B | 5 | 172 | 56010 | 498.3 | 573 | 559 | 111.3 |
| B | 15 | 32 | 32081 | 283.27 | 573 | 559 | 111.3 |
| C | 15 | 208 | 1041731 | 8144.01 | 549 | 555 | 127.8 |
| C | 15 | 214 | 214858 | 1676.26 | 549 | 555 | 127.8 |
| C | 9 | 187 | 141683 | 1103.89 | 549 | 555 | 127.8 |
| D | 5 | 222 | 770496 | 5802.67 | 541 | 526 | 132.7 |
| D | 2 | 249 | 485933 | 3658.14 | 541 | 526 | 132.7 |
| D | 12 | 233 | 223100 | 1677.37 | 541 | 526 | 132.7 |
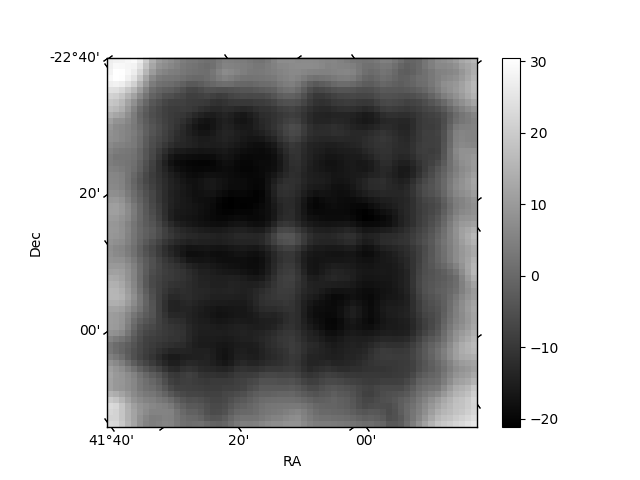
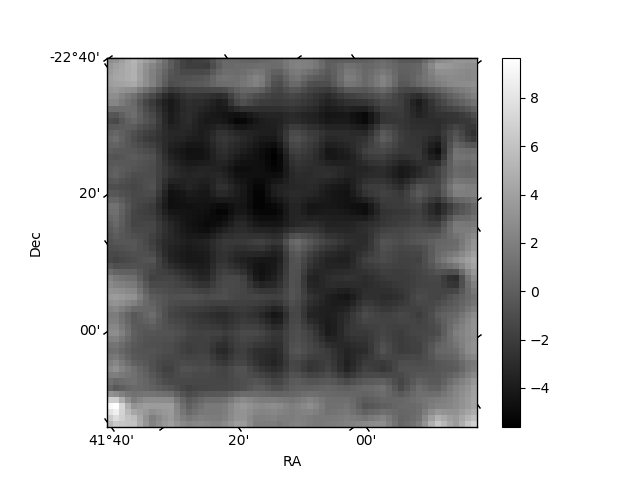
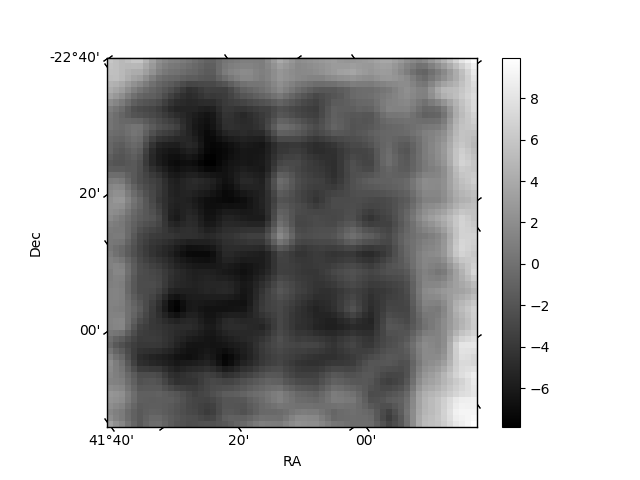
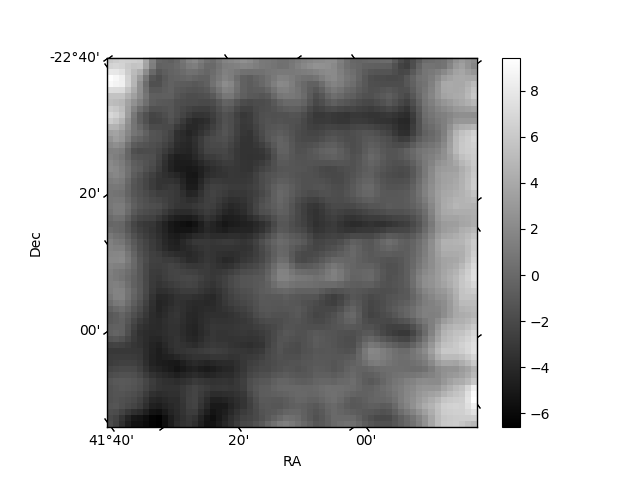
Histogram calculated using DETX and DETY for each event in the final _common_clean file
| Quadrant A | 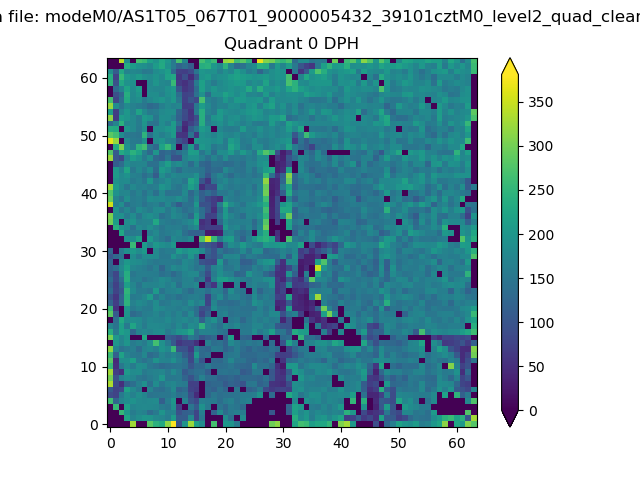 |
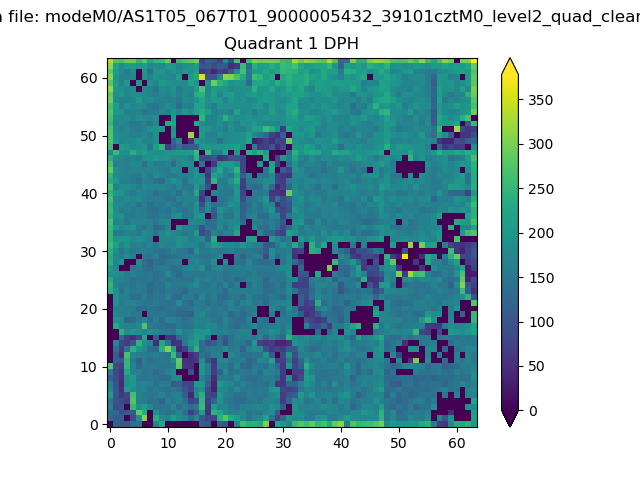 |
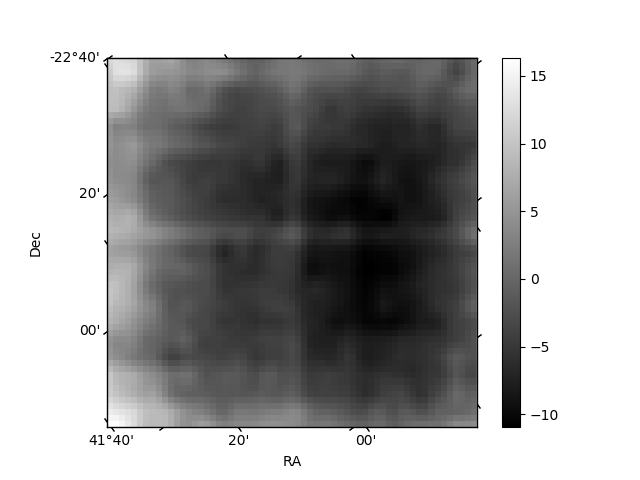
Quadrant B |
|---|---|---|---|
| Quadrant D | 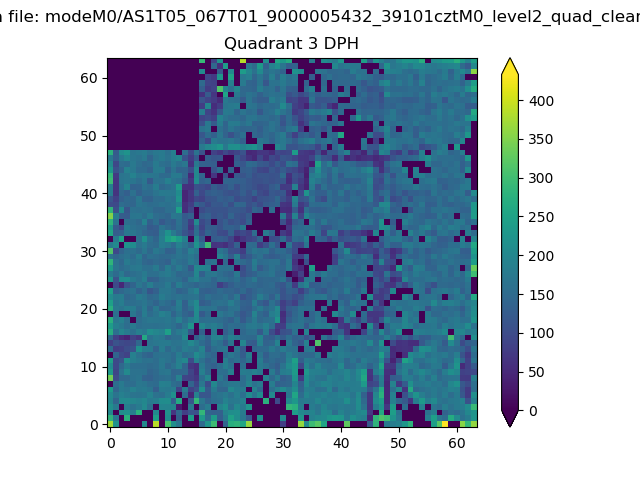 |
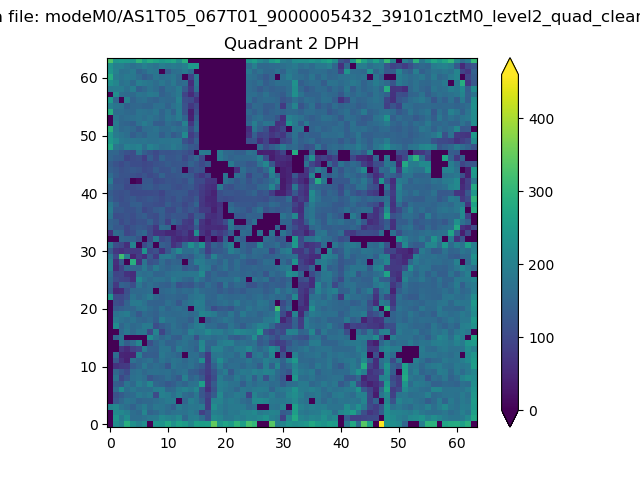 |
Quadrant C |
| Plot type | Count rate plots | Images |
|---|---|---|
| Comparison with Poisson distribution Blue bars denote a histogram of data divided into 1 sec bins. Red curve is a Poisson curve with rate = median count rate of data. |
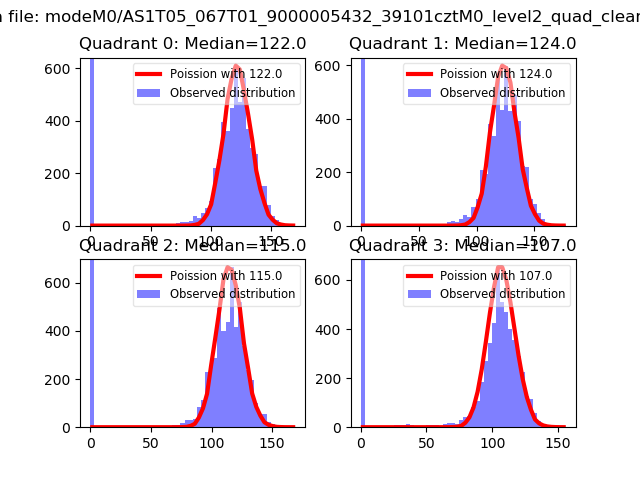 |
 |
| Quadrant-wise count rates Data is divided into 100 sec bins |
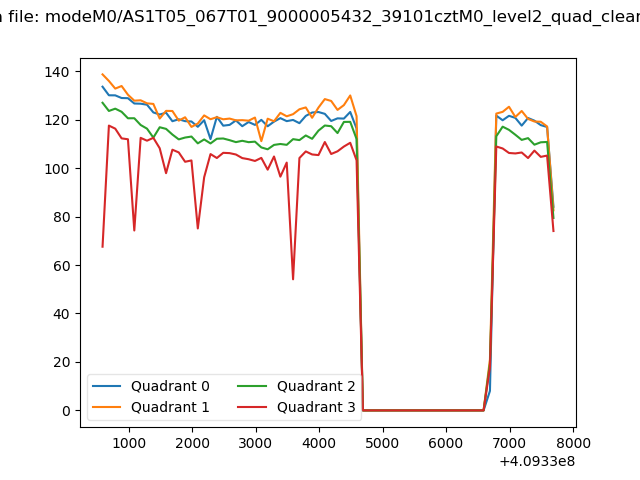 |
|
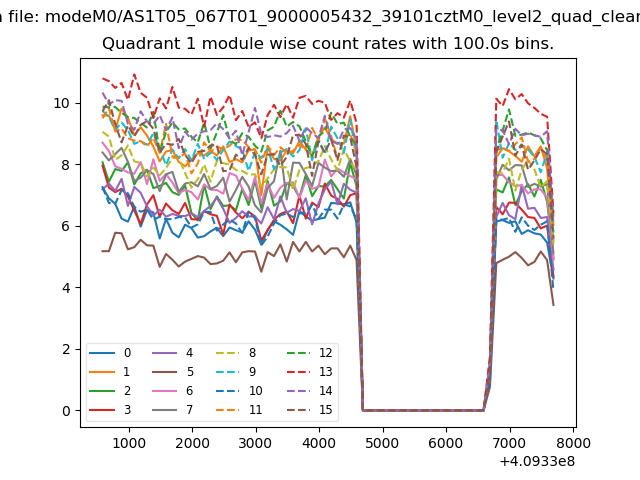
| Module-wise count rates for Quadrant A Data is divided into 100 sec bins |
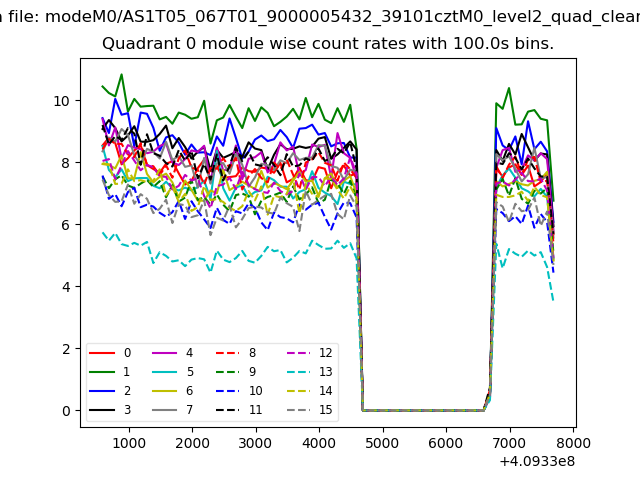 |
 |
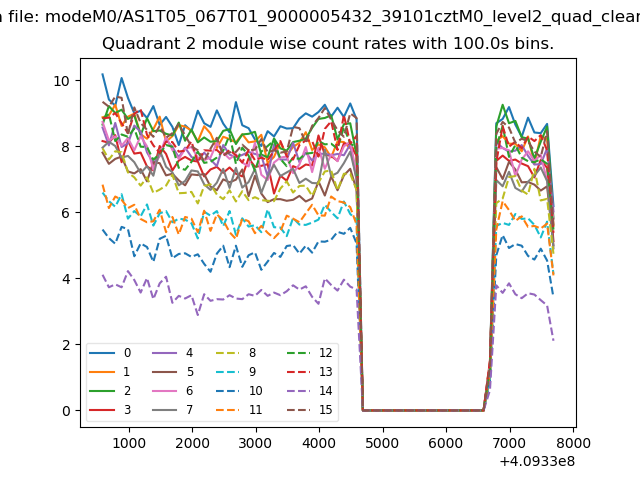
| Module-wise count rates for Quadrant B Data is divided into 100 sec bins |
 |
 |
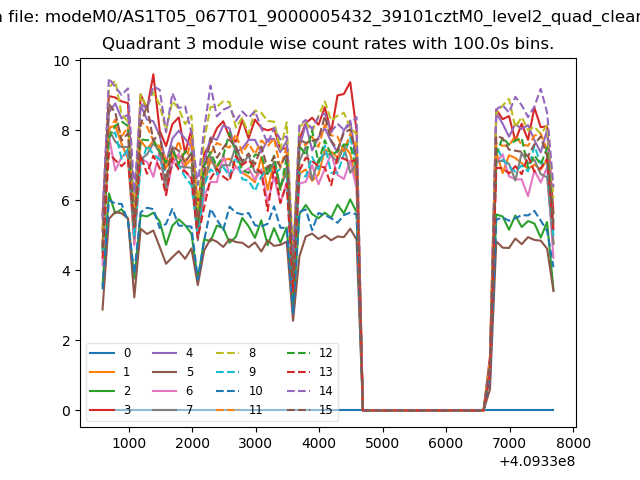
| Module-wise count rates for Quadrant C Data is divided into 100 sec bins |
 |
 |
| Module-wise count rates for Quadrant D Data is divided into 100 sec bins |
 |
 |
| Parameter | Plot |
|---|---|
| CZT HV Monitor | 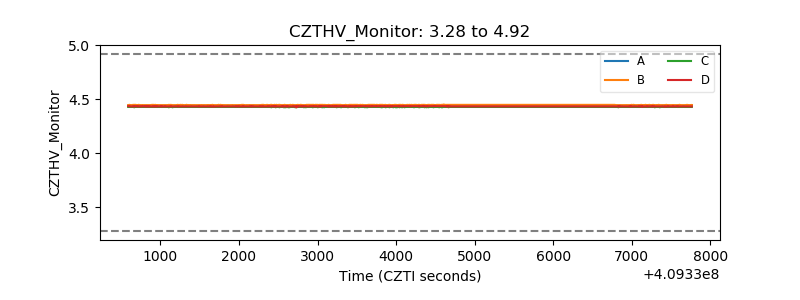 |
| D_VDD | 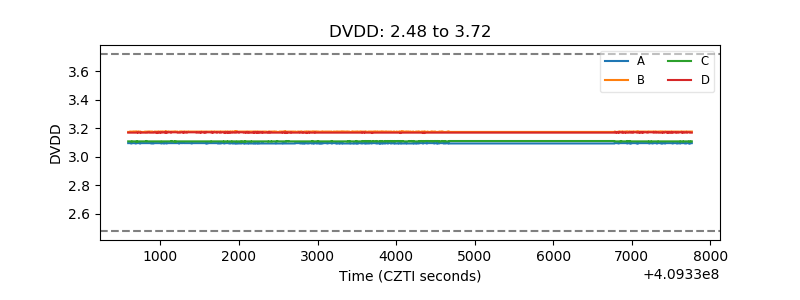 |
| Temperature 1 | 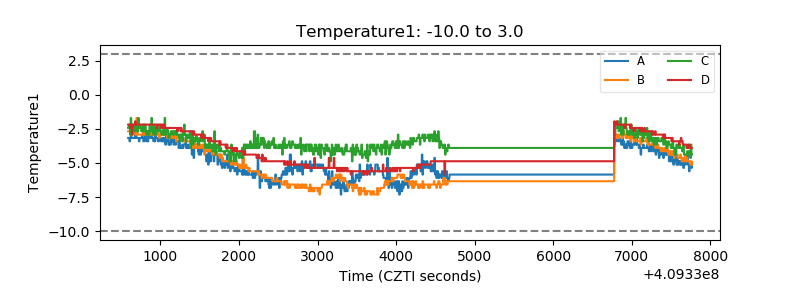 |
| Veto HV Monitor | 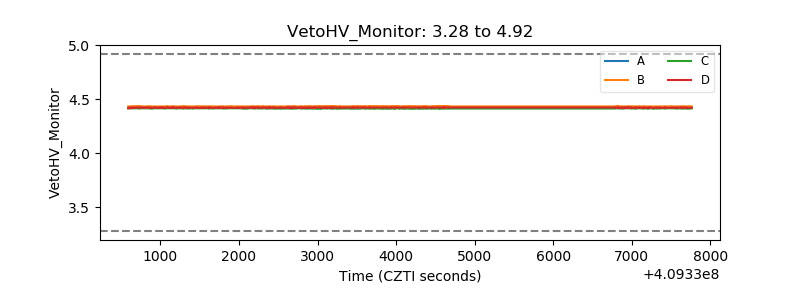 |
| Veto LLD | 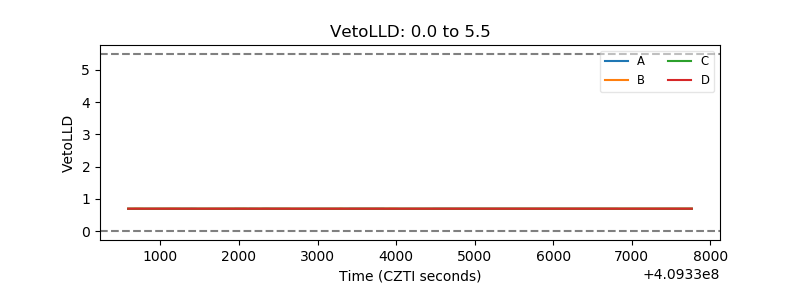 |
| Alpha Counter | 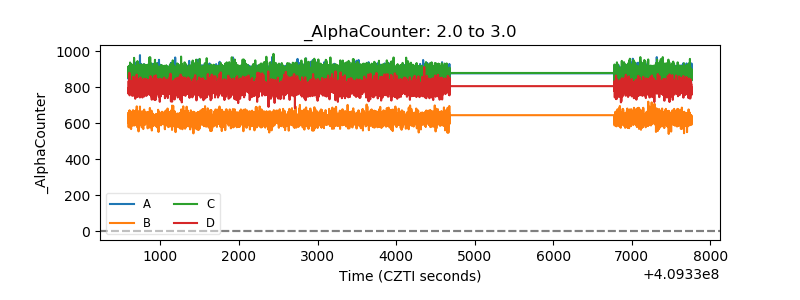 |
| _CPM_Rate | 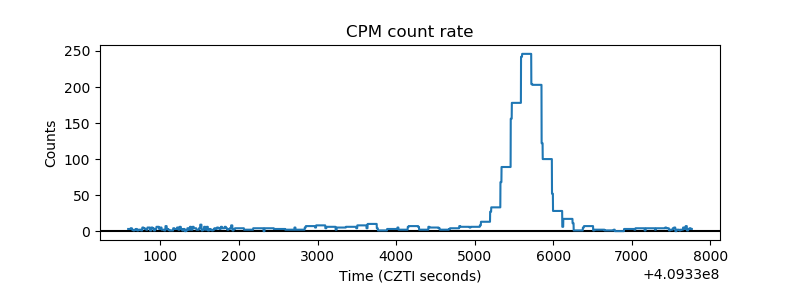 |
| CZT Counter | 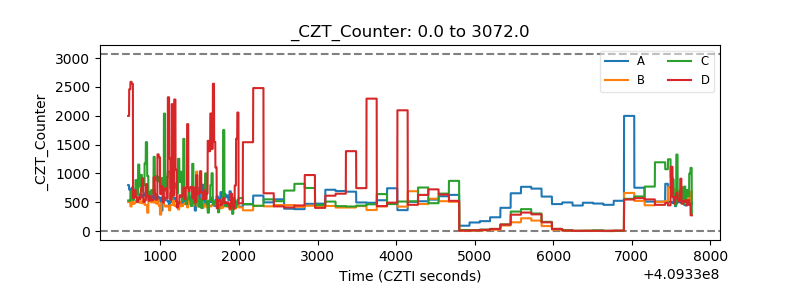 |
| +2.5 Volts monitor | 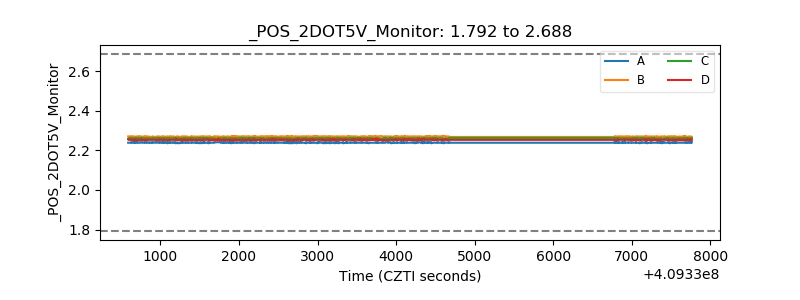 |
| +5 Volts monitor | 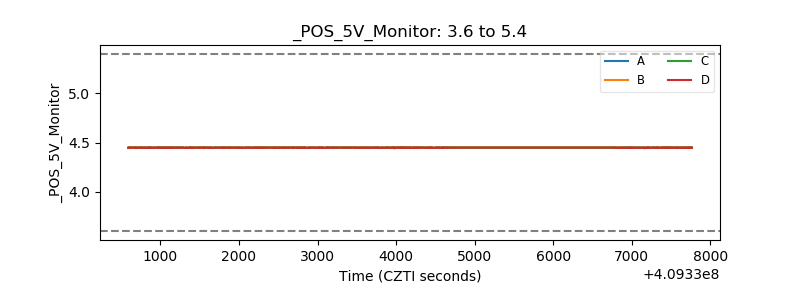 |
| _ROLL_ROT | 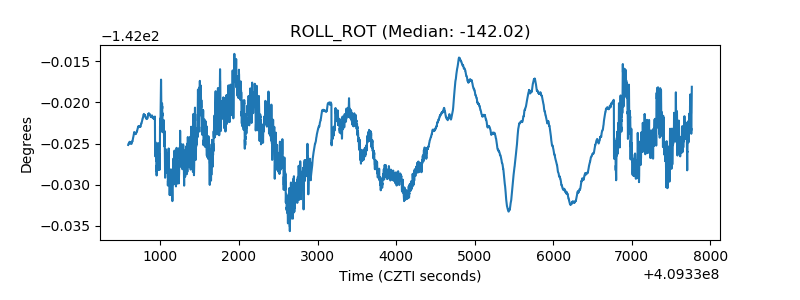 |
| _Roll_DEC | 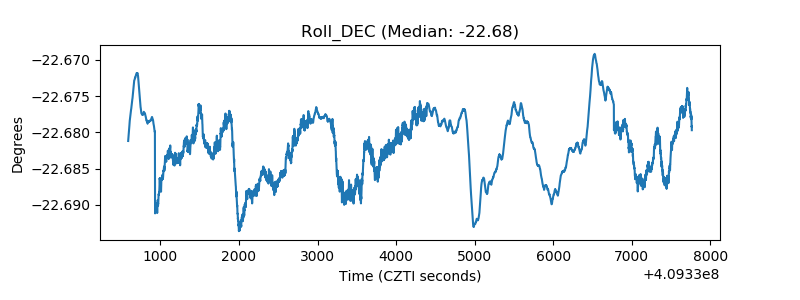 |
| _Roll_RA | 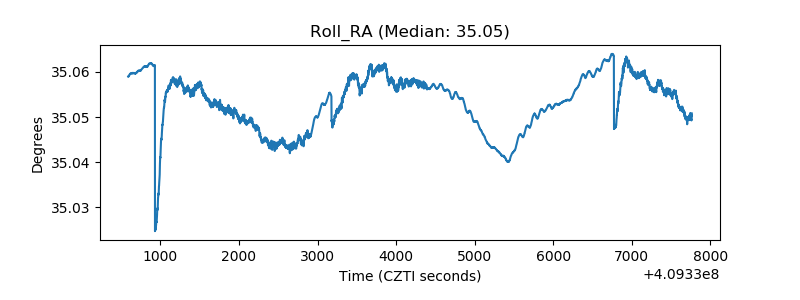 |
| Veto Counter | 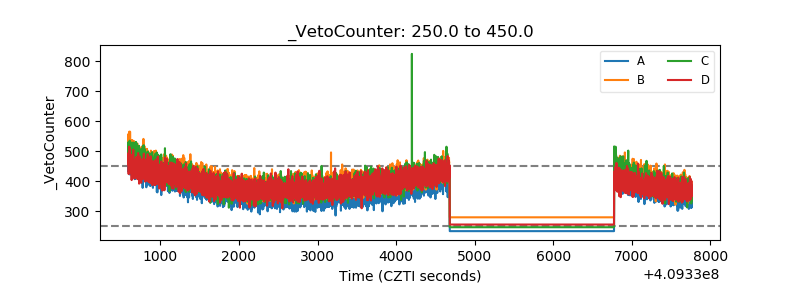 |