| Param | Original file | Final file |
|---|---|---|
| Filename | modeM0/AS1T05_067T01_9000005432_39102cztM0_level2.fits | modeM0/AS1T05_067T01_9000005432_39102cztM0_level2_quad_clean.evt |
| Size (bytes) | 342,115,200 | 88,113,600 |
| Size | 326.3 MB | 84.0 MB |
| Events in quadrant A | 2,869,474 | 601,133 |
| Events in quadrant B | 2,645,894 | 611,588 |
| Events in quadrant C | 3,919,760 | 559,606 |
| Events in quadrant D | 2,826,532 | 534,003 |
| Mode M0 | |||
|---|---|---|---|
| Quadrant | BADHDUFLAG | Total packets | Discarded packets |
| A | 0 | 11712 | 2 |
| B | 0 | 11373 | 1 |
| C | 0 | 15052 | 1 |
| D | 0 | 11904 | 1 |
| Mode SS | |||
|---|---|---|---|
| Quadrant | BADHDUFLAG | Total packets | Discarded packets |
| A | 0 | 104 | 0 |
| B | 0 | 104 | 0 |
| C | 0 | 104 | 0 |
| D | 0 | 104 | 0 |
| Mode M9 | |||
|---|---|---|---|
| Quadrant | BADHDUFLAG | Total packets | Discarded packets |
| A | 0 | 24 | 0 |
| B | 0 | 24 | 0 |
| C | 0 | 24 | 0 |
| D | 0 | 25 | 0 |
| Quadrant | Total seconds | Saturated seconds | Saturation percentage |
|---|---|---|---|
| A | 5169 | 29 | 0.561037% |
| B | 5169 | 15 | 0.290192% |
| C | 5169 | 157 | 3.037338% |
| D | 5169 | 47 | 0.909267% |
Noise dominated data is calculated using 1-second bins in cleaned event files. If a bin has >2000 counts, and if more than 50% of those come from <1% of pixels, then it is considered to be noise-dominated and hence unusable.
| Quadrant | # 1 sec bins | Bins with >0 counts | Bins with >2000 counts | High rate bins dominated by noise | Noise dominated (total time) | Noise dominated (detector-on time) | Marked lightcurve |
|---|---|---|---|---|---|---|---|
| A | 7023 | 5170 | 17 | 17 | 0.24% | 0.33% | 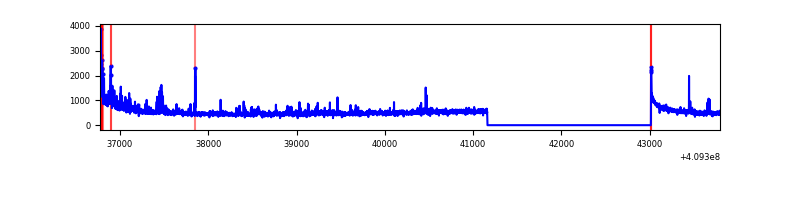 |
| B | 7023 | 5170 | 2 | 2 | 0.03% | 0.04% | 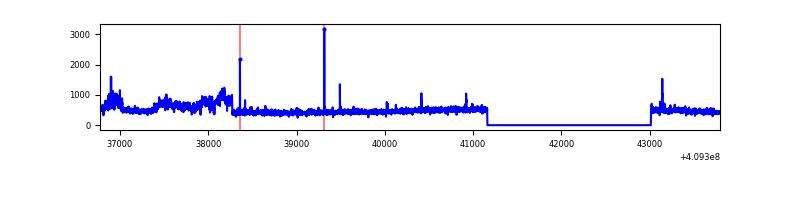 |
| C | 7023 | 5170 | 140 | 140 | 1.99% | 2.71% | 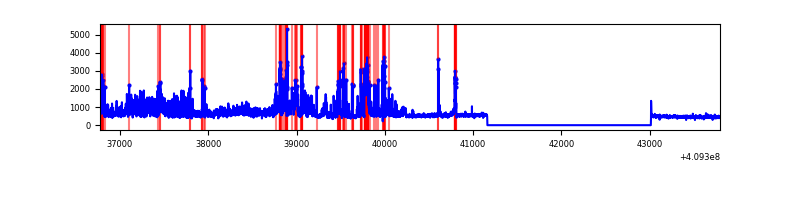 |
| D | 7023 | 5170 | 39 | 39 | 0.56% | 0.75% | 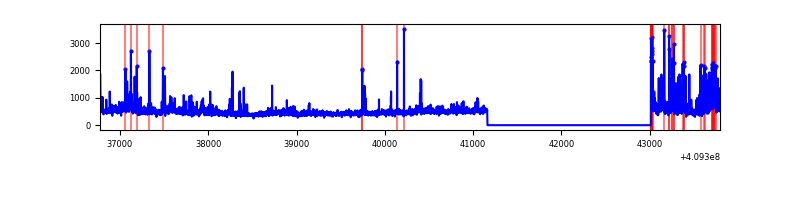 |
Top three noisy pixels from each quadrant. If the there are fewer than three noisy pixels in the level2.evt file, extra rows are filled as -1
| Pixel properties | Quadrant properties | ||||||
|---|---|---|---|---|---|---|---|
| Quadrant | DetID | PixID | Counts | Sigma | Mean | Median | Sigma |
| A | 10 | 83 | 403246 | 3446.05 | 574 | 563 | 116.9 |
| A | 12 | 16 | 112143 | 954.87 | 574 | 563 | 116.9 |
| A | 7 | 3 | 88610 | 753.48 | 574 | 563 | 116.9 |
| B | 5 | 184 | 303671 | 2752.64 | 571 | 557 | 110.1 |
| B | 0 | 230 | 41401 | 370.91 | 571 | 557 | 110.1 |
| B | 0 | 199 | 27753 | 246.97 | 571 | 557 | 110.1 |
| C | 15 | 208 | 868686 | 6776.43 | 549 | 553 | 128.1 |
| C | 9 | 187 | 634247 | 4946.46 | 549 | 553 | 128.1 |
| C | 15 | 214 | 219740 | 1710.92 | 549 | 553 | 128.1 |
| D | 12 | 235 | 236364 | 1754.25 | 552 | 537 | 134.4 |
| D | 2 | 249 | 130530 | 966.98 | 552 | 537 | 134.4 |
| D | 13 | 171 | 106232 | 786.24 | 552 | 537 | 134.4 |
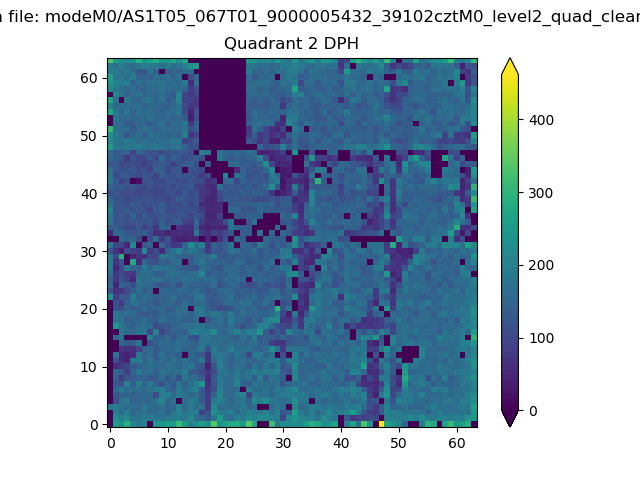
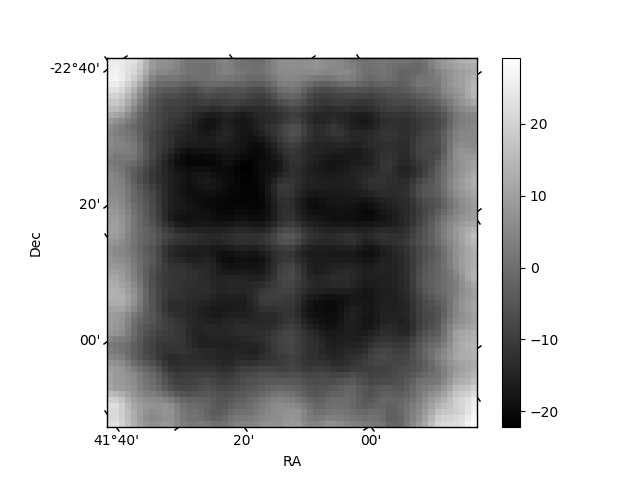
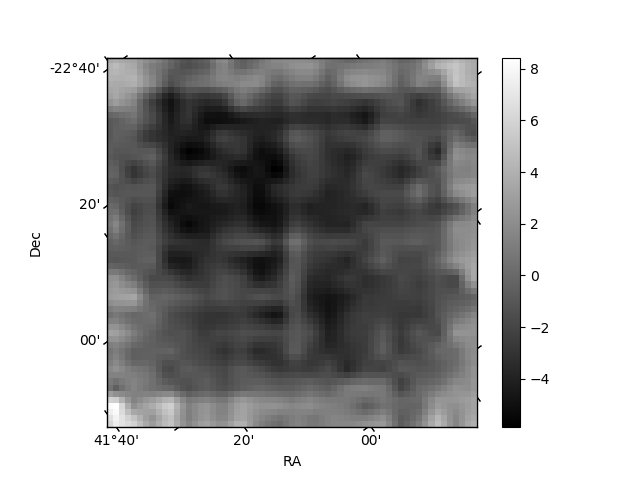
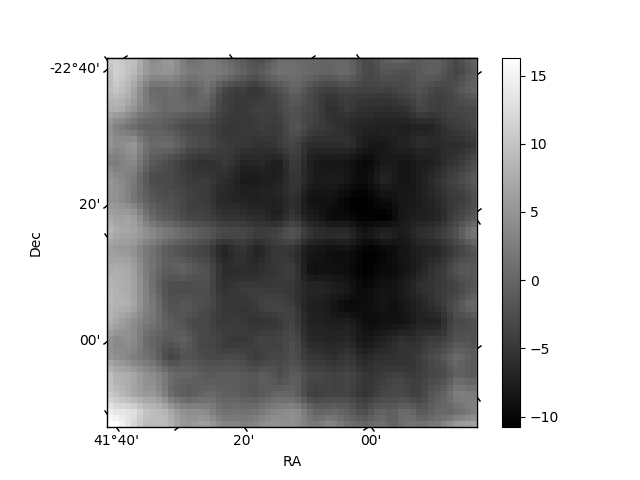
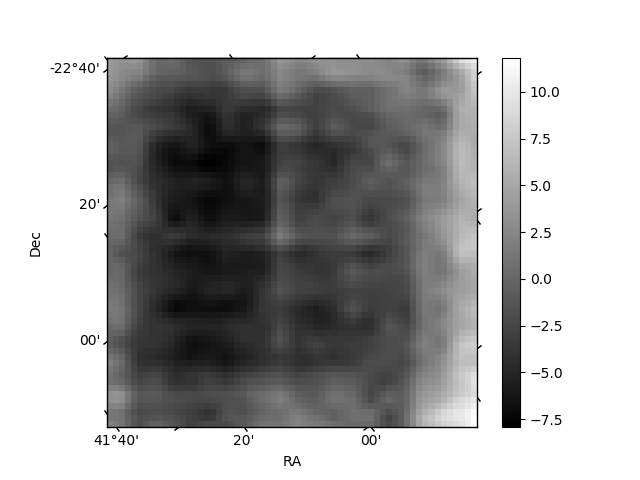
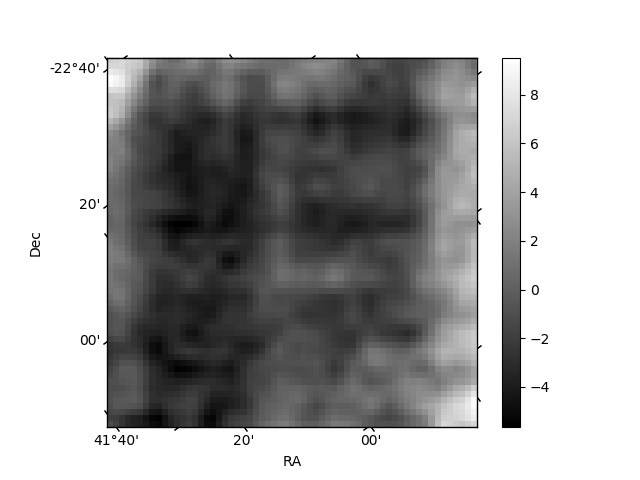
Histogram calculated using DETX and DETY for each event in the final _common_clean file
| Quadrant A | 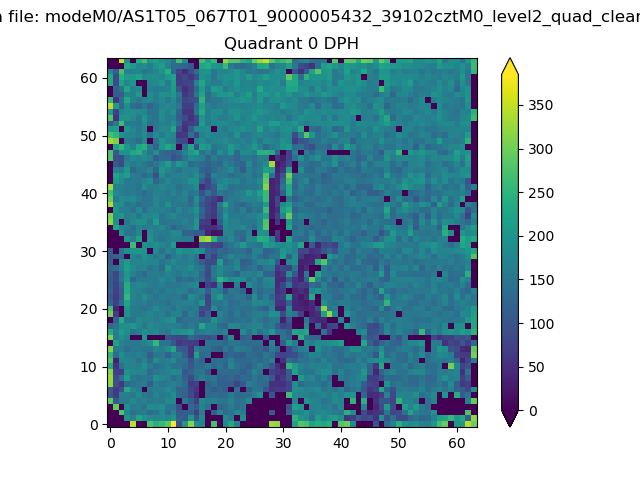 |
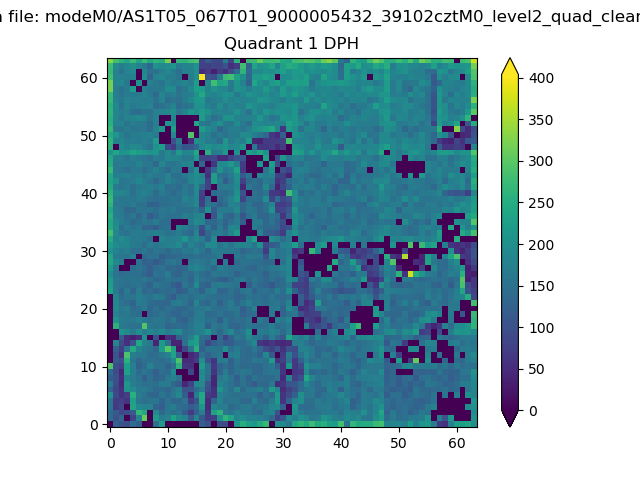 |
Quadrant B |
|---|---|---|---|
| Quadrant D | 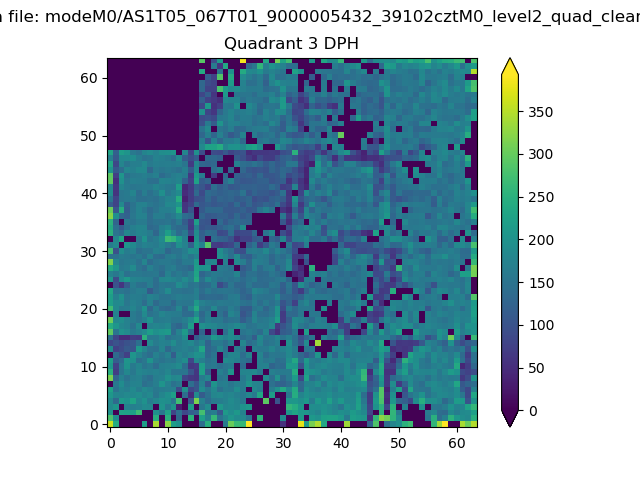 |
 |
Quadrant C |
| Plot type | Count rate plots | Images |
|---|---|---|
| Comparison with Poisson distribution Blue bars denote a histogram of data divided into 1 sec bins. Red curve is a Poisson curve with rate = median count rate of data. |
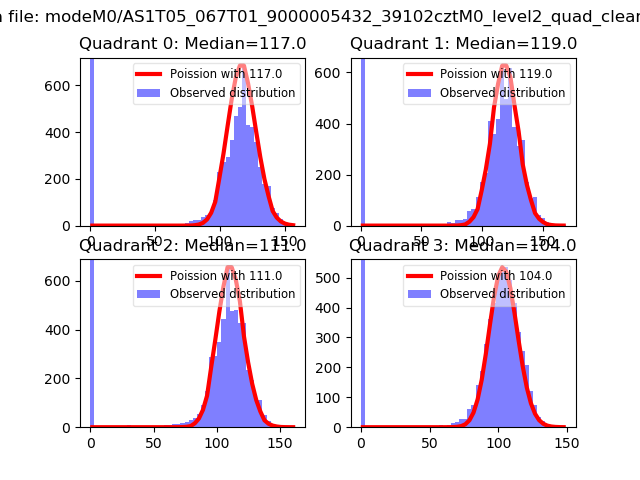 |
 |
| Quadrant-wise count rates Data is divided into 100 sec bins |
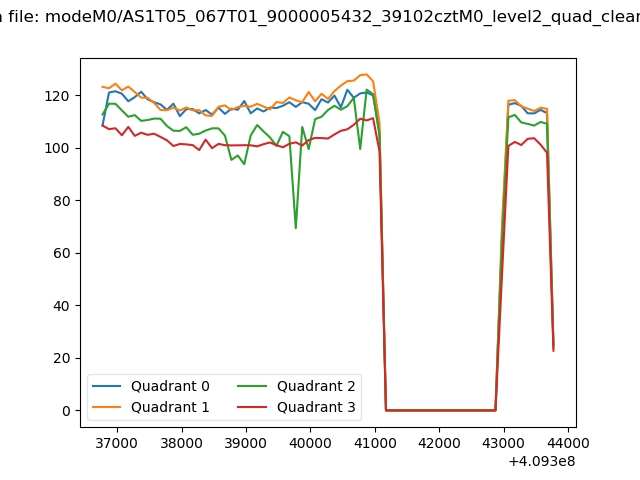 |
|
| Module-wise count rates for Quadrant A Data is divided into 100 sec bins |
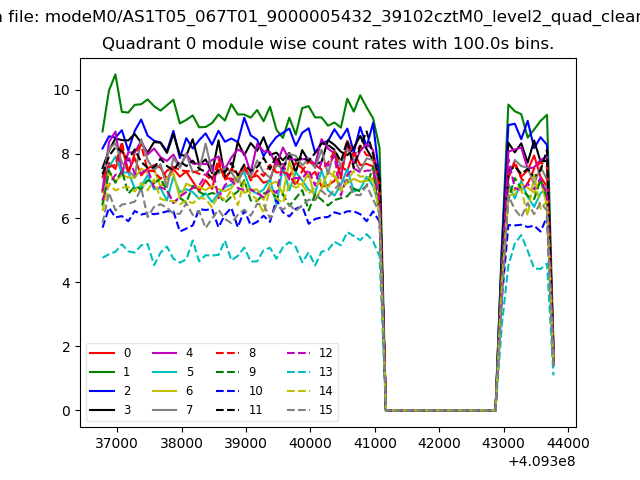 |
 |
| Module-wise count rates for Quadrant B Data is divided into 100 sec bins |
 |
 |
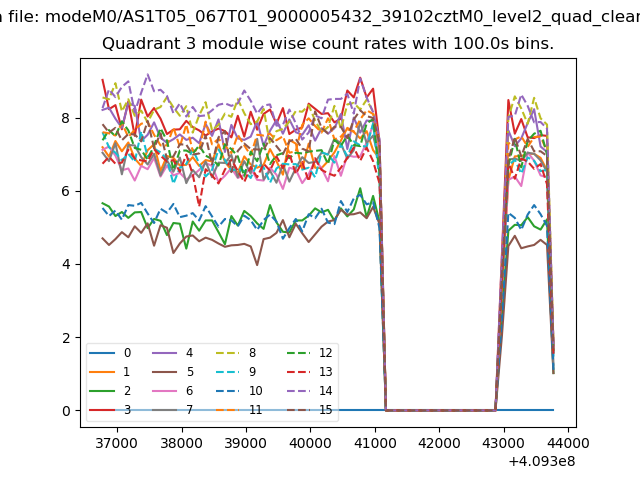
| Module-wise count rates for Quadrant C Data is divided into 100 sec bins |
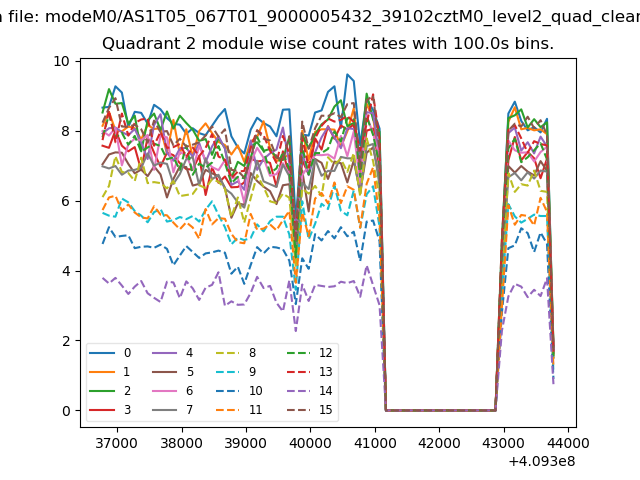 |
 |
| Module-wise count rates for Quadrant D Data is divided into 100 sec bins |
 |
 |
| Parameter | Plot |
|---|---|
| CZT HV Monitor |  |
| D_VDD | 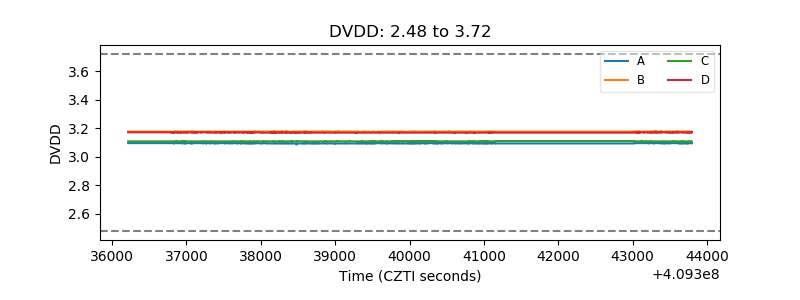 |
| Temperature 1 | 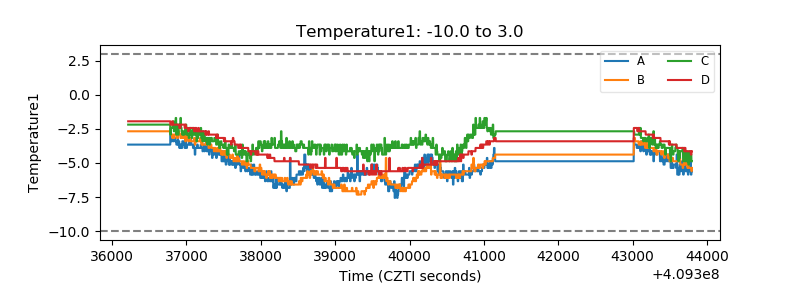 |
| Veto HV Monitor | 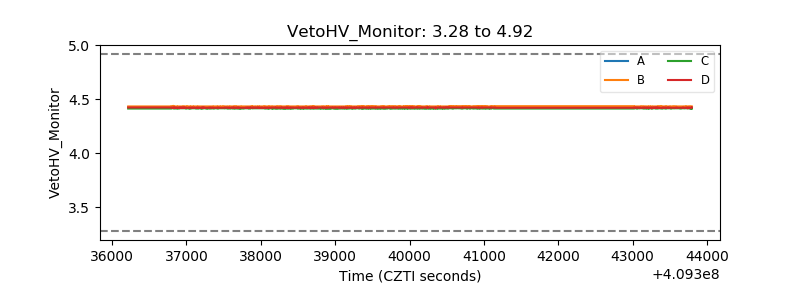 |
| Veto LLD | 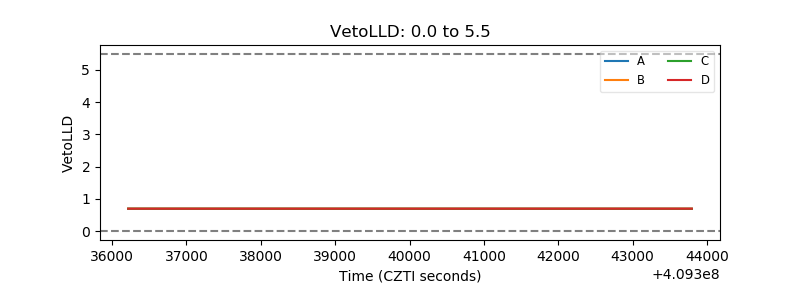 |
| Alpha Counter | 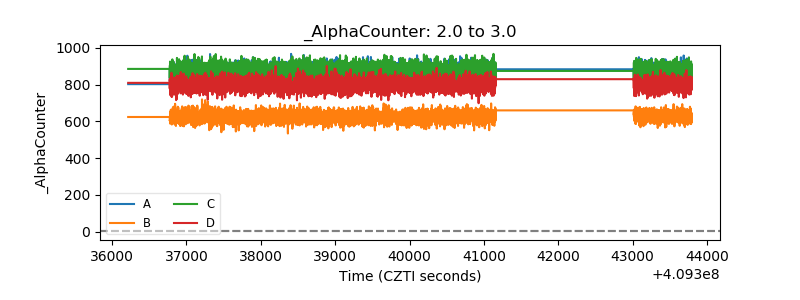 |
| _CPM_Rate | 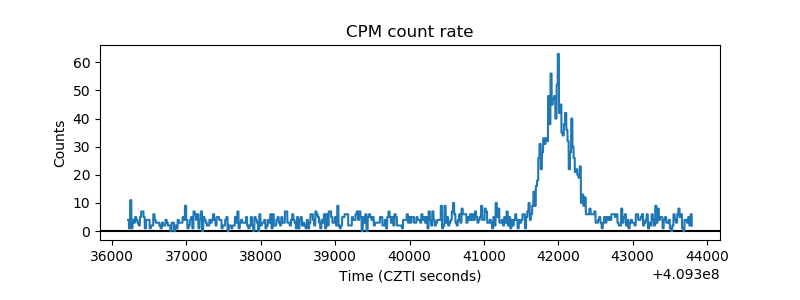 |
| CZT Counter | 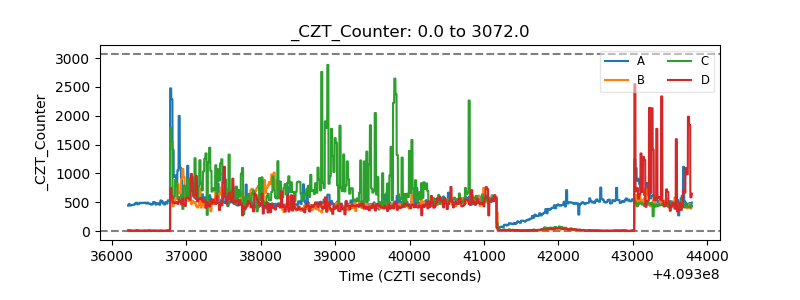 |
| +2.5 Volts monitor | 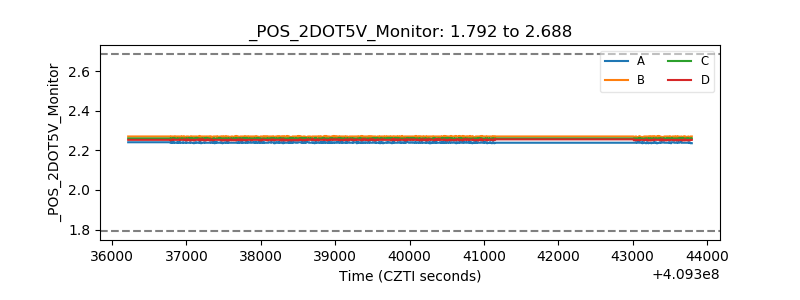 |
| +5 Volts monitor | 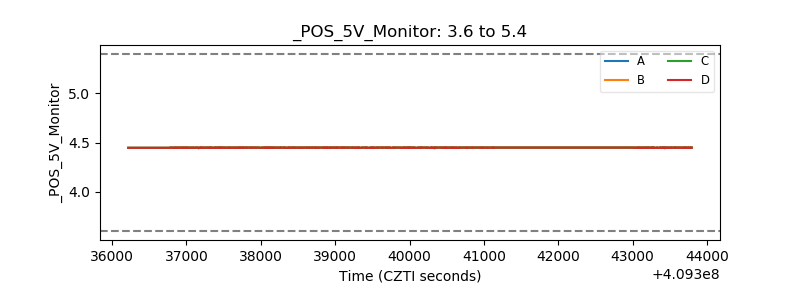 |
| _ROLL_ROT | 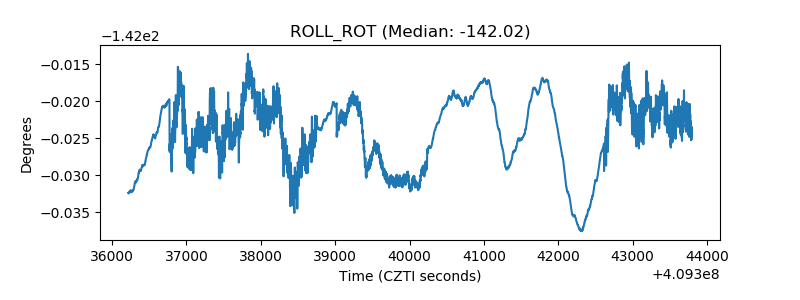 |
| _Roll_DEC | 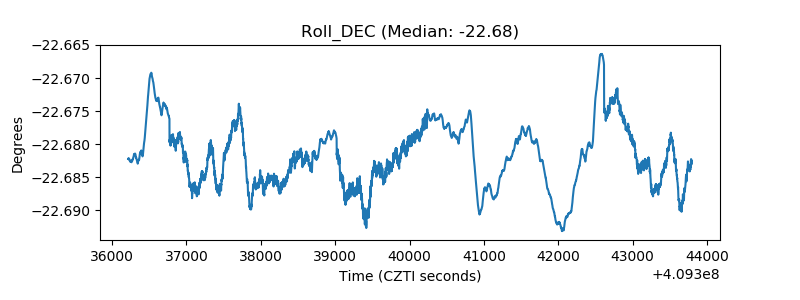 |
| _Roll_RA | 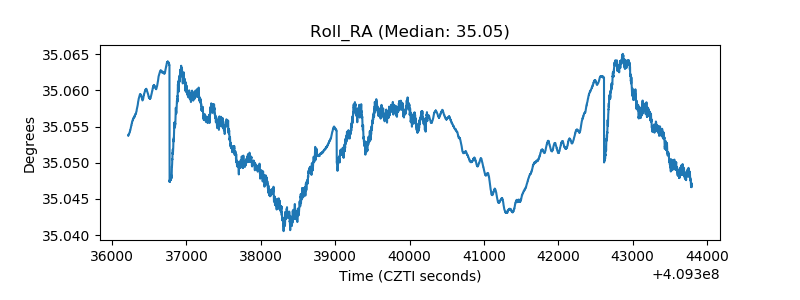 |
| Veto Counter | 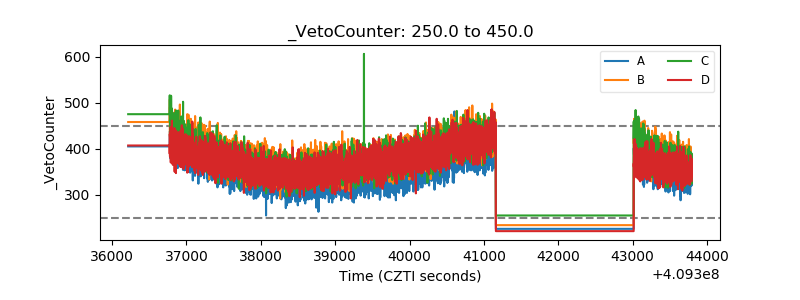 |