| Param | Original file | Final file |
|---|---|---|
| Filename | modeM0/AS1T05_067T01_9000005432_39103cztM0_level2.fits | modeM0/AS1T05_067T01_9000005432_39103cztM0_level2_quad_clean.evt |
| Size (bytes) | 354,968,640 | 94,777,920 |
| Size | 338.5 MB | 90.4 MB |
| Events in quadrant A | 3,555,520 | 635,361 |
| Events in quadrant B | 2,647,311 | 656,570 |
| Events in quadrant C | 3,191,816 | 612,863 |
| Events in quadrant D | 3,304,161 | 569,063 |
| Mode M0 | |||
|---|---|---|---|
| Quadrant | BADHDUFLAG | Total packets | Discarded packets |
| A | 0 | 14235 | 2 |
| B | 0 | 11672 | 1 |
| C | 0 | 13162 | 1 |
| D | 0 | 13783 | 1 |
| Mode SS | |||
|---|---|---|---|
| Quadrant | BADHDUFLAG | Total packets | Discarded packets |
| A | 0 | 114 | 0 |
| B | 0 | 114 | 0 |
| C | 0 | 114 | 0 |
| D | 0 | 114 | 0 |
| Mode M9 | |||
|---|---|---|---|
| Quadrant | BADHDUFLAG | Total packets | Discarded packets |
| A | 0 | 28 | 0 |
| B | 0 | 28 | 0 |
| C | 0 | 28 | 0 |
| D | 0 | 29 | 0 |
| Quadrant | Total seconds | Saturated seconds | Saturation percentage |
|---|---|---|---|
| A | 5667 | 65 | 1.146991% |
| B | 5667 | 15 | 0.264690% |
| C | 5667 | 70 | 1.235221% |
| D | 5667 | 72 | 1.270513% |
Noise dominated data is calculated using 1-second bins in cleaned event files. If a bin has >2000 counts, and if more than 50% of those come from <1% of pixels, then it is considered to be noise-dominated and hence unusable.
| Quadrant | # 1 sec bins | Bins with >0 counts | Bins with >2000 counts | High rate bins dominated by noise | Noise dominated (total time) | Noise dominated (detector-on time) | Marked lightcurve |
|---|---|---|---|---|---|---|---|
| A | 7160 | 5668 | 60 | 60 | 0.84% | 1.06% | 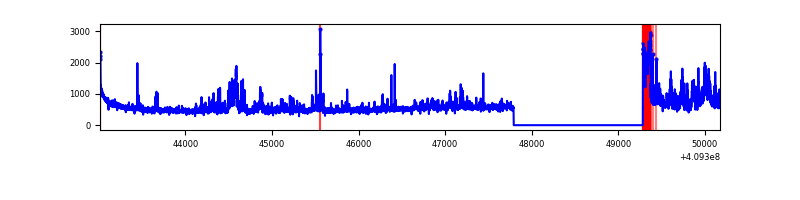 |
| B | 7160 | 5668 | 0 | 0 | 0.00% | 0.00% | 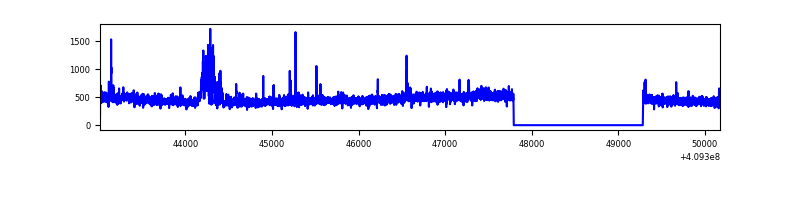 |
| C | 7160 | 5668 | 49 | 49 | 0.68% | 0.86% | 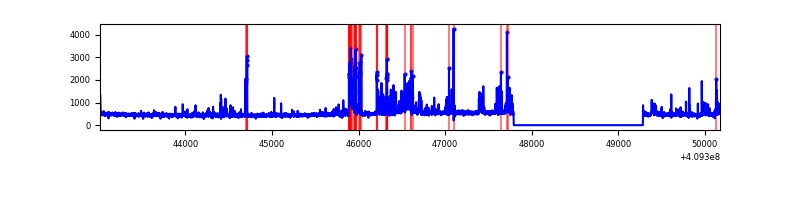 |
| D | 7160 | 5668 | 61 | 61 | 0.85% | 1.08% | 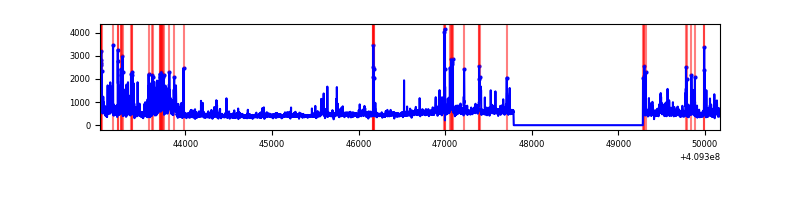 |
Top three noisy pixels from each quadrant. If the there are fewer than three noisy pixels in the level2.evt file, extra rows are filled as -1
| Pixel properties | Quadrant properties | ||||||
|---|---|---|---|---|---|---|---|
| Quadrant | DetID | PixID | Counts | Sigma | Mean | Median | Sigma |
| A | 10 | 83 | 427109 | 3322.57 | 629 | 618 | 128.4 |
| A | 12 | 16 | 401149 | 3120.33 | 629 | 618 | 128.4 |
| A | 15 | 223 | 174138 | 1351.81 | 629 | 618 | 128.4 |
| B | 5 | 184 | 83322 | 669.98 | 628 | 612 | 123.5 |
| B | 0 | 230 | 52416 | 419.63 | 628 | 612 | 123.5 |
| B | 5 | 172 | 20116 | 157.99 | 628 | 612 | 123.5 |
| C | 15 | 208 | 325446 | 2268.72 | 610 | 613 | 143.2 |
| C | 15 | 214 | 239841 | 1670.83 | 610 | 613 | 143.2 |
| C | 9 | 187 | 236309 | 1646.17 | 610 | 613 | 143.2 |
| D | 12 | 235 | 307732 | 2071.97 | 607 | 589 | 148.2 |
| D | 2 | 249 | 187221 | 1259.01 | 607 | 589 | 148.2 |
| D | 12 | 233 | 130547 | 876.69 | 607 | 589 | 148.2 |
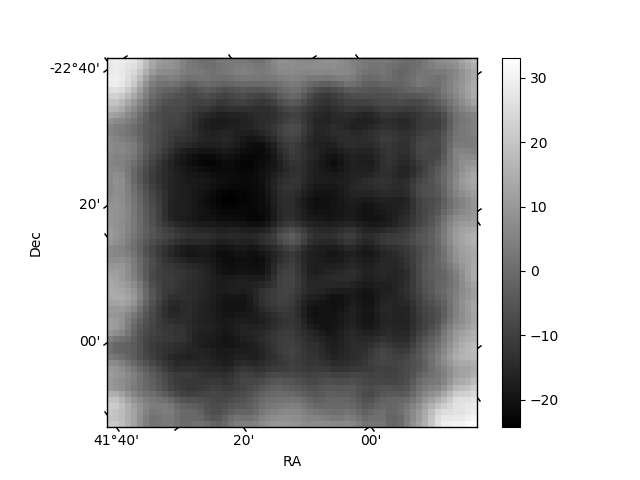
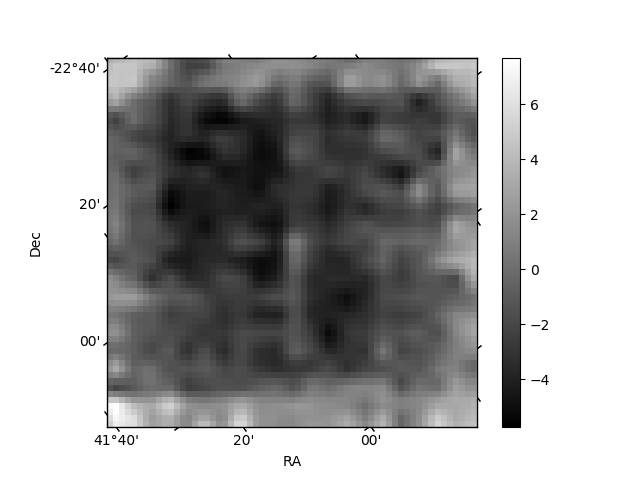
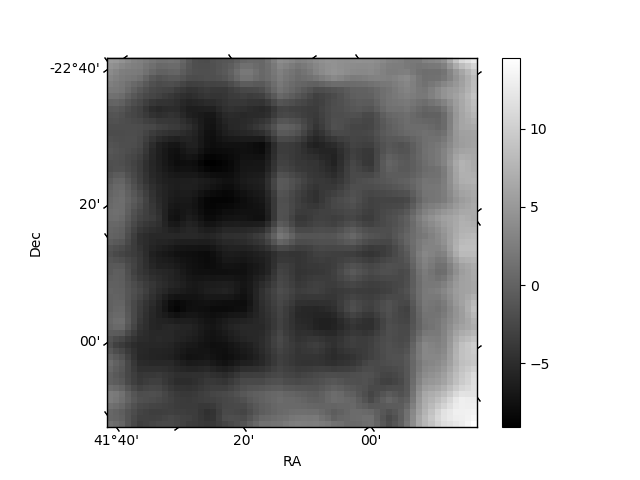
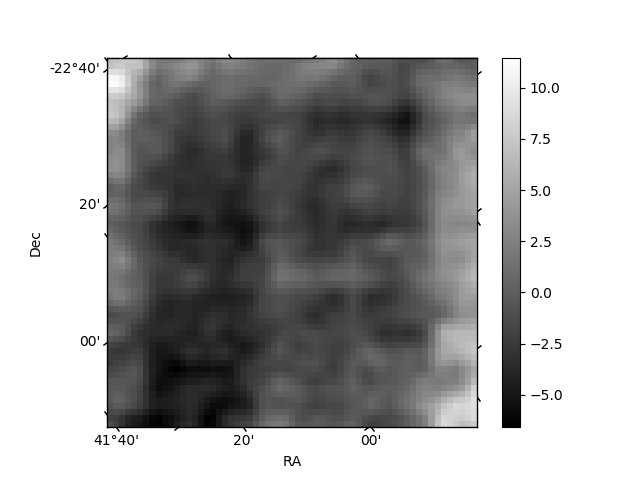
Histogram calculated using DETX and DETY for each event in the final _common_clean file
| Quadrant A | 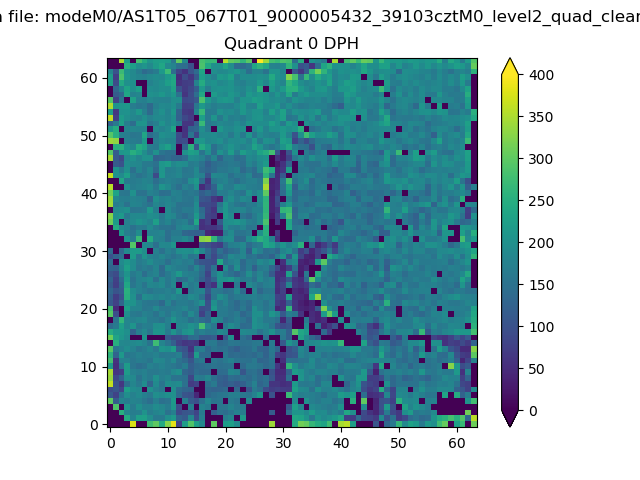 |
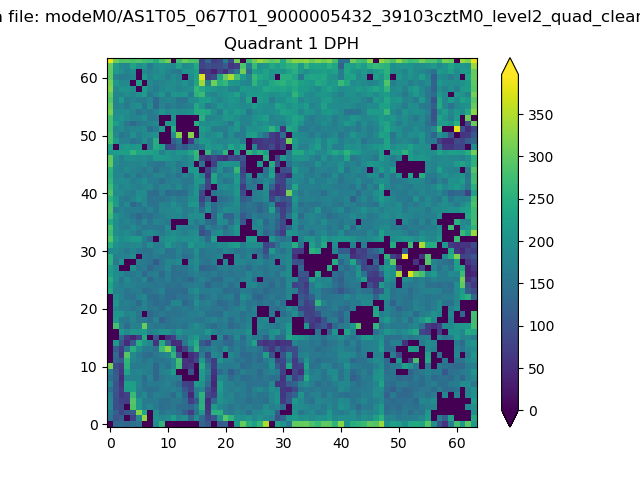 |
Quadrant B |
|---|---|---|---|
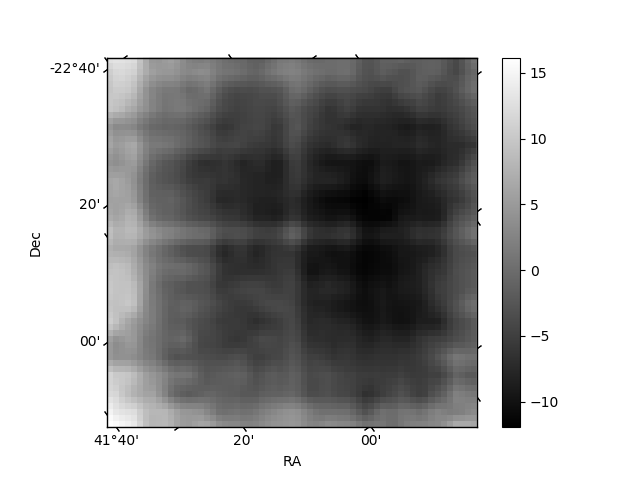
| Quadrant D | 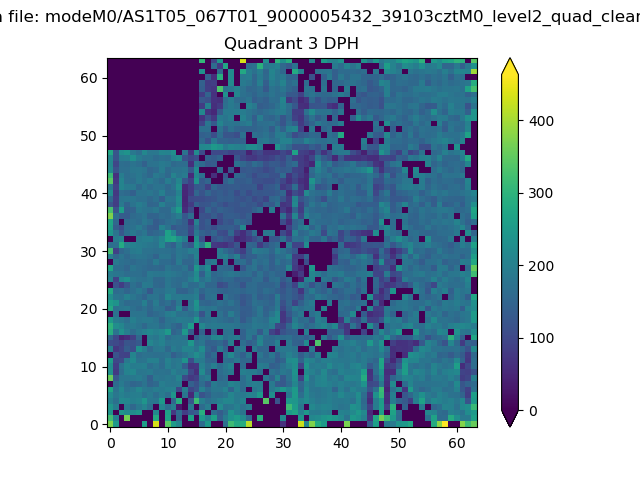 |
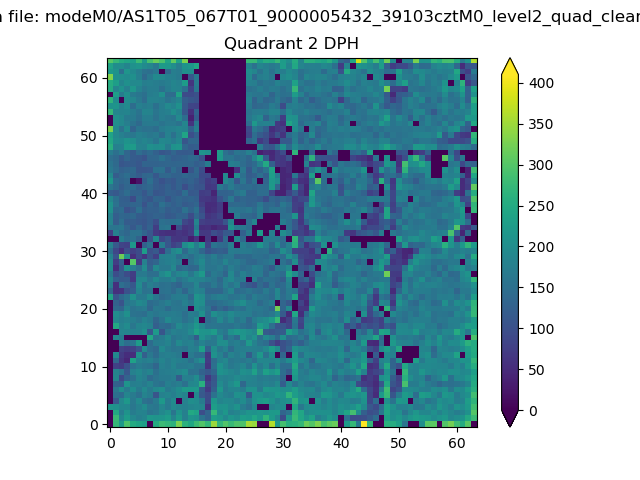 |
Quadrant C |
| Plot type | Count rate plots | Images |
|---|---|---|
| Comparison with Poisson distribution Blue bars denote a histogram of data divided into 1 sec bins. Red curve is a Poisson curve with rate = median count rate of data. |
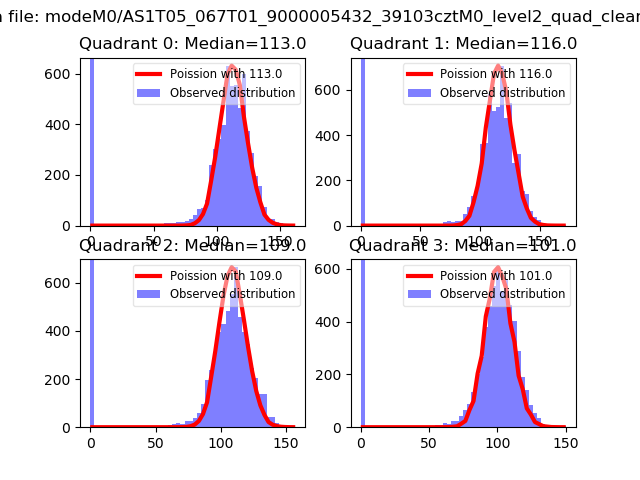 |
 |
| Quadrant-wise count rates Data is divided into 100 sec bins |
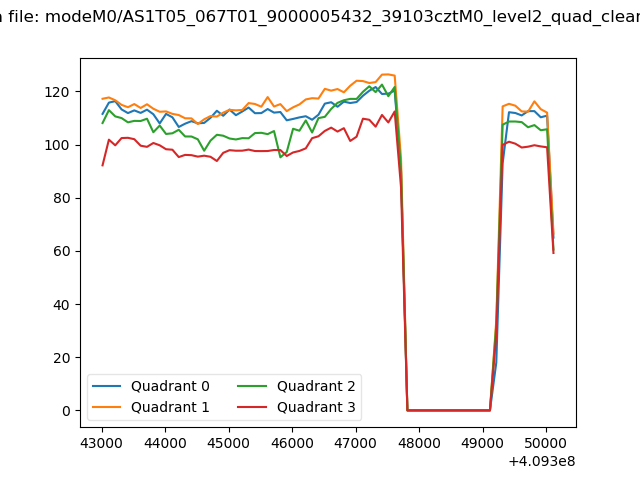 |
|
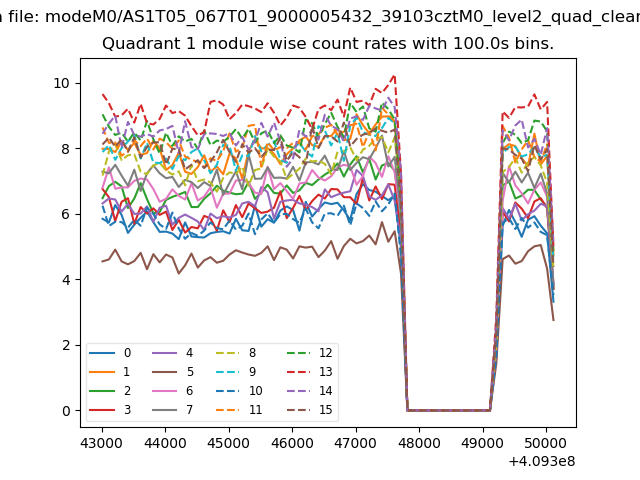
| Module-wise count rates for Quadrant A Data is divided into 100 sec bins |
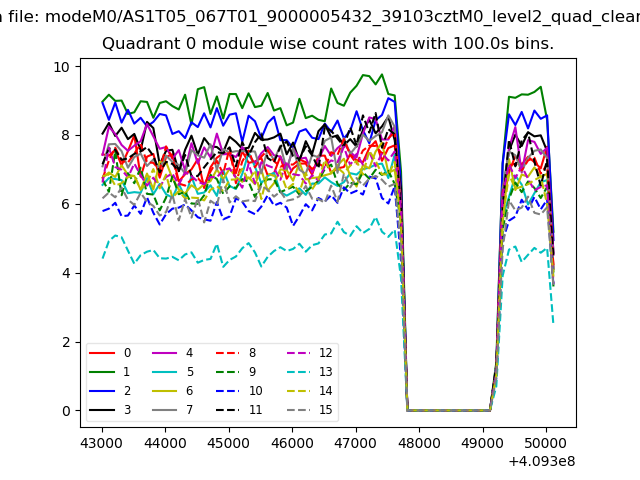 |
 |
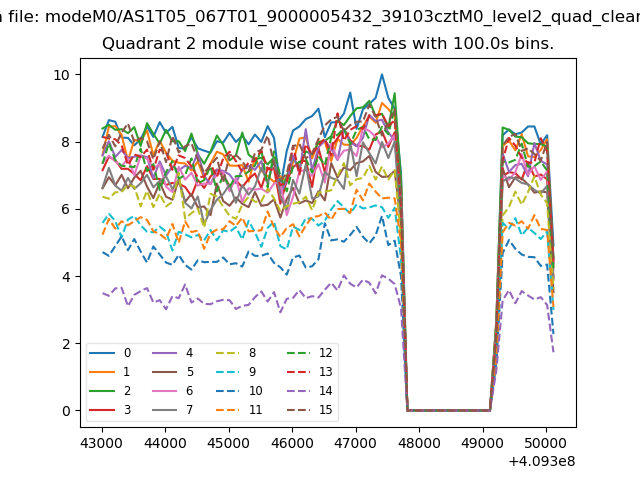
| Module-wise count rates for Quadrant B Data is divided into 100 sec bins |
 |
 |
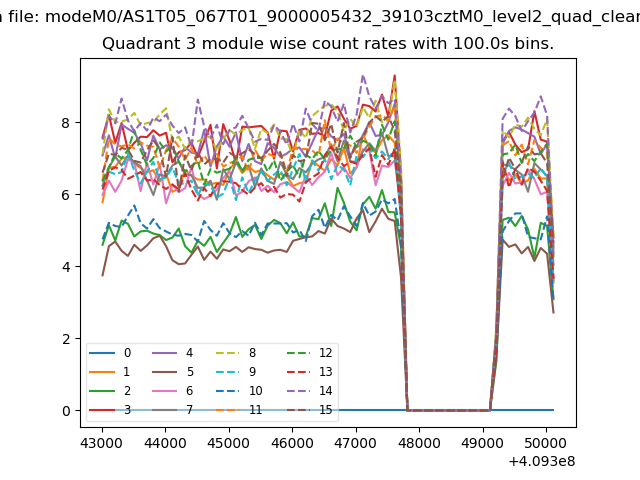
| Module-wise count rates for Quadrant C Data is divided into 100 sec bins |
 |
 |
| Module-wise count rates for Quadrant D Data is divided into 100 sec bins |
 |
 |
| Parameter | Plot |
|---|---|
| CZT HV Monitor | 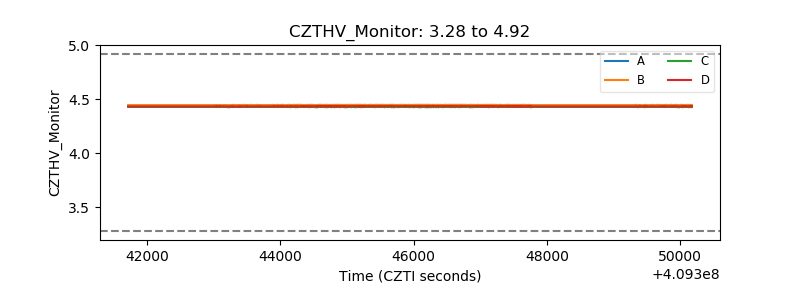 |
| D_VDD |  |
| Temperature 1 | 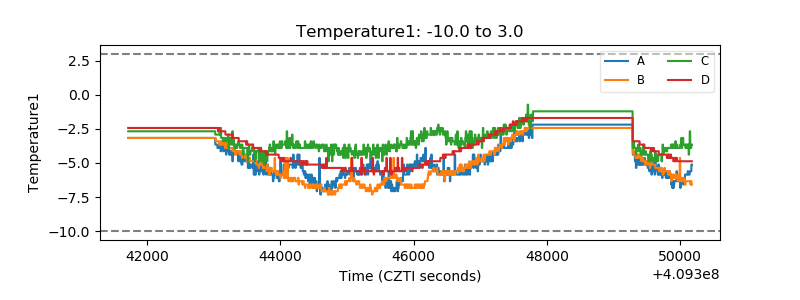 |
| Veto HV Monitor | 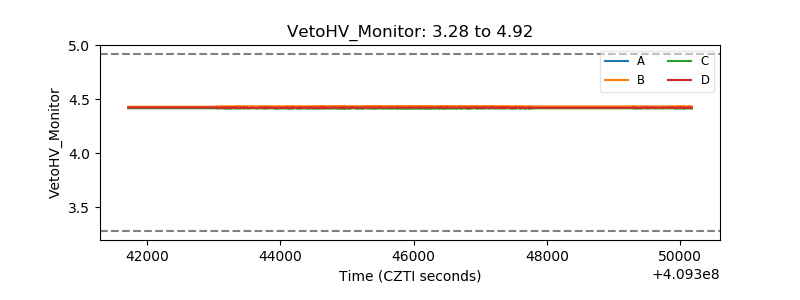 |
| Veto LLD | 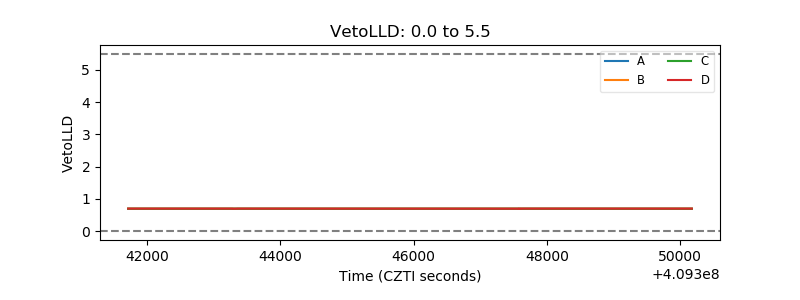 |
| Alpha Counter | 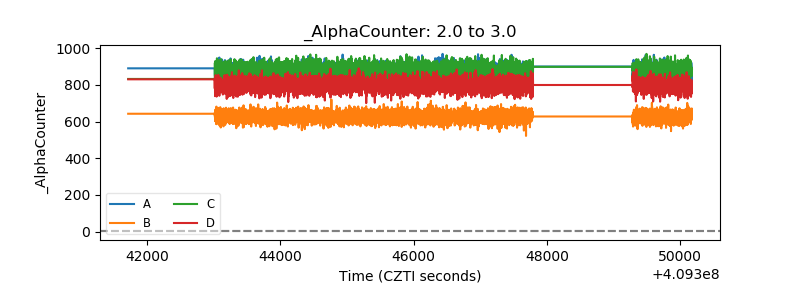 |
| _CPM_Rate | 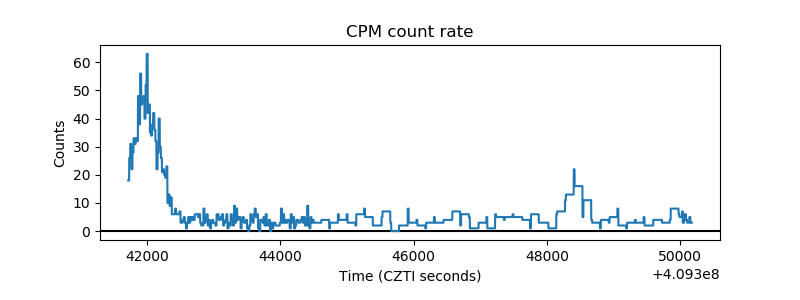 |
| CZT Counter | 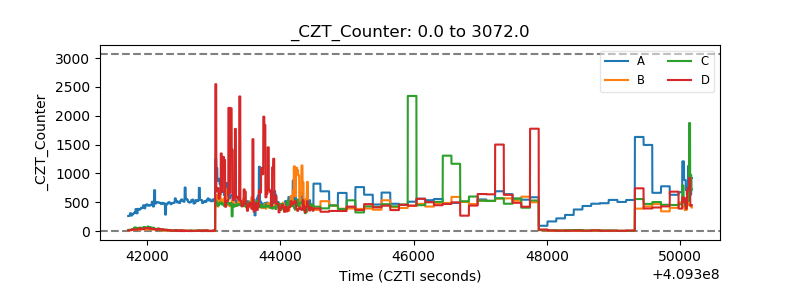 |
| +2.5 Volts monitor | 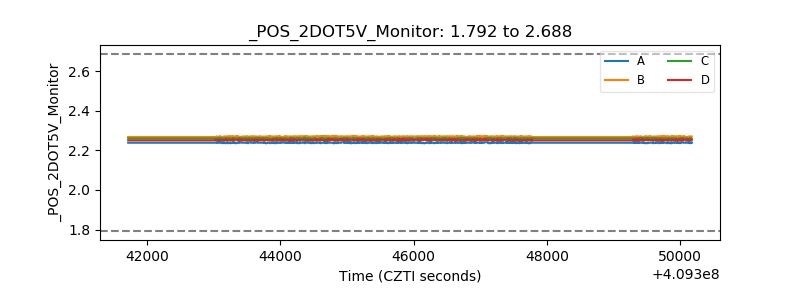 |
| +5 Volts monitor | 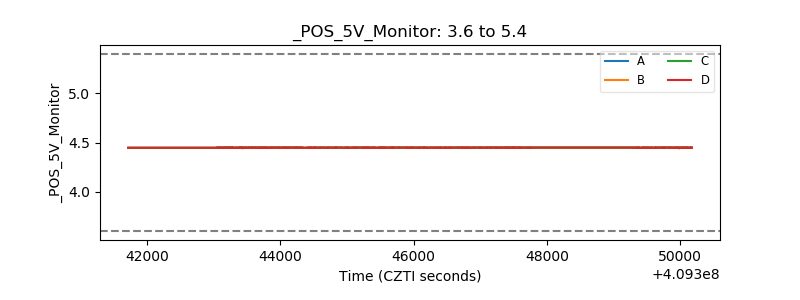 |
| _ROLL_ROT | 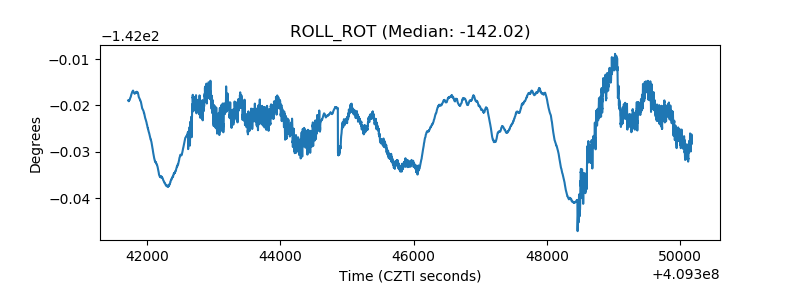 |
| _Roll_DEC | 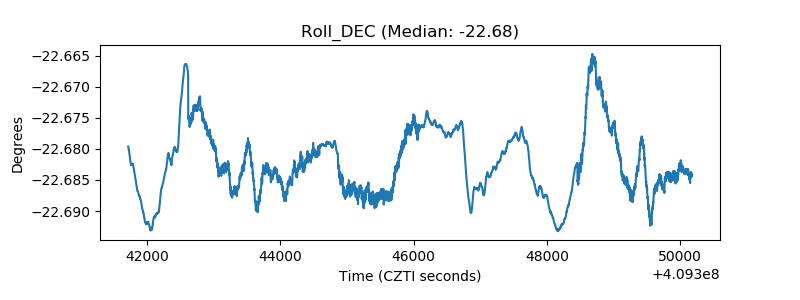 |
| _Roll_RA | 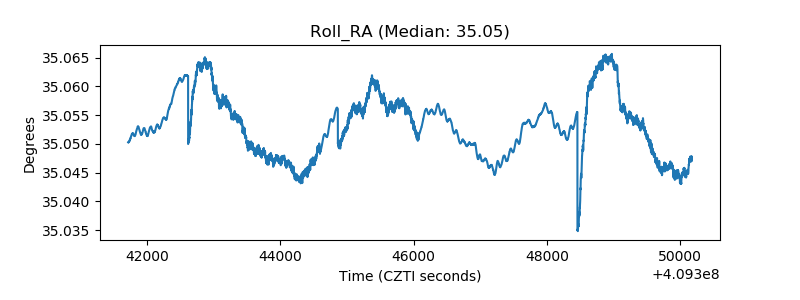 |
| Veto Counter | 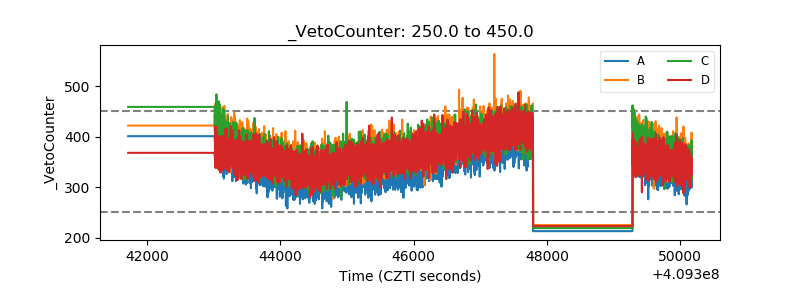 |