| Param | Original file | Final file |
|---|---|---|
| Filename | modeM0/AS1T05_067T01_9000005432_39104cztM0_level2.fits | modeM0/AS1T05_067T01_9000005432_39104cztM0_level2_quad_clean.evt |
| Size (bytes) | 383,137,920 | 96,773,760 |
| Size | 365.4 MB | 92.3 MB |
| Events in quadrant A | 4,270,434 | 647,944 |
| Events in quadrant B | 2,601,161 | 668,465 |
| Events in quadrant C | 3,475,410 | 625,263 |
| Events in quadrant D | 3,382,658 | 581,099 |
| Mode M0 | |||
|---|---|---|---|
| Quadrant | BADHDUFLAG | Total packets | Discarded packets |
| A | 0 | 16583 | 3 |
| B | 0 | 11736 | 2 |
| C | 0 | 13949 | 2 |
| D | 0 | 14041 | 2 |
| Mode SS | |||
|---|---|---|---|
| Quadrant | BADHDUFLAG | Total packets | Discarded packets |
| A | 0 | 120 | 0 |
| B | 0 | 120 | 0 |
| C | 0 | 120 | 0 |
| D | 0 | 120 | 0 |
| Mode M9 | |||
|---|---|---|---|
| Quadrant | BADHDUFLAG | Total packets | Discarded packets |
| A | 0 | 23 | 0 |
| B | 0 | 23 | 0 |
| C | 0 | 23 | 0 |
| D | 0 | 24 | 0 |
| Quadrant | Total seconds | Saturated seconds | Saturation percentage |
|---|---|---|---|
| A | 5826 | 79 | 1.355990% |
| B | 5826 | 6 | 0.102987% |
| C | 5826 | 37 | 0.635084% |
| D | 5826 | 66 | 1.132853% |
Noise dominated data is calculated using 1-second bins in cleaned event files. If a bin has >2000 counts, and if more than 50% of those come from <1% of pixels, then it is considered to be noise-dominated and hence unusable.
| Quadrant | # 1 sec bins | Bins with >0 counts | Bins with >2000 counts | High rate bins dominated by noise | Noise dominated (total time) | Noise dominated (detector-on time) | Marked lightcurve |
|---|---|---|---|---|---|---|---|
| A | 7138 | 5827 | 77 | 77 | 1.08% | 1.32% | 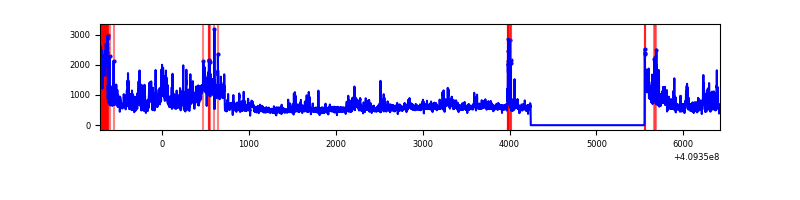 |
| B | 7138 | 5827 | 0 | 0 | 0.00% | 0.00% | 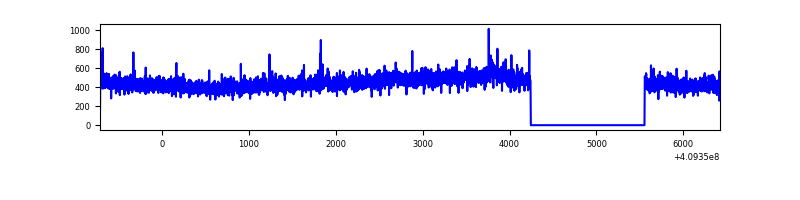 |
| C | 7138 | 5827 | 36 | 36 | 0.50% | 0.62% | 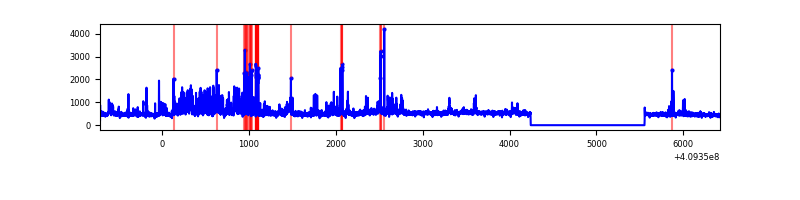 |
| D | 7138 | 5827 | 50 | 50 | 0.70% | 0.86% | 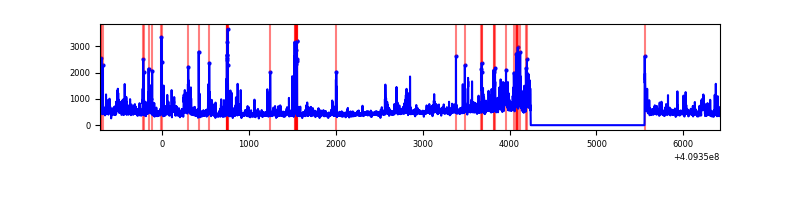 |
Top three noisy pixels from each quadrant. If the there are fewer than three noisy pixels in the level2.evt file, extra rows are filled as -1
| Pixel properties | Quadrant properties | ||||||
|---|---|---|---|---|---|---|---|
| Quadrant | DetID | PixID | Counts | Sigma | Mean | Median | Sigma |
| A | 15 | 223 | 655234 | 4919.75 | 647 | 634 | 133.1 |
| A | 12 | 16 | 454714 | 3412.71 | 647 | 634 | 133.1 |
| A | 10 | 83 | 424242 | 3183.69 | 647 | 634 | 133.1 |
| B | 0 | 199 | 25421 | 197.3 | 647 | 628 | 125.7 |
| B | 0 | 230 | 21172 | 163.48 | 647 | 628 | 125.7 |
| B | 12 | 111 | 16256 | 124.36 | 647 | 628 | 125.7 |
| C | 15 | 208 | 582180 | 3937.78 | 629 | 633 | 147.7 |
| C | 15 | 214 | 245330 | 1656.89 | 629 | 633 | 147.7 |
| C | 9 | 187 | 185477 | 1251.62 | 629 | 633 | 147.7 |
| D | 12 | 235 | 491263 | 3200.89 | 628 | 610 | 153.3 |
| D | 12 | 233 | 197789 | 1286.34 | 628 | 610 | 153.3 |
| D | 5 | 222 | 88916 | 576.08 | 628 | 610 | 153.3 |
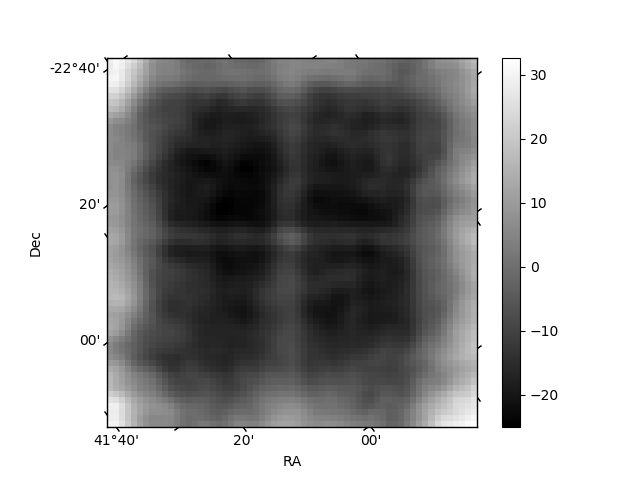
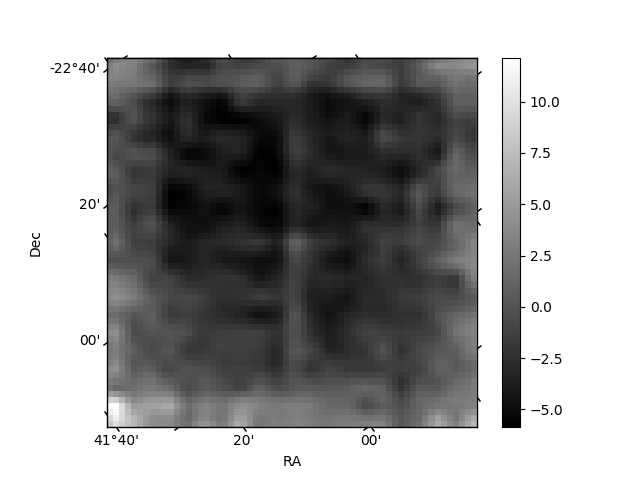
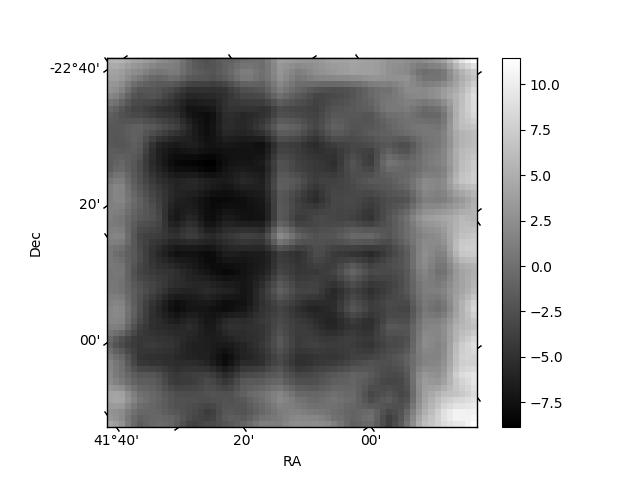
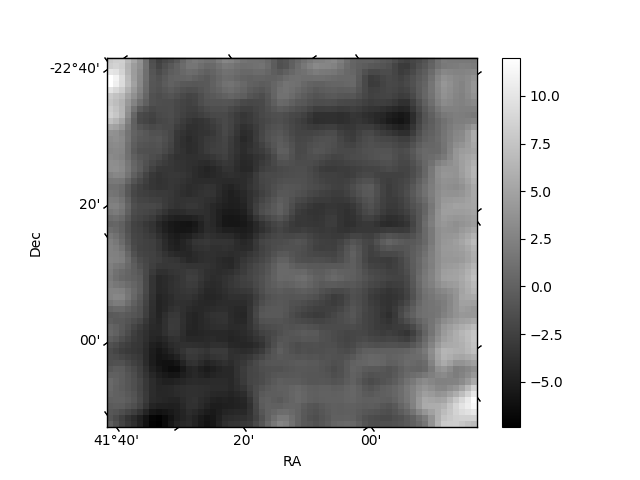
Histogram calculated using DETX and DETY for each event in the final _common_clean file
| Quadrant A | 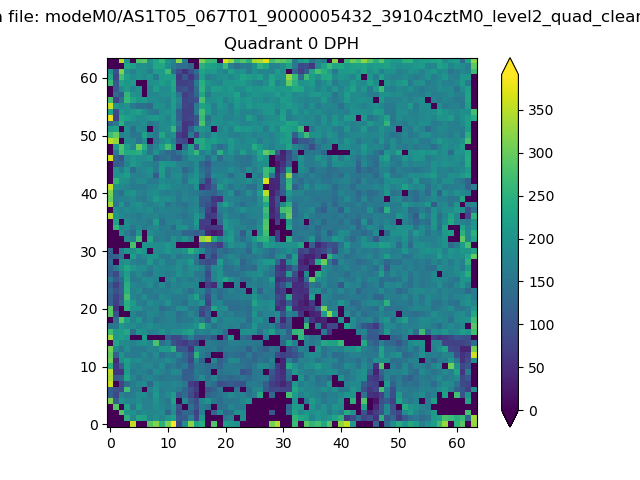 |
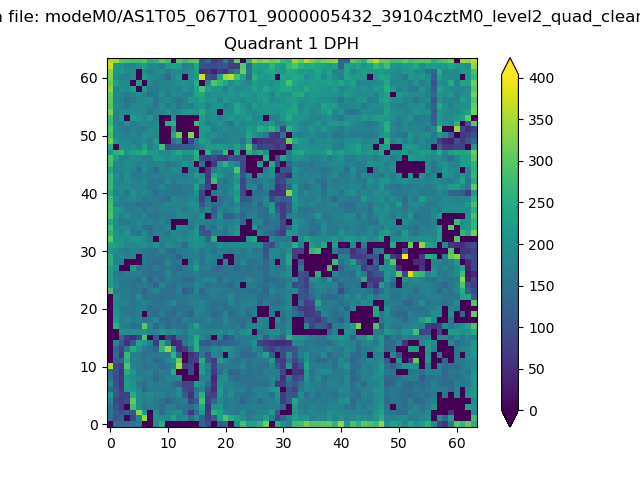 |
Quadrant B |
|---|---|---|---|
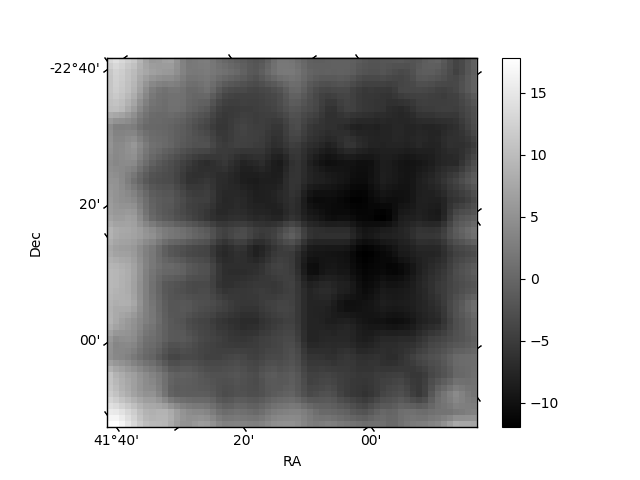
| Quadrant D | 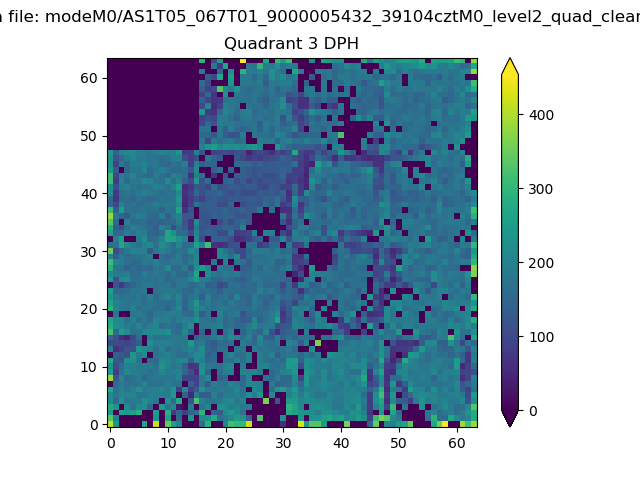 |
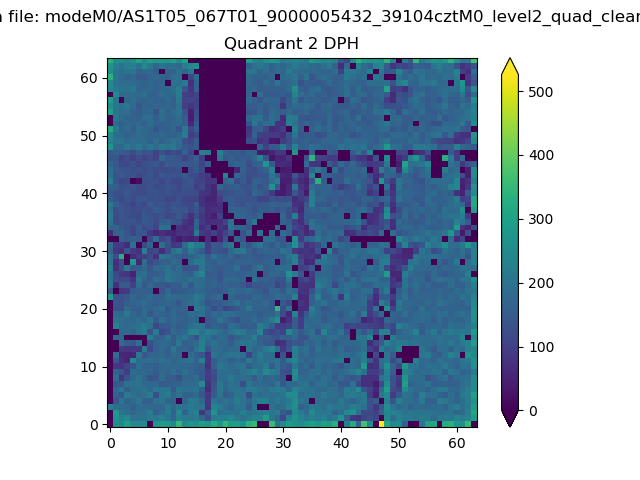 |
Quadrant C |
| Plot type | Count rate plots | Images |
|---|---|---|
| Comparison with Poisson distribution Blue bars denote a histogram of data divided into 1 sec bins. Red curve is a Poisson curve with rate = median count rate of data. |
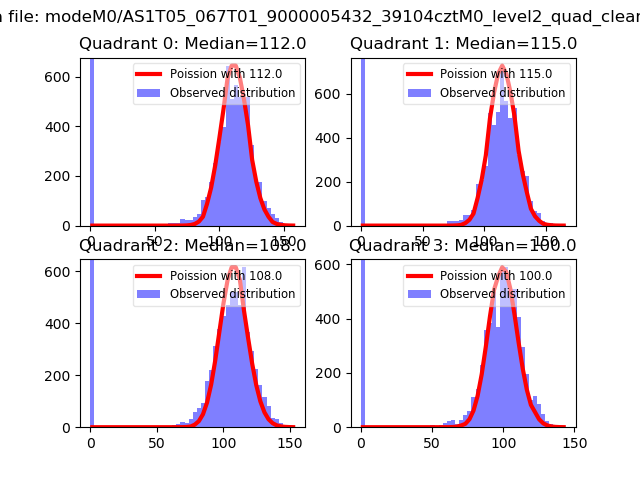 |
 |
| Quadrant-wise count rates Data is divided into 100 sec bins |
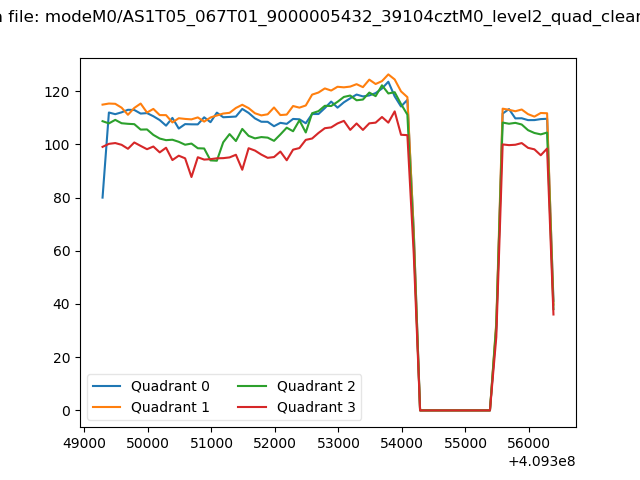 |
|
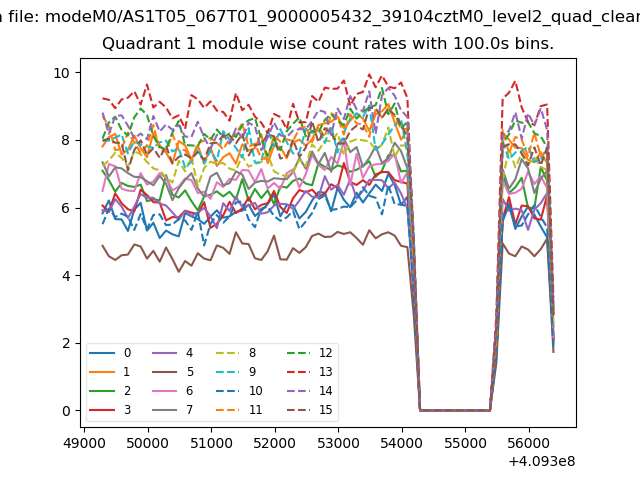
| Module-wise count rates for Quadrant A Data is divided into 100 sec bins |
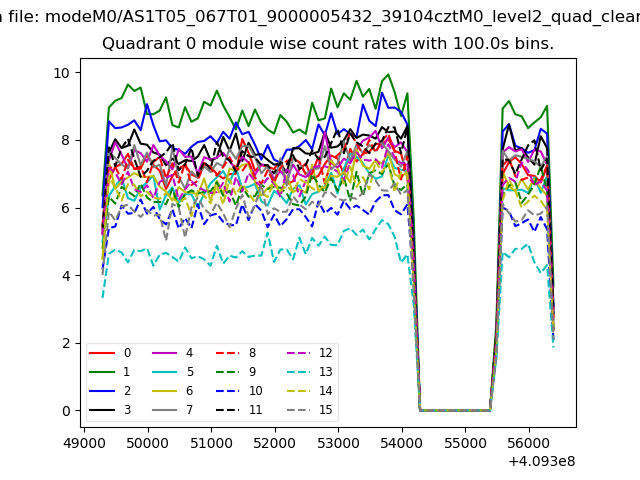 |
 |
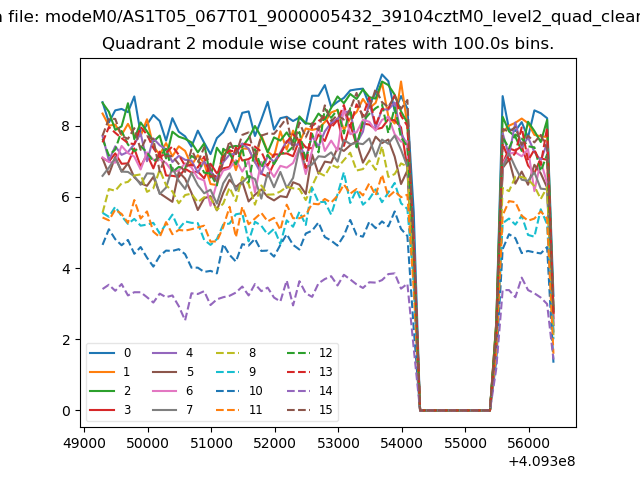
| Module-wise count rates for Quadrant B Data is divided into 100 sec bins |
 |
 |
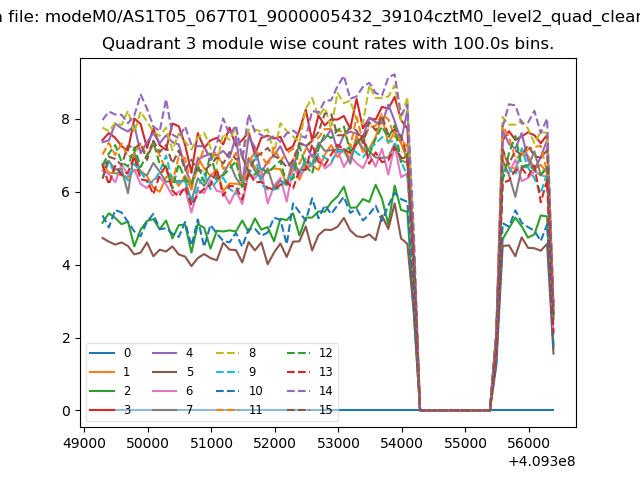
| Module-wise count rates for Quadrant C Data is divided into 100 sec bins |
 |
 |
| Module-wise count rates for Quadrant D Data is divided into 100 sec bins |
 |
 |
| Parameter | Plot |
|---|---|
| CZT HV Monitor | 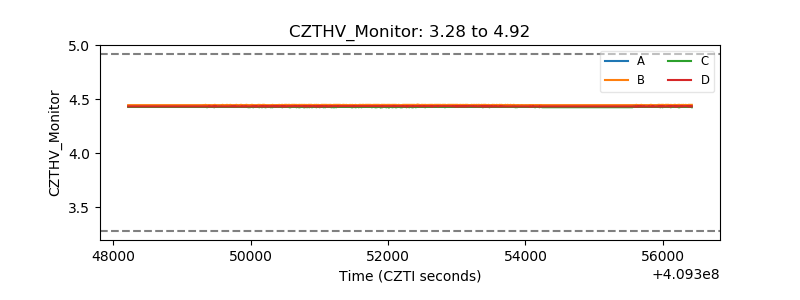 |
| D_VDD | 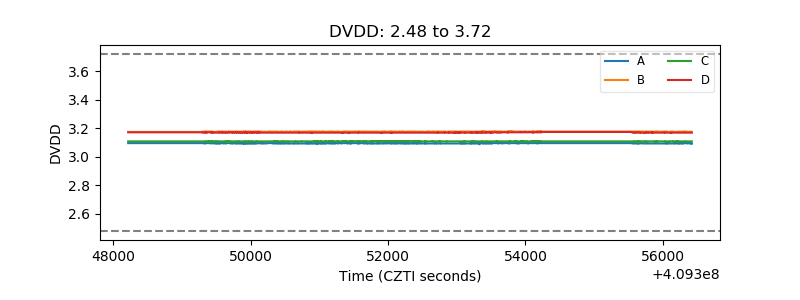 |
| Temperature 1 | 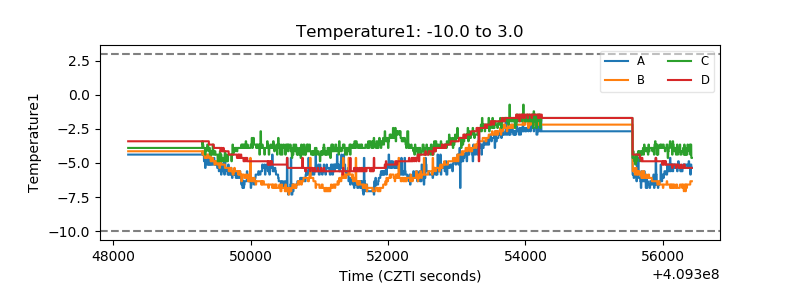 |
| Veto HV Monitor | 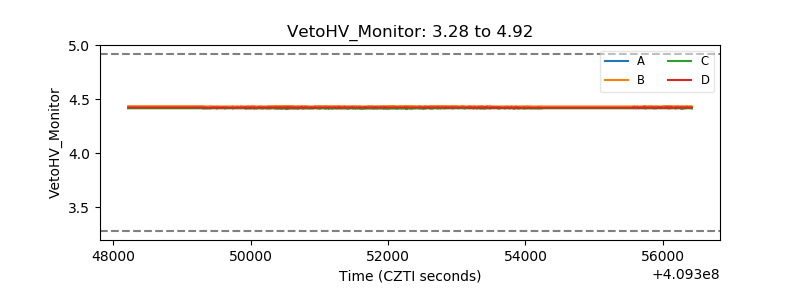 |
| Veto LLD | 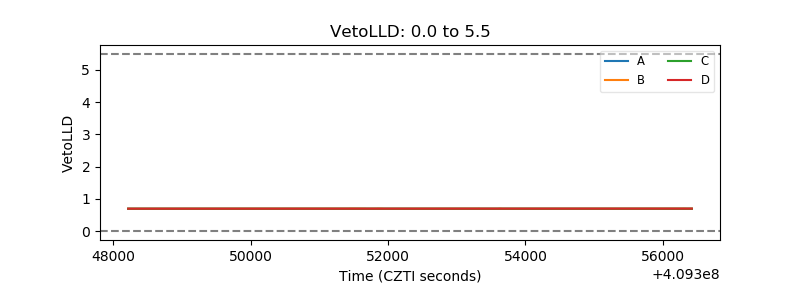 |
| Alpha Counter | 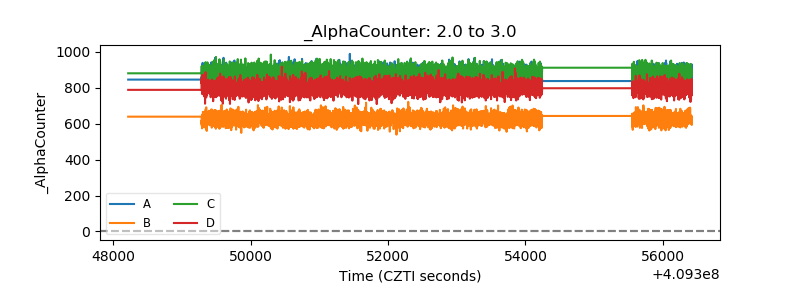 |
| _CPM_Rate |  |
| CZT Counter | 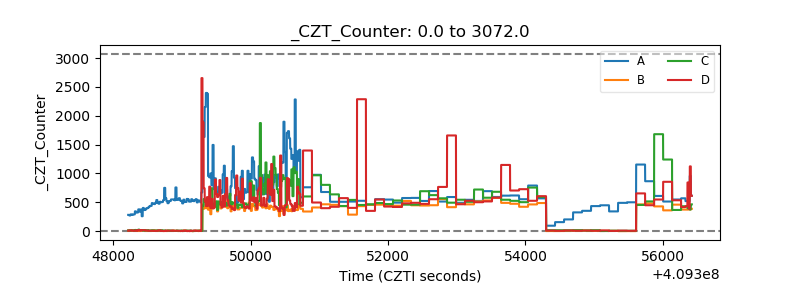 |
| +2.5 Volts monitor | 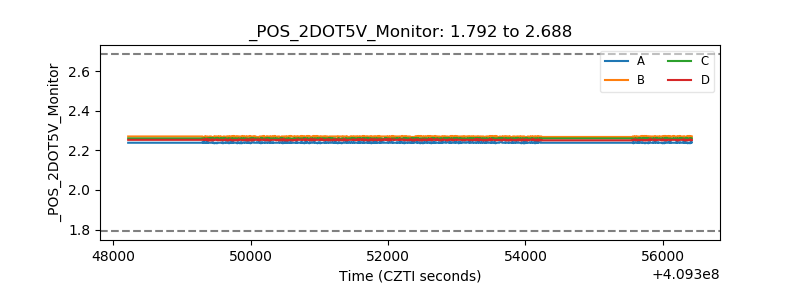 |
| +5 Volts monitor | 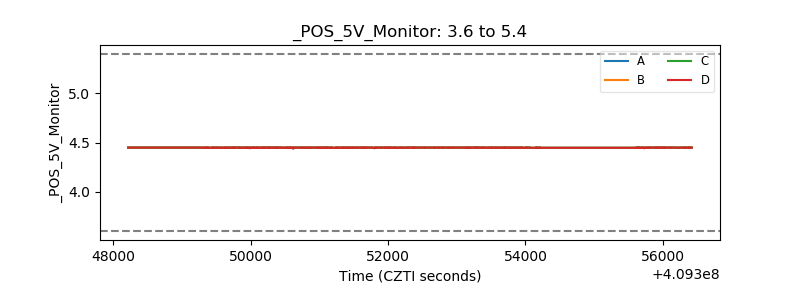 |
| _ROLL_ROT | 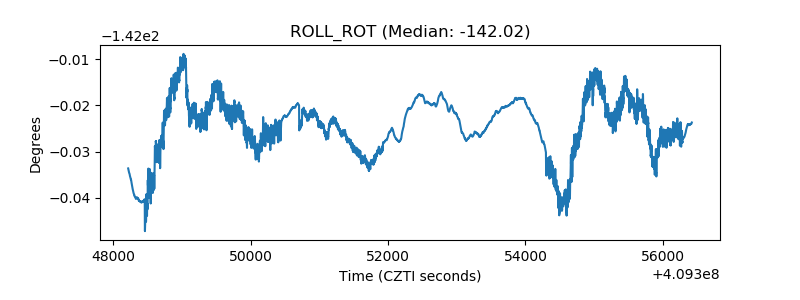 |
| _Roll_DEC | 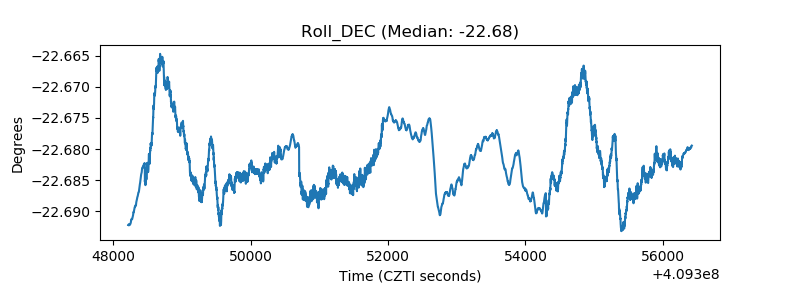 |
| _Roll_RA |  |
| Veto Counter | 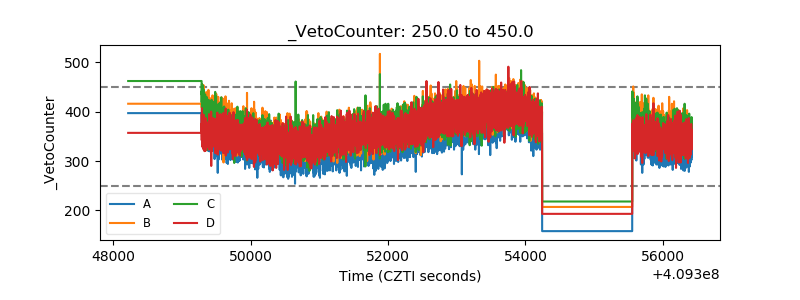 |