| Param | Original file | Final file |
|---|---|---|
| Filename | modeM0/AS1T05_067T01_9000005432_39108cztM0_level2.fits | modeM0/AS1T05_067T01_9000005432_39108cztM0_level2_quad_clean.evt |
| Size (bytes) | 375,016,320 | 93,208,320 |
| Size | 357.6 MB | 88.9 MB |
| Events in quadrant A | 3,739,639 | 625,713 |
| Events in quadrant B | 2,614,131 | 644,345 |
| Events in quadrant C | 3,334,311 | 602,700 |
| Events in quadrant D | 3,755,745 | 555,757 |
| Mode M0 | |||
|---|---|---|---|
| Quadrant | BADHDUFLAG | Total packets | Discarded packets |
| A | 0 | 14956 | 3 |
| B | 0 | 11567 | 2 |
| C | 0 | 13330 | 2 |
| D | 0 | 14773 | 2 |
| Mode SS | |||
|---|---|---|---|
| Quadrant | BADHDUFLAG | Total packets | Discarded packets |
| A | 0 | 114 | 0 |
| B | 0 | 114 | 0 |
| C | 0 | 114 | 0 |
| D | 0 | 114 | 0 |
| Mode M9 | |||
|---|---|---|---|
| Quadrant | BADHDUFLAG | Total packets | Discarded packets |
| A | 0 | 23 | 0 |
| B | 0 | 23 | 0 |
| C | 0 | 23 | 0 |
| D | 0 | 24 | 0 |
| Quadrant | Total seconds | Saturated seconds | Saturation percentage |
|---|---|---|---|
| A | 5632 | 34 | 0.603693% |
| B | 5632 | 43 | 0.763494% |
| C | 5632 | 85 | 1.509233% |
| D | 5632 | 132 | 2.343750% |
Noise dominated data is calculated using 1-second bins in cleaned event files. If a bin has >2000 counts, and if more than 50% of those come from <1% of pixels, then it is considered to be noise-dominated and hence unusable.
| Quadrant | # 1 sec bins | Bins with >0 counts | Bins with >2000 counts | High rate bins dominated by noise | Noise dominated (total time) | Noise dominated (detector-on time) | Marked lightcurve |
|---|---|---|---|---|---|---|---|
| A | 7215 | 5633 | 8 | 8 | 0.11% | 0.14% | 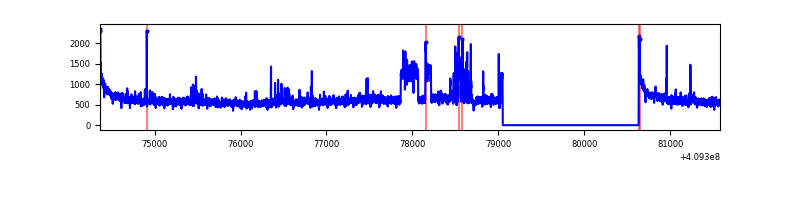 |
| B | 7215 | 5633 | 21 | 21 | 0.29% | 0.37% | 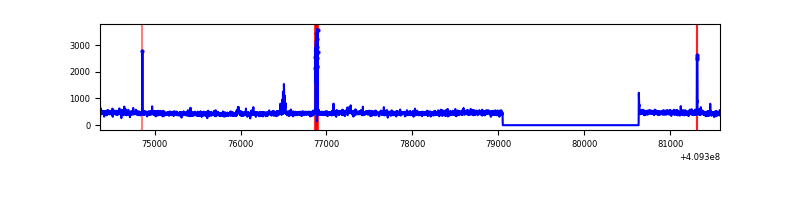 |
| C | 7215 | 5633 | 67 | 67 | 0.93% | 1.19% | 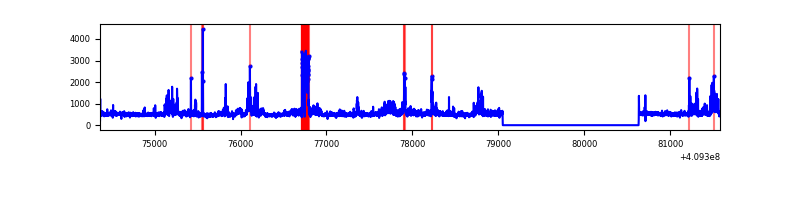 |
| D | 7215 | 5633 | 100 | 100 | 1.39% | 1.78% | 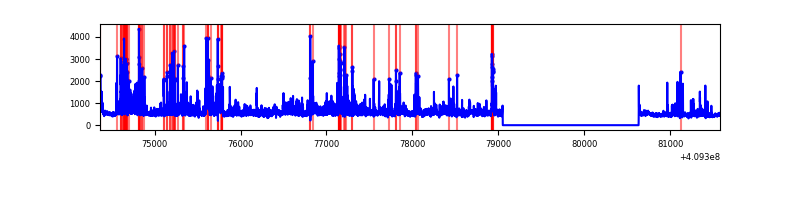 |
Top three noisy pixels from each quadrant. If the there are fewer than three noisy pixels in the level2.evt file, extra rows are filled as -1
| Pixel properties | Quadrant properties | ||||||
|---|---|---|---|---|---|---|---|
| Quadrant | DetID | PixID | Counts | Sigma | Mean | Median | Sigma |
| A | 15 | 223 | 756205 | 5897.79 | 629 | 617 | 128.1 |
| A | 10 | 83 | 426465 | 3323.98 | 629 | 617 | 128.1 |
| A | 7 | 3 | 68928 | 533.21 | 629 | 617 | 128.1 |
| B | 5 | 172 | 103917 | 847.45 | 628 | 610 | 121.9 |
| B | 0 | 230 | 27457 | 220.23 | 628 | 610 | 121.9 |
| B | 12 | 111 | 15750 | 124.2 | 628 | 610 | 121.9 |
| C | 15 | 208 | 380347 | 2640.55 | 613 | 616 | 143.8 |
| C | 9 | 187 | 309202 | 2145.82 | 613 | 616 | 143.8 |
| C | 15 | 214 | 240007 | 1664.66 | 613 | 616 | 143.8 |
| D | 12 | 235 | 421459 | 2804.3 | 609 | 591 | 150.1 |
| D | 2 | 249 | 285439 | 1897.98 | 609 | 591 | 150.1 |
| D | 7 | 223 | 179357 | 1191.14 | 609 | 591 | 150.1 |
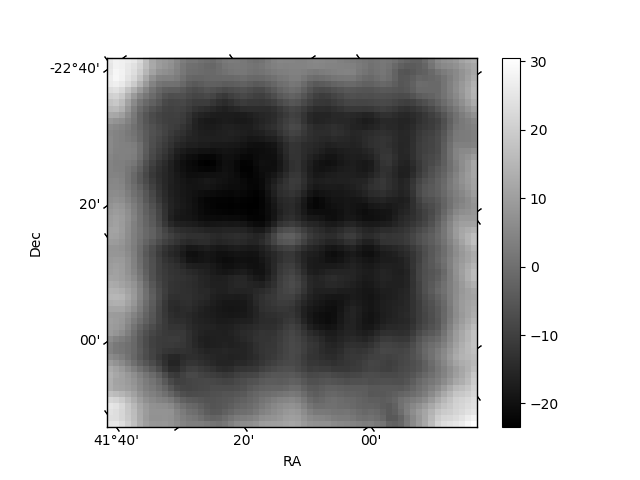
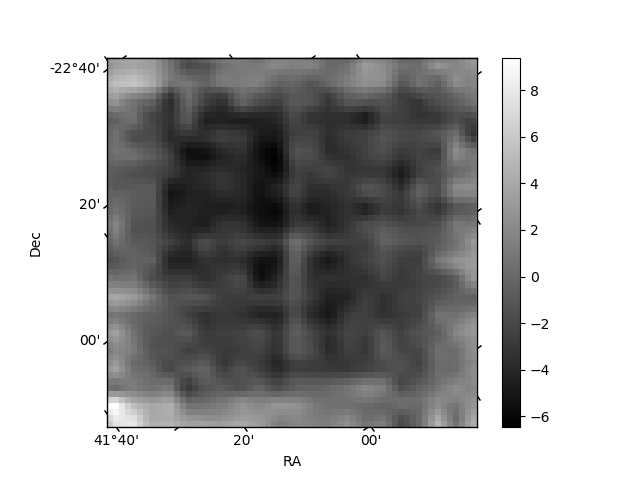
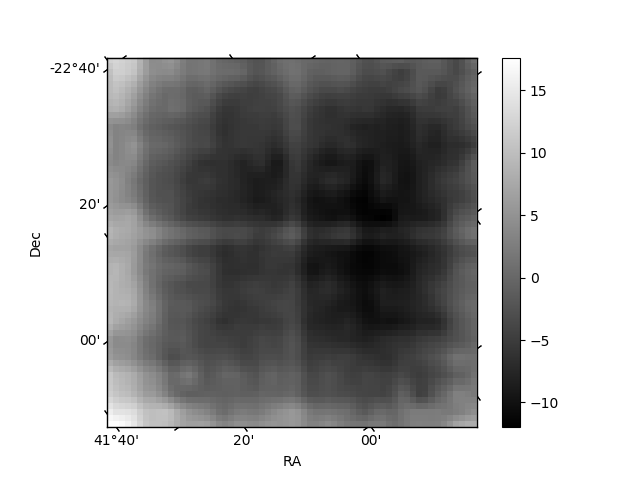
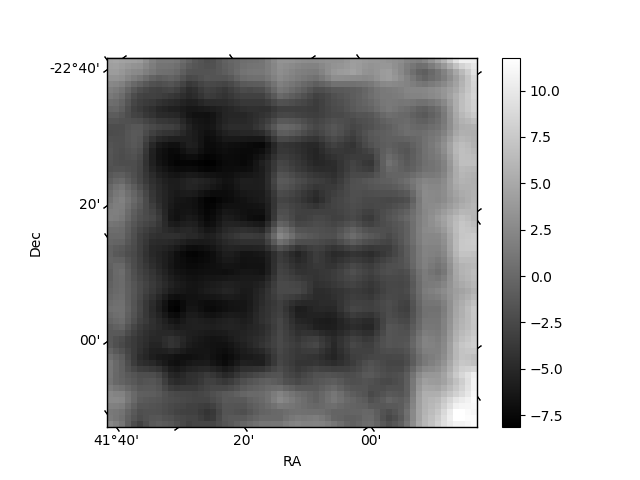
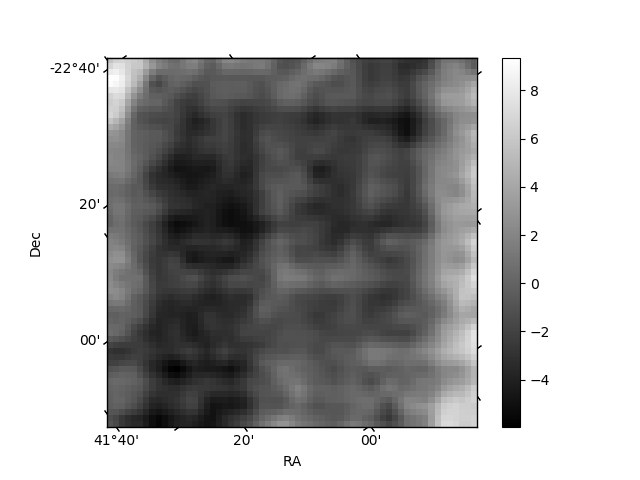
Histogram calculated using DETX and DETY for each event in the final _common_clean file
| Quadrant A | 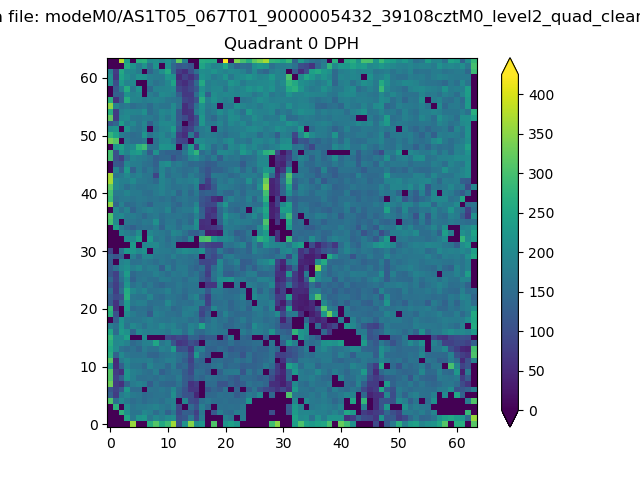 |
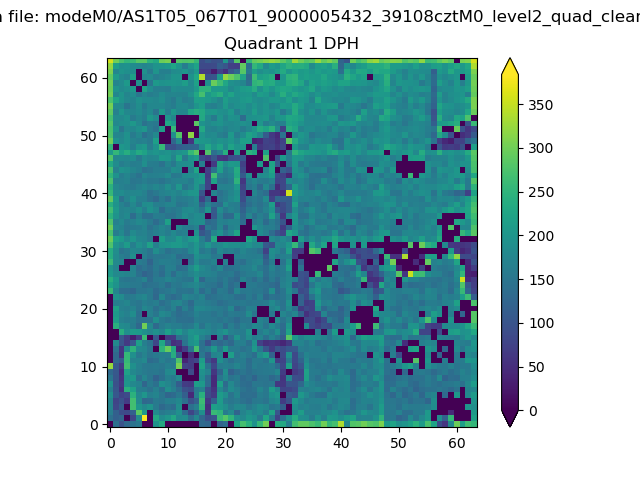 |
Quadrant B |
|---|---|---|---|
| Quadrant D | 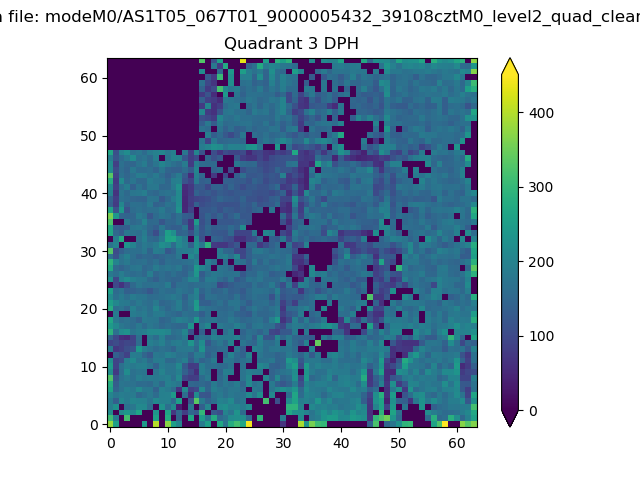 |
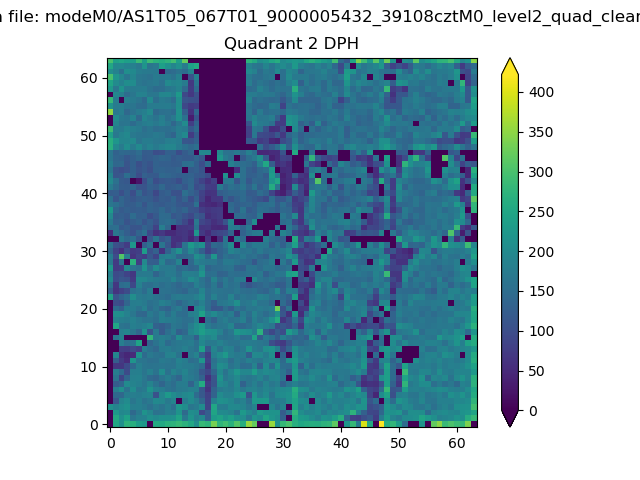 |
Quadrant C |
| Plot type | Count rate plots | Images |
|---|---|---|
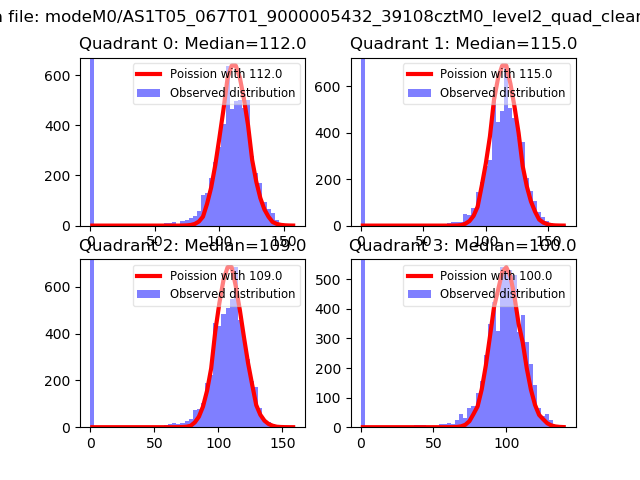
| Comparison with Poisson distribution Blue bars denote a histogram of data divided into 1 sec bins. Red curve is a Poisson curve with rate = median count rate of data. |
 |
 |
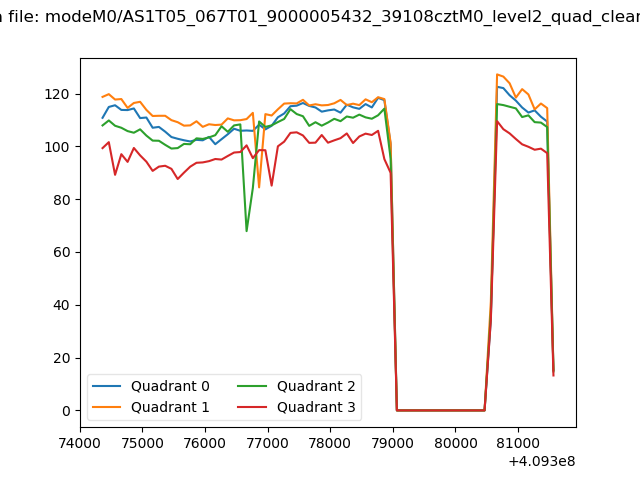
| Quadrant-wise count rates Data is divided into 100 sec bins |
 |
|
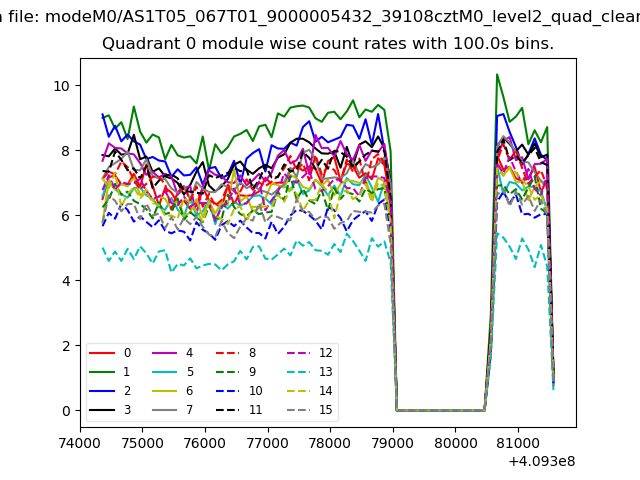
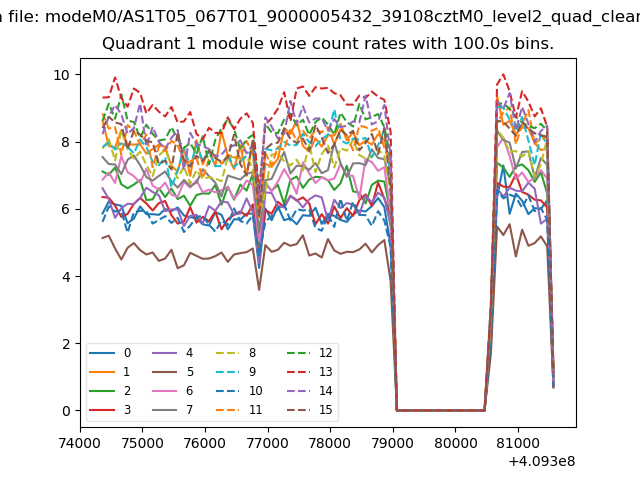
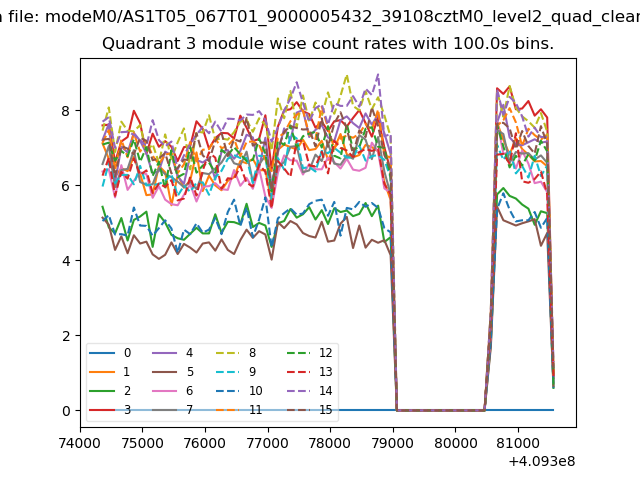
| Module-wise count rates for Quadrant A Data is divided into 100 sec bins |
 |
 |
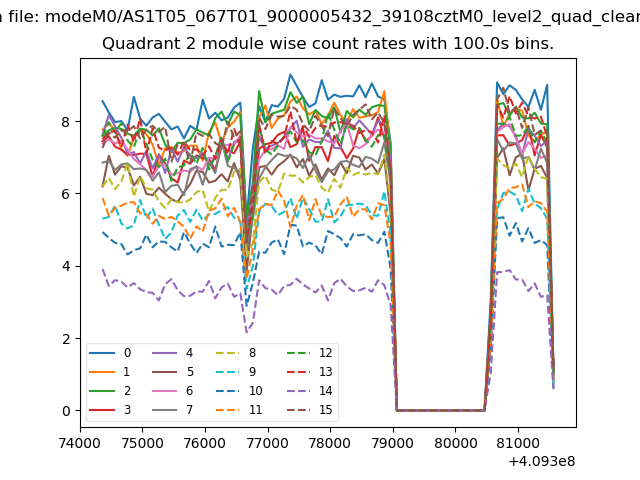
| Module-wise count rates for Quadrant B Data is divided into 100 sec bins |
 |
 |
| Module-wise count rates for Quadrant C Data is divided into 100 sec bins |
 |
 |
| Module-wise count rates for Quadrant D Data is divided into 100 sec bins |
 |
 |
| Parameter | Plot |
|---|---|
| CZT HV Monitor | 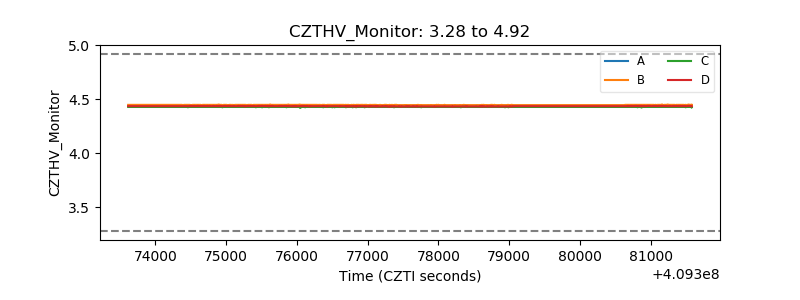 |
| D_VDD | 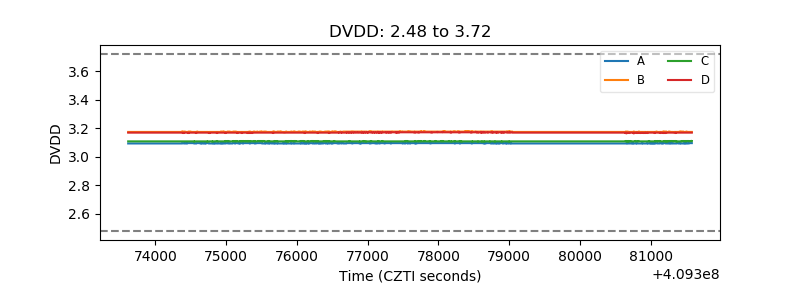 |
| Temperature 1 | 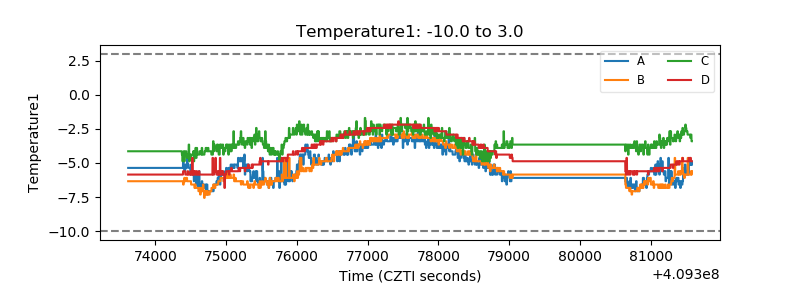 |
| Veto HV Monitor | 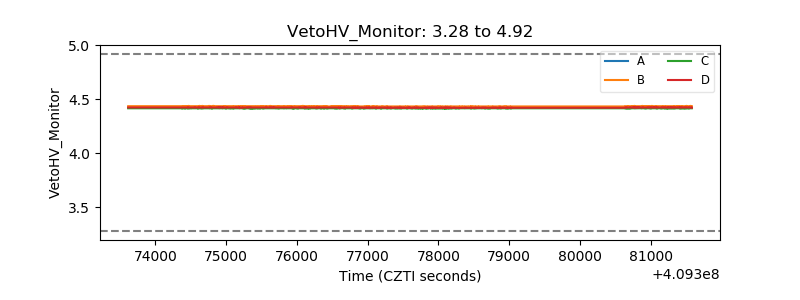 |
| Veto LLD | 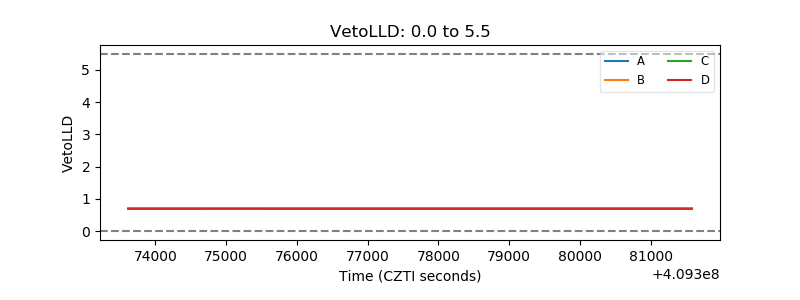 |
| Alpha Counter | 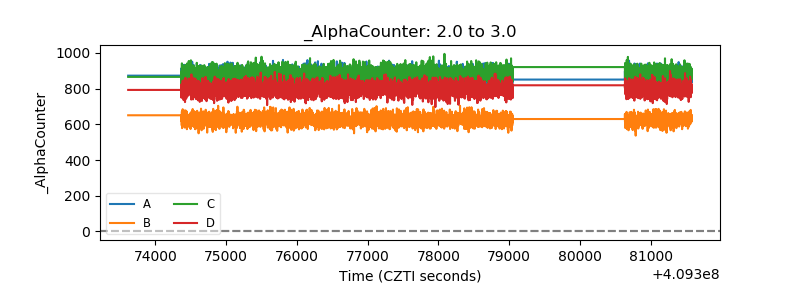 |
| _CPM_Rate | 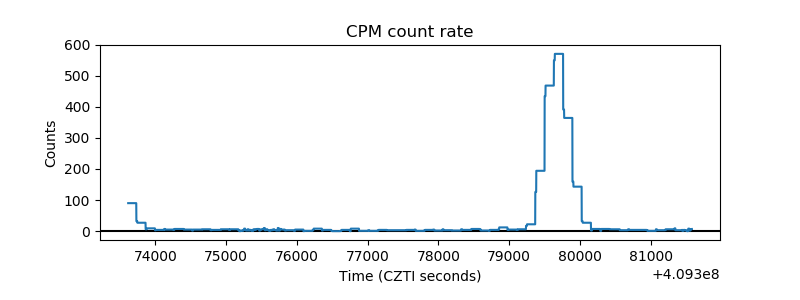 |
| CZT Counter | 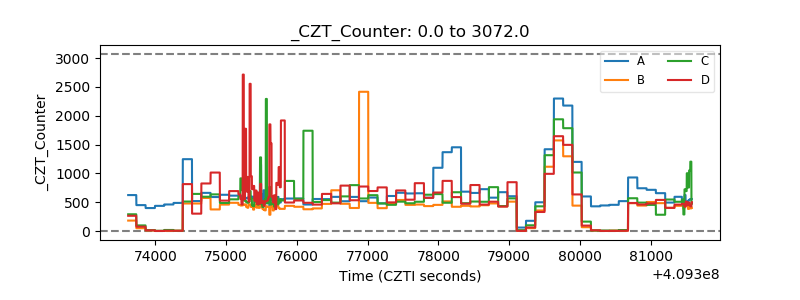 |
| +2.5 Volts monitor | 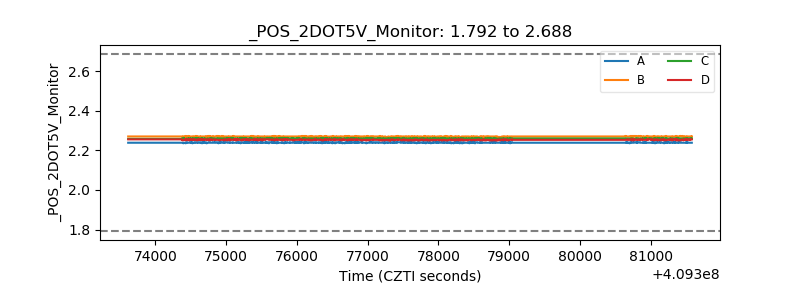 |
| +5 Volts monitor |  |
| _ROLL_ROT | 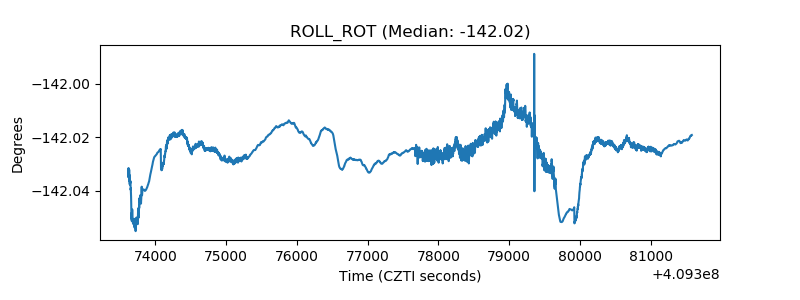 |
| _Roll_DEC | 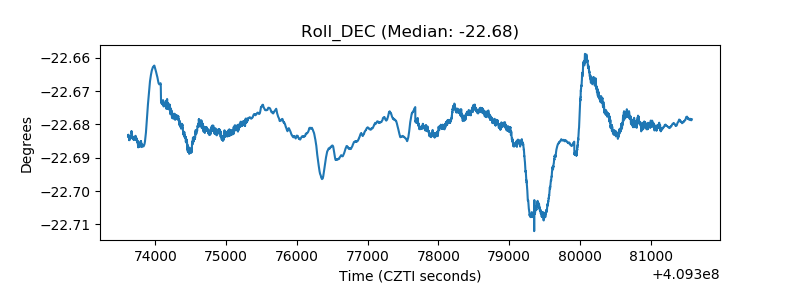 |
| _Roll_RA | 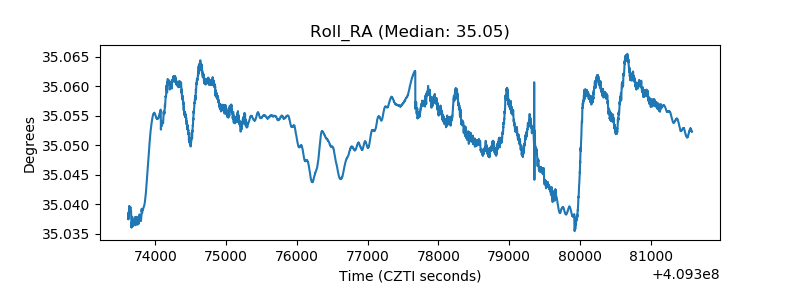 |
| Veto Counter | 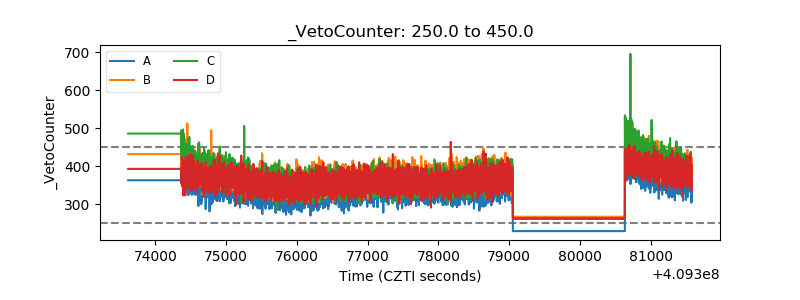 |