| Param | Original file | Final file |
|---|---|---|
| Filename | modeM0/AS1T05_067T01_9000005432_39109cztM0_level2.fits | modeM0/AS1T05_067T01_9000005432_39109cztM0_level2_quad_clean.evt |
| Size (bytes) | 1,384,983,360 | 311,333,760 |
| Size | 1.3 GB | 296.9 MB |
| Events in quadrant A | 15,016,989 | 2,094,804 |
| Events in quadrant B | 8,776,444 | 2,167,679 |
| Events in quadrant C | 13,280,714 | 1,986,891 |
| Events in quadrant D | 12,726,855 | 1,868,357 |
| Mode M0 | |||
|---|---|---|---|
| Quadrant | BADHDUFLAG | Total packets | Discarded packets |
| A | 0 | 57469 | 5 |
| B | 0 | 38843 | 4 |
| C | 0 | 51522 | 4 |
| D | 0 | 50658 | 4 |
| Mode SS | |||
|---|---|---|---|
| Quadrant | BADHDUFLAG | Total packets | Discarded packets |
| A | 0 | 388 | 0 |
| B | 0 | 388 | 0 |
| C | 0 | 388 | 0 |
| D | 0 | 388 | 0 |
| Mode M9 | |||
|---|---|---|---|
| Quadrant | BADHDUFLAG | Total packets | Discarded packets |
| A | 0 | 61 | 0 |
| B | 0 | 61 | 0 |
| C | 0 | 61 | 0 |
| D | 0 | 61 | 0 |
| Quadrant | Total seconds | Saturated seconds | Saturation percentage |
|---|---|---|---|
| A | 18997 | 167 | 0.879086% |
| B | 18997 | 75 | 0.394799% |
| C | 18997 | 621 | 3.268937% |
| D | 18997 | 384 | 2.021372% |
Noise dominated data is calculated using 1-second bins in cleaned event files. If a bin has >2000 counts, and if more than 50% of those come from <1% of pixels, then it is considered to be noise-dominated and hence unusable.
| Quadrant | # 1 sec bins | Bins with >0 counts | Bins with >2000 counts | High rate bins dominated by noise | Noise dominated (total time) | Noise dominated (detector-on time) | Marked lightcurve |
|---|---|---|---|---|---|---|---|
| A | 25086 | 19001 | 58 | 58 | 0.23% | 0.31% | 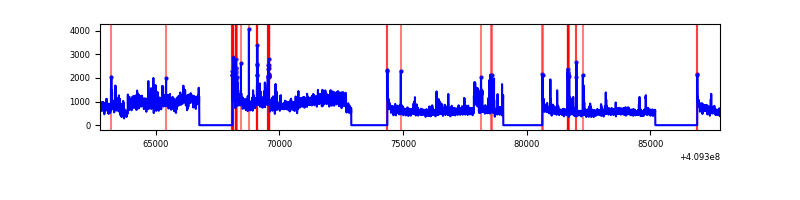 |
| B | 25086 | 19001 | 38 | 38 | 0.15% | 0.20% | 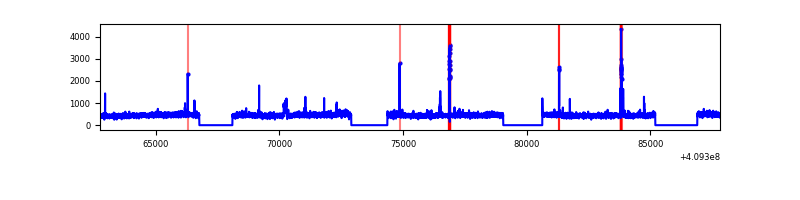 |
| C | 25086 | 19001 | 494 | 494 | 1.97% | 2.60% | 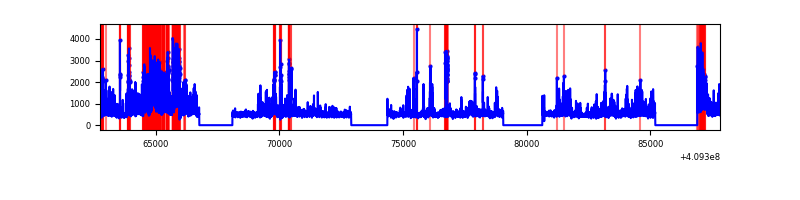 |
| D | 25086 | 19001 | 309 | 309 | 1.23% | 1.63% | 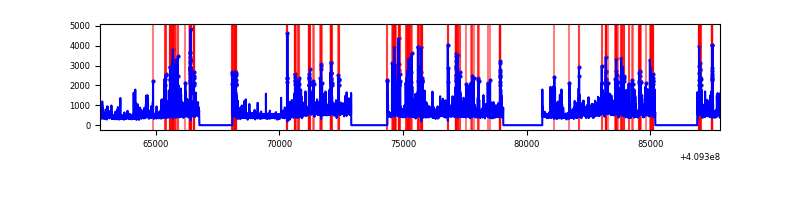 |
Top three noisy pixels from each quadrant. If the there are fewer than three noisy pixels in the level2.evt file, extra rows are filled as -1
| Pixel properties | Quadrant properties | ||||||
|---|---|---|---|---|---|---|---|
| Quadrant | DetID | PixID | Counts | Sigma | Mean | Median | Sigma |
| A | 15 | 223 | 5127112 | 11980.35 | 2132 | 2091 | 427.8 |
| A | 10 | 83 | 1211286 | 2826.64 | 2132 | 2091 | 427.8 |
| A | 13 | 248 | 146343 | 337.21 | 2132 | 2091 | 427.8 |
| B | 5 | 184 | 163579 | 396.22 | 2125 | 2067 | 407.6 |
| B | 5 | 172 | 118482 | 285.59 | 2125 | 2067 | 407.6 |
| B | 0 | 230 | 111464 | 268.37 | 2125 | 2067 | 407.6 |
| C | 15 | 208 | 3850501 | 8060.86 | 2058 | 2071 | 477.4 |
| C | 15 | 214 | 785380 | 1640.71 | 2058 | 2071 | 477.4 |
| C | 9 | 187 | 575480 | 1201.05 | 2058 | 2071 | 477.4 |
| D | 12 | 235 | 2262882 | 4500.26 | 2062 | 2003 | 502.4 |
| D | 5 | 222 | 406367 | 804.88 | 2062 | 2003 | 502.4 |
| D | 2 | 249 | 376053 | 744.54 | 2062 | 2003 | 502.4 |
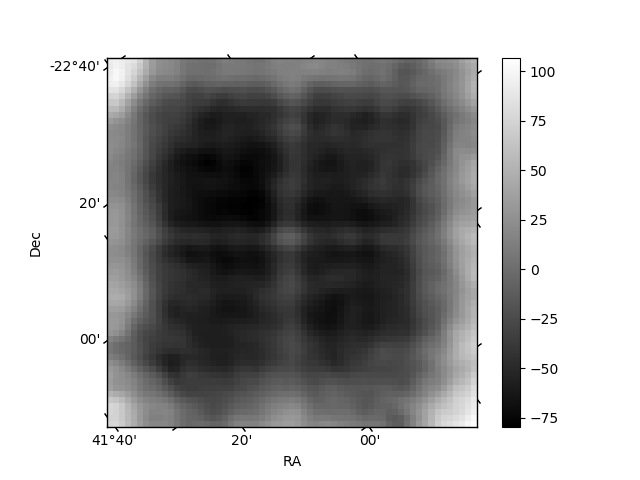
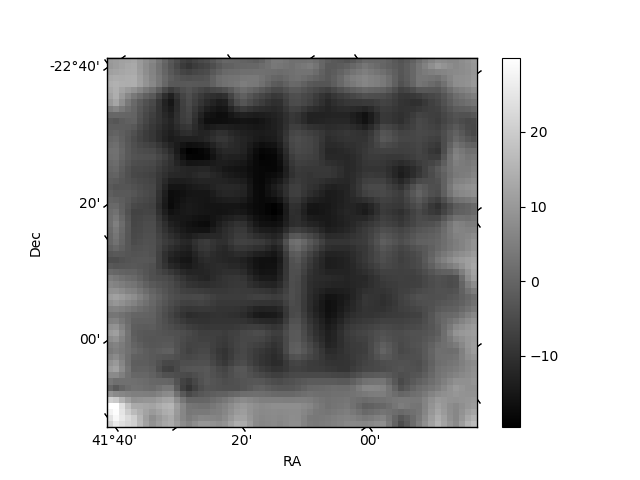
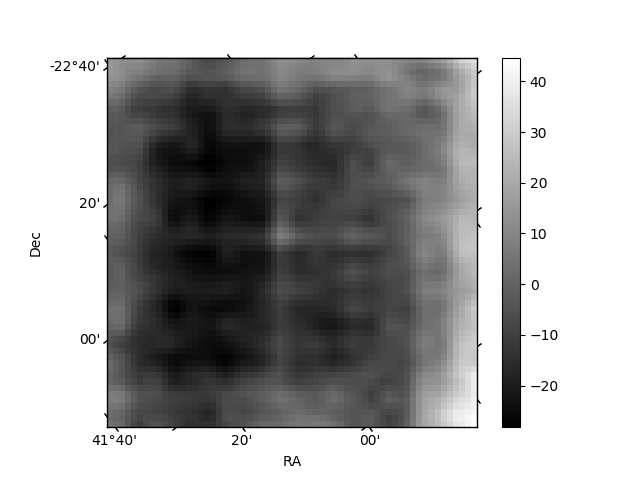
Histogram calculated using DETX and DETY for each event in the final _common_clean file
| Quadrant A | 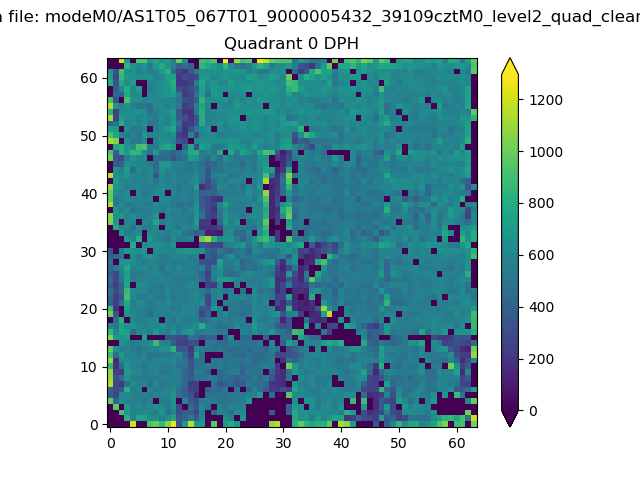 |
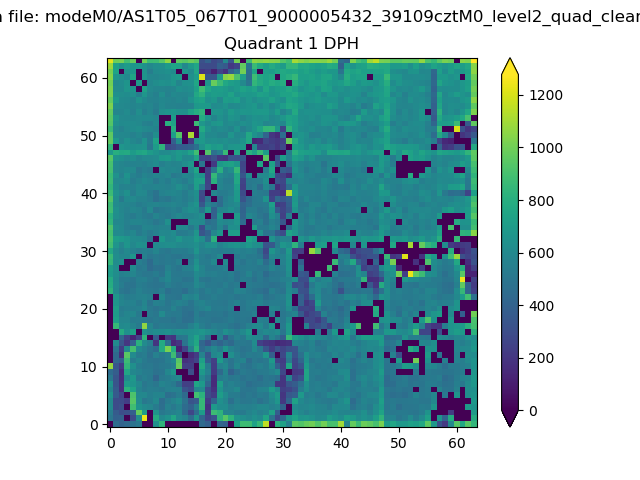 |
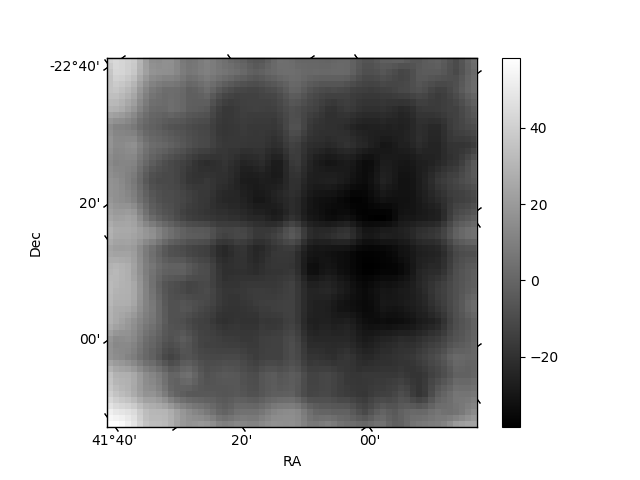
Quadrant B |
|---|---|---|---|
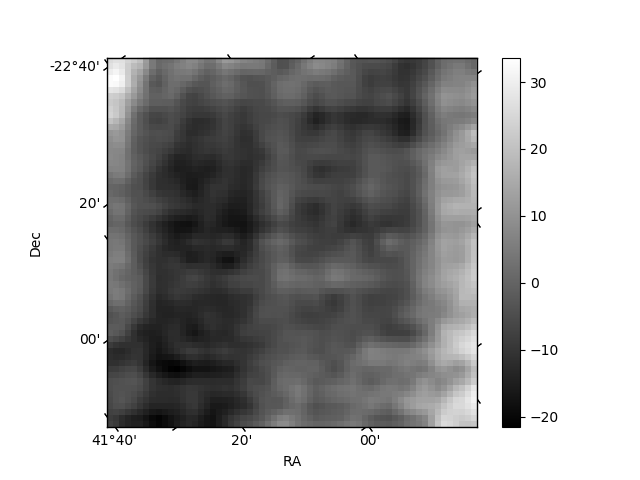
| Quadrant D | 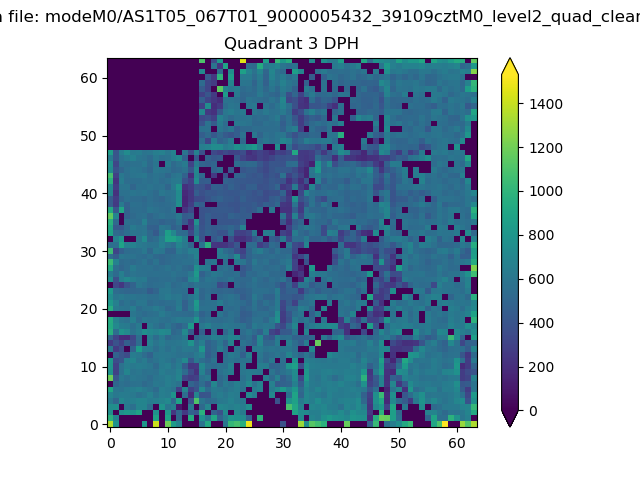 |
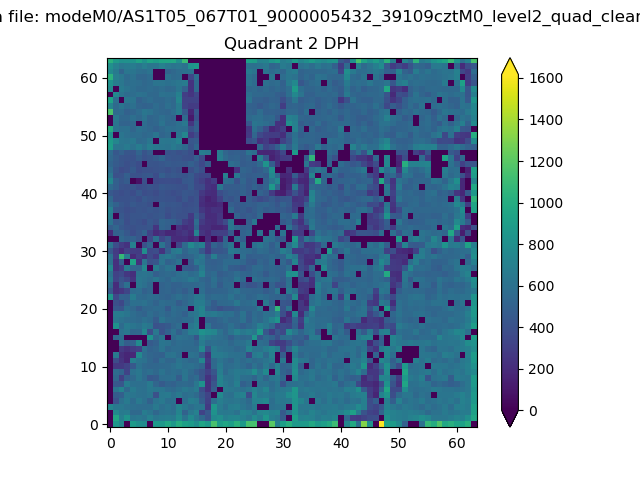 |
Quadrant C |
| Plot type | Count rate plots | Images |
|---|---|---|
| Comparison with Poisson distribution Blue bars denote a histogram of data divided into 1 sec bins. Red curve is a Poisson curve with rate = median count rate of data. |
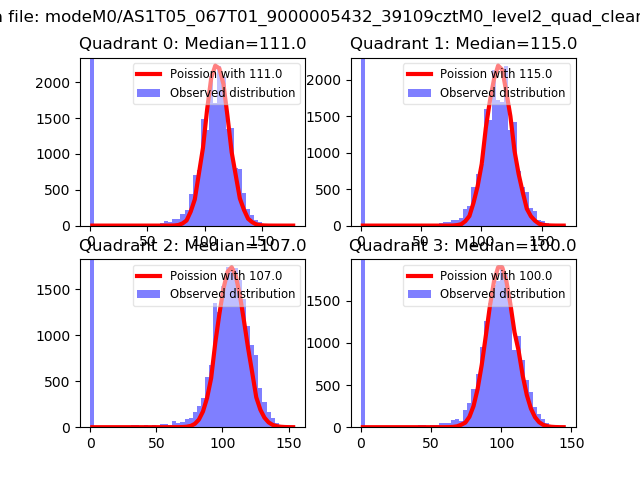 |
 |
| Quadrant-wise count rates Data is divided into 100 sec bins |
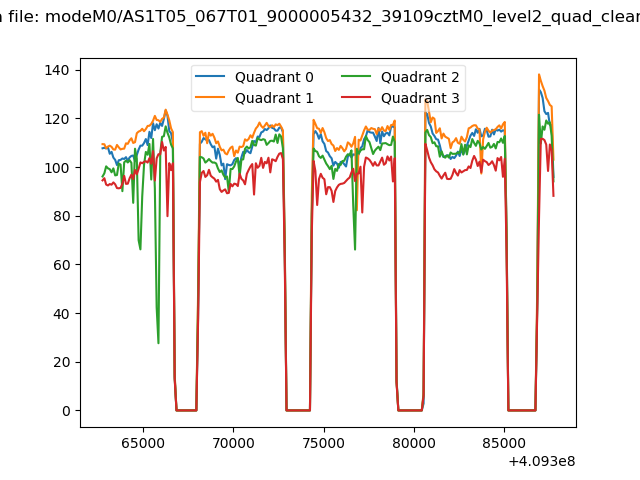 |
|
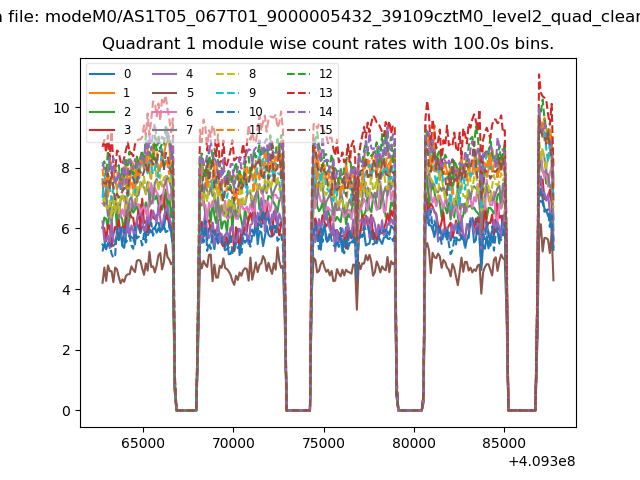
| Module-wise count rates for Quadrant A Data is divided into 100 sec bins |
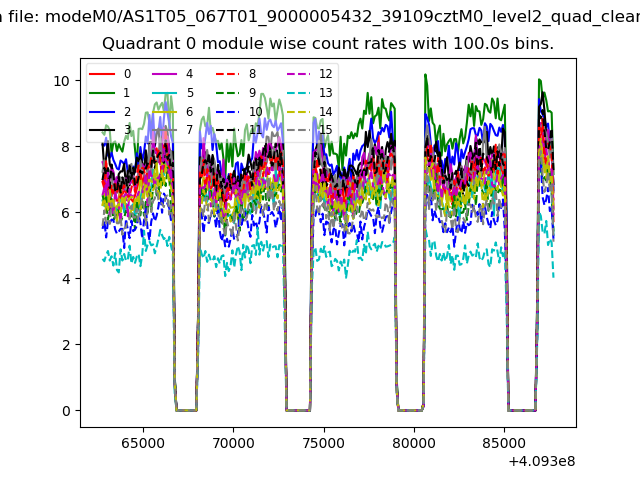 |
 |
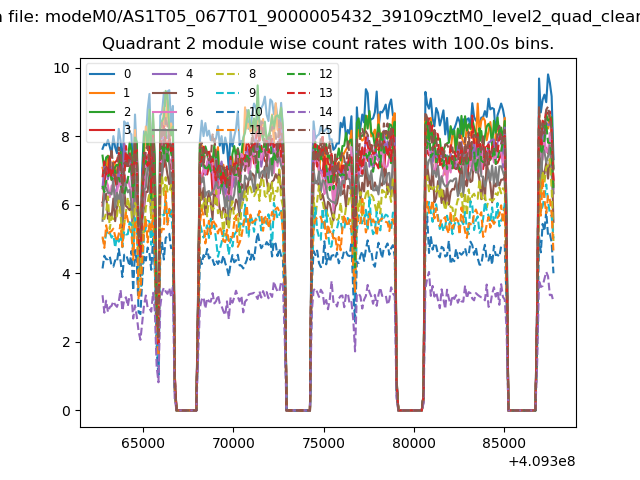
| Module-wise count rates for Quadrant B Data is divided into 100 sec bins |
 |
 |
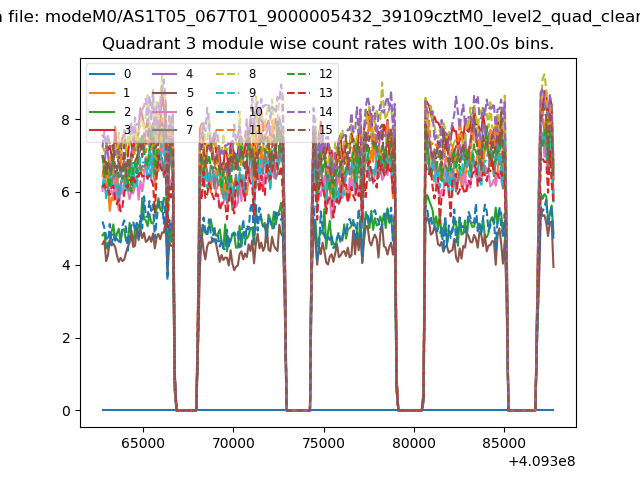
| Module-wise count rates for Quadrant C Data is divided into 100 sec bins |
 |
 |
| Module-wise count rates for Quadrant D Data is divided into 100 sec bins |
 |
 |
| Parameter | Plot |
|---|---|
| CZT HV Monitor | 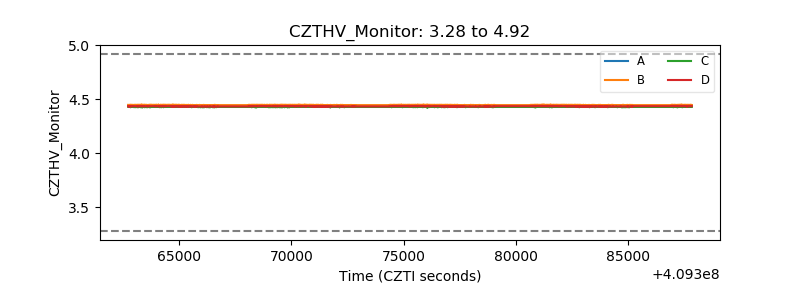 |
| D_VDD | 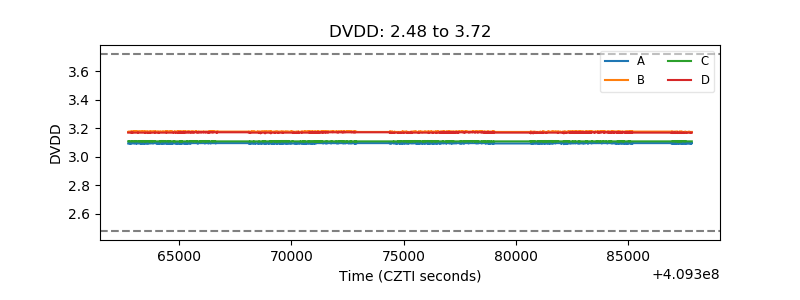 |
| Temperature 1 | 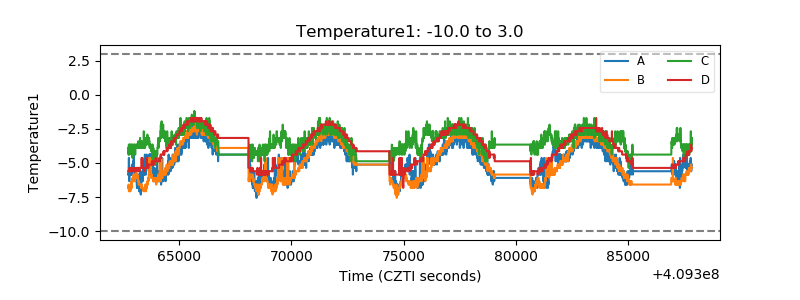 |
| Veto HV Monitor | 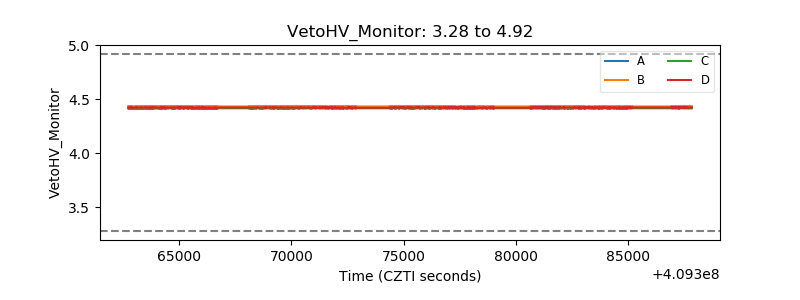 |
| Veto LLD | 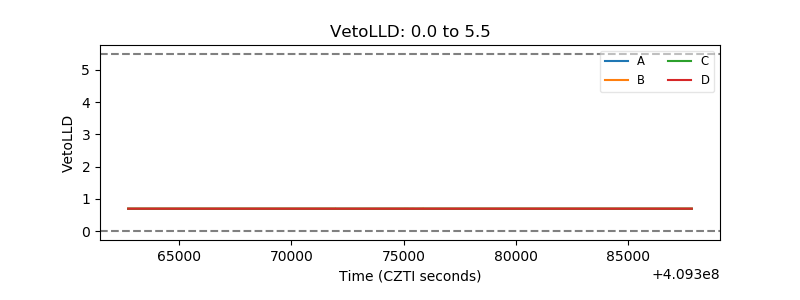 |
| Alpha Counter | 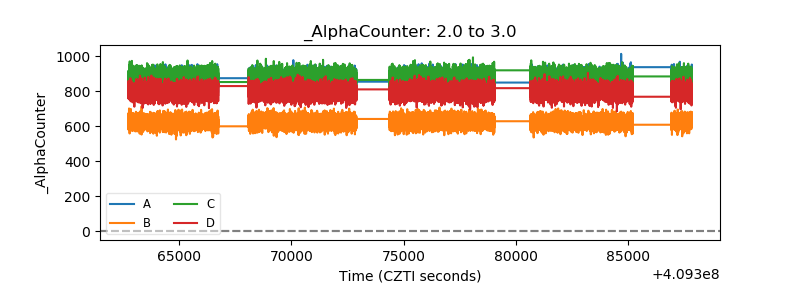 |
| _CPM_Rate | 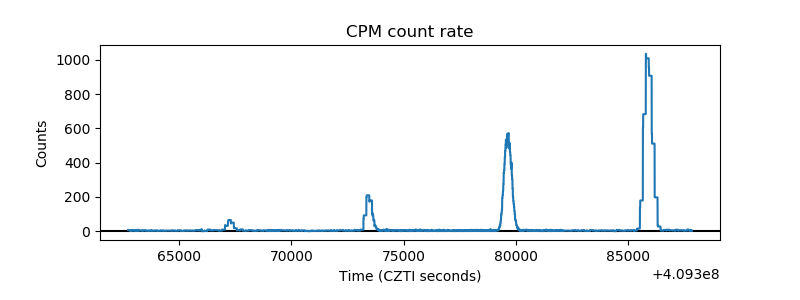 |
| CZT Counter | 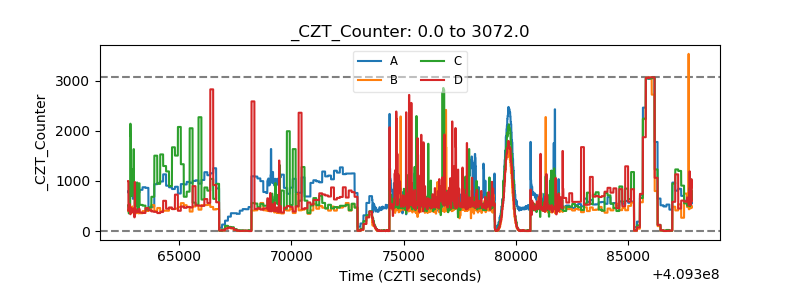 |
| +2.5 Volts monitor | 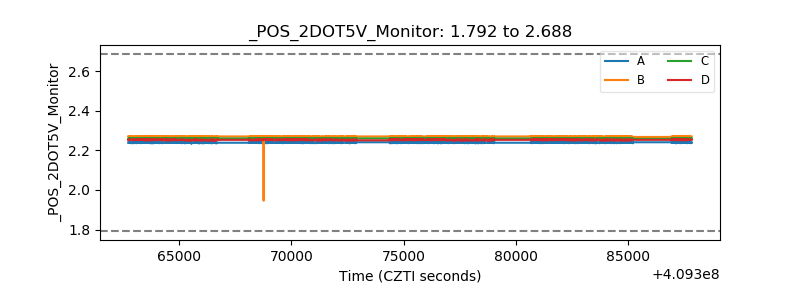 |
| +5 Volts monitor |  |
| _ROLL_ROT | 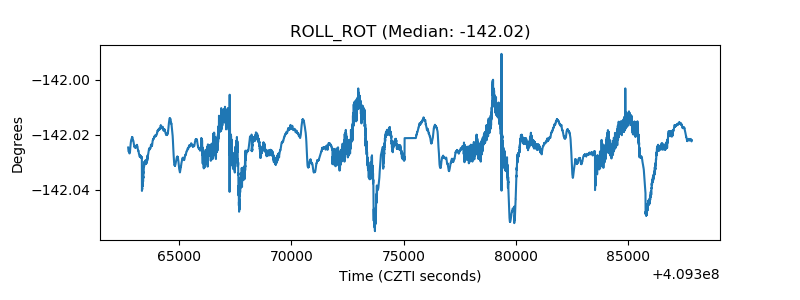 |
| _Roll_DEC | 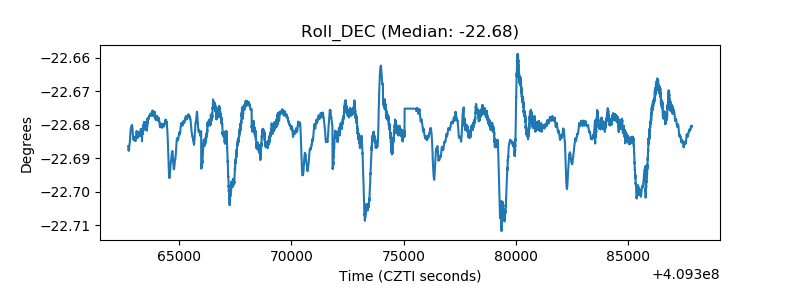 |
| _Roll_RA | 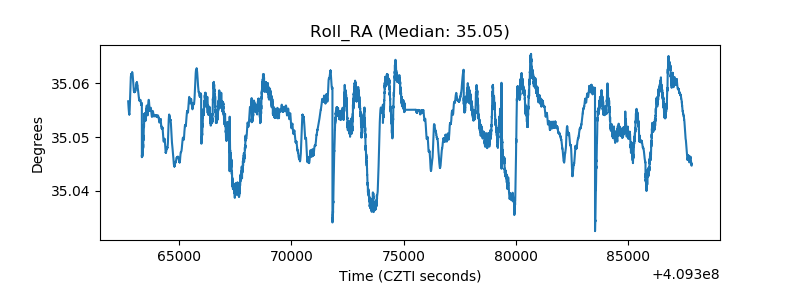 |
| Veto Counter | 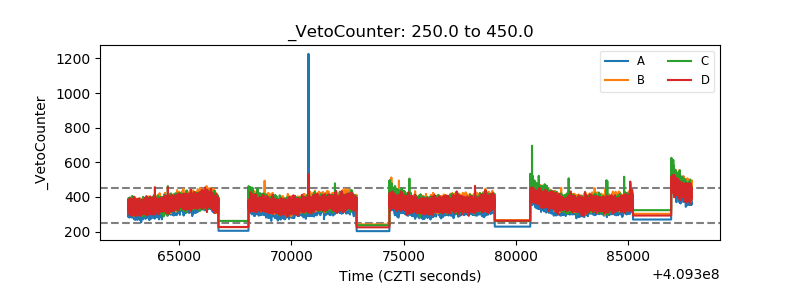 |