| Param | Original file | Final file |
|---|---|---|
| Filename | modeM0/AS1T05_067T01_9000005432_39111cztM0_level2.fits | modeM0/AS1T05_067T01_9000005432_39111cztM0_level2_quad_clean.evt |
| Size (bytes) | 416,450,880 | 96,629,760 |
| Size | 397.2 MB | 92.2 MB |
| Events in quadrant A | 3,312,782 | 660,445 |
| Events in quadrant B | 2,546,634 | 684,771 |
| Events in quadrant C | 4,021,734 | 639,316 |
| Events in quadrant D | 5,112,007 | 560,472 |
| Mode M0 | |||
|---|---|---|---|
| Quadrant | BADHDUFLAG | Total packets | Discarded packets |
| A | 0 | 13169 | 3 |
| B | 0 | 11048 | 2 |
| C | 0 | 15644 | 2 |
| D | 0 | 18974 | 2 |
| Mode SS | |||
|---|---|---|---|
| Quadrant | BADHDUFLAG | Total packets | Discarded packets |
| A | 0 | 114 | 0 |
| B | 0 | 114 | 0 |
| C | 0 | 114 | 0 |
| D | 0 | 114 | 0 |
| Mode M9 | |||
|---|---|---|---|
| Quadrant | BADHDUFLAG | Total packets | Discarded packets |
| A | 0 | 35 | 0 |
| B | 0 | 35 | 0 |
| C | 0 | 35 | 0 |
| D | 0 | 35 | 0 |
| Quadrant | Total seconds | Saturated seconds | Saturation percentage |
|---|---|---|---|
| A | 5441 | 27 | 0.496232% |
| B | 5441 | 21 | 0.385958% |
| C | 5441 | 106 | 1.948171% |
| D | 5441 | 410 | 7.535380% |
Noise dominated data is calculated using 1-second bins in cleaned event files. If a bin has >2000 counts, and if more than 50% of those come from <1% of pixels, then it is considered to be noise-dominated and hence unusable.
| Quadrant | # 1 sec bins | Bins with >0 counts | Bins with >2000 counts | High rate bins dominated by noise | Noise dominated (total time) | Noise dominated (detector-on time) | Marked lightcurve |
|---|---|---|---|---|---|---|---|
| A | 8995 | 5443 | 11 | 11 | 0.12% | 0.20% | 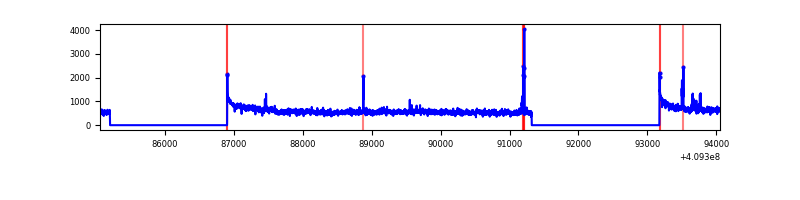 |
| B | 8995 | 5443 | 11 | 11 | 0.12% | 0.20% | 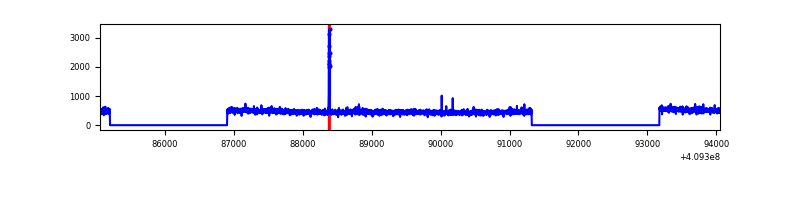 |
| C | 8995 | 5443 | 65 | 65 | 0.72% | 1.19% | 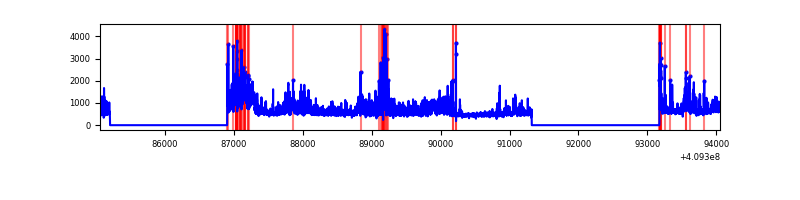 |
| D | 8995 | 5443 | 378 | 378 | 4.20% | 6.94% | 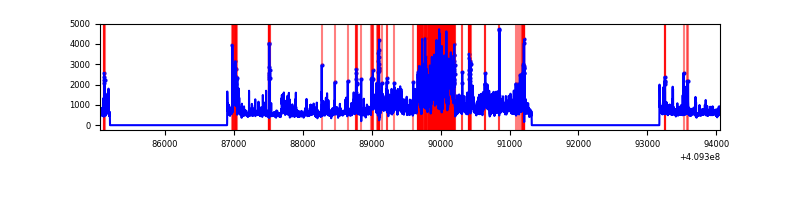 |
Top three noisy pixels from each quadrant. If the there are fewer than three noisy pixels in the level2.evt file, extra rows are filled as -1
| Pixel properties | Quadrant properties | ||||||
|---|---|---|---|---|---|---|---|
| Quadrant | DetID | PixID | Counts | Sigma | Mean | Median | Sigma |
| A | 10 | 83 | 418373 | 3242.26 | 641 | 630 | 128.8 |
| A | 15 | 223 | 325662 | 2522.69 | 641 | 630 | 128.8 |
| A | 9 | 143 | 52441 | 402.12 | 641 | 630 | 128.8 |
| B | 5 | 172 | 38159 | 304.84 | 638 | 621 | 123.1 |
| B | 12 | 111 | 15196 | 118.36 | 638 | 621 | 123.1 |
| B | 11 | 111 | 14194 | 110.22 | 638 | 621 | 123.1 |
| C | 15 | 208 | 1291484 | 8957.38 | 620 | 624 | 144.1 |
| C | 15 | 214 | 230958 | 1598.31 | 620 | 624 | 144.1 |
| C | 9 | 187 | 82699 | 569.52 | 620 | 624 | 144.1 |
| D | 12 | 235 | 1145186 | 7747.88 | 604 | 587 | 147.7 |
| D | 2 | 153 | 1097298 | 7423.72 | 604 | 587 | 147.7 |
| D | 5 | 222 | 267258 | 1805.12 | 604 | 587 | 147.7 |
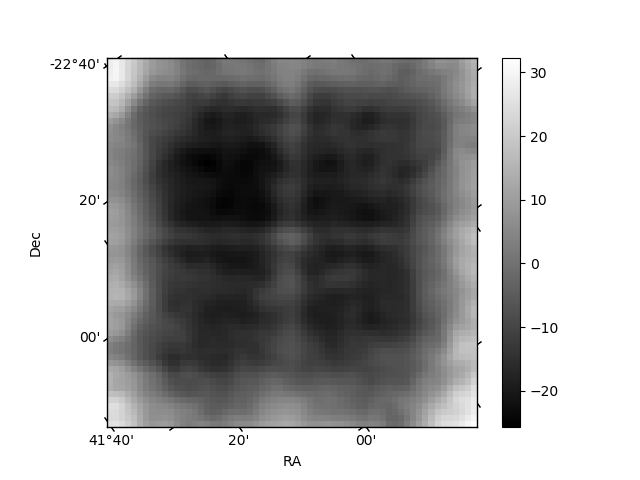
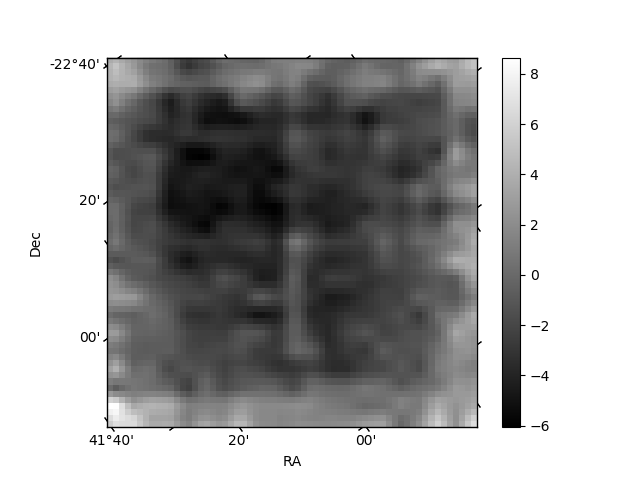
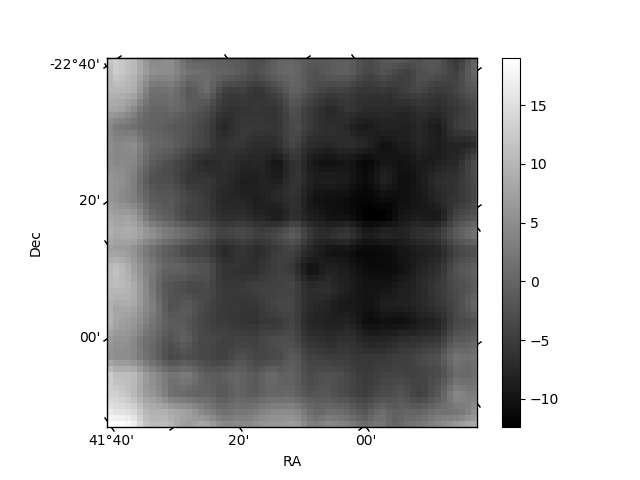
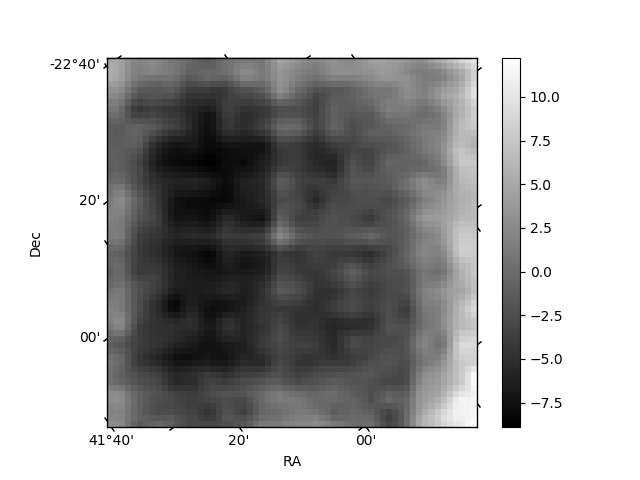
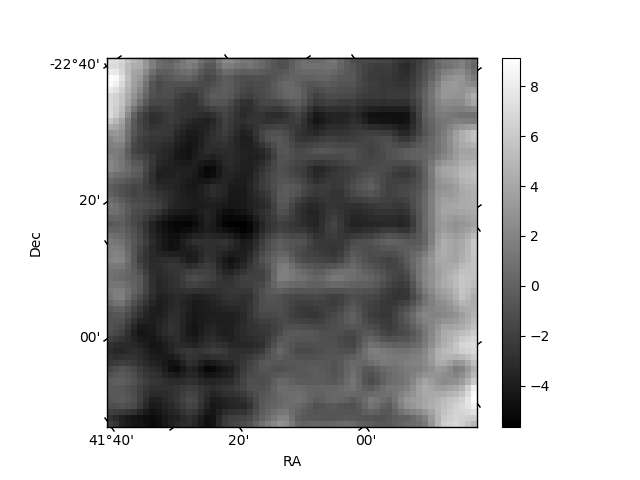
Histogram calculated using DETX and DETY for each event in the final _common_clean file
| Quadrant A | 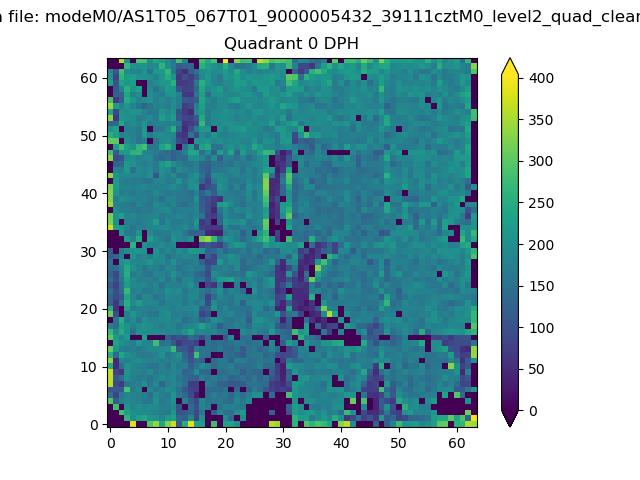 |
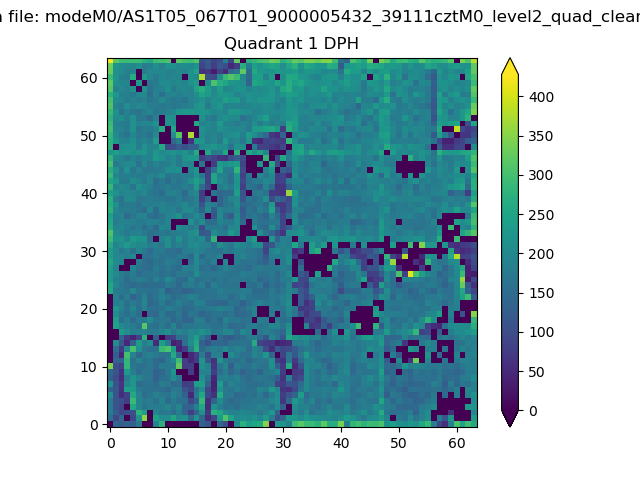 |
Quadrant B |
|---|---|---|---|
| Quadrant D | 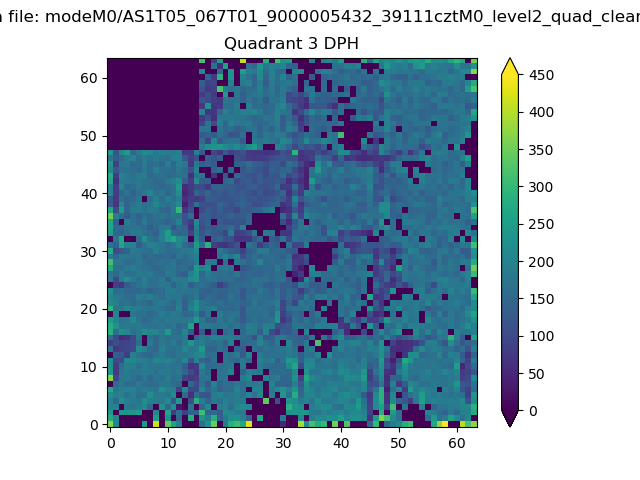 |
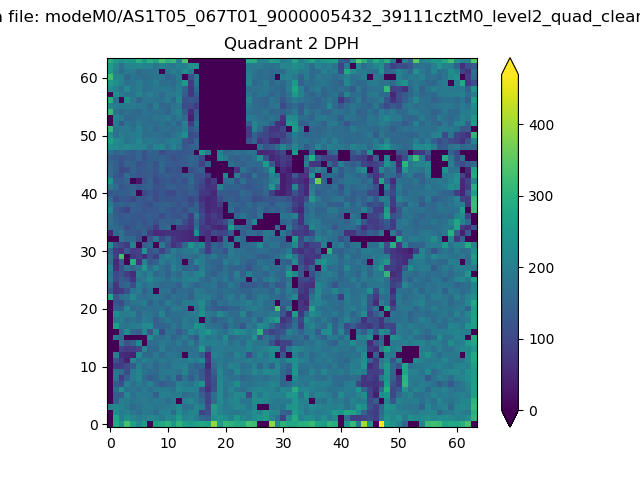 |
Quadrant C |
| Plot type | Count rate plots | Images |
|---|---|---|
| Comparison with Poisson distribution Blue bars denote a histogram of data divided into 1 sec bins. Red curve is a Poisson curve with rate = median count rate of data. |
 |
 |
| Quadrant-wise count rates Data is divided into 100 sec bins |
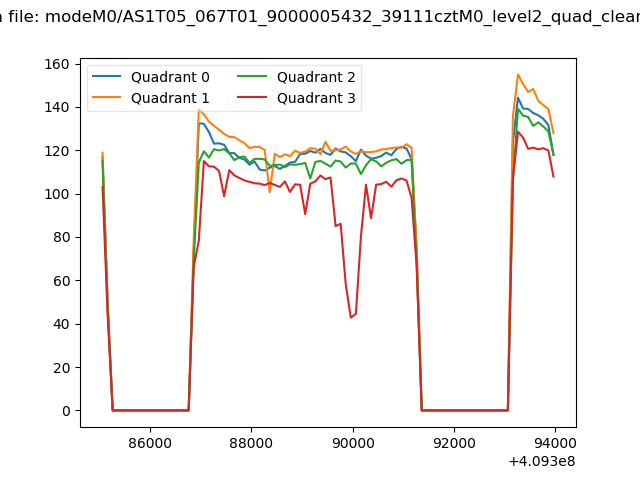 |
|
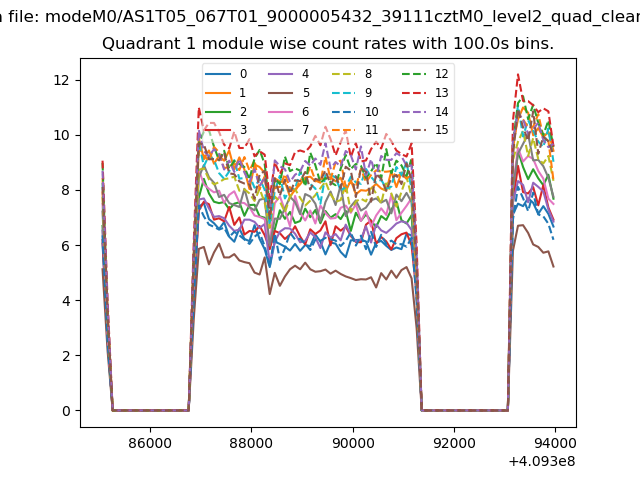
| Module-wise count rates for Quadrant A Data is divided into 100 sec bins |
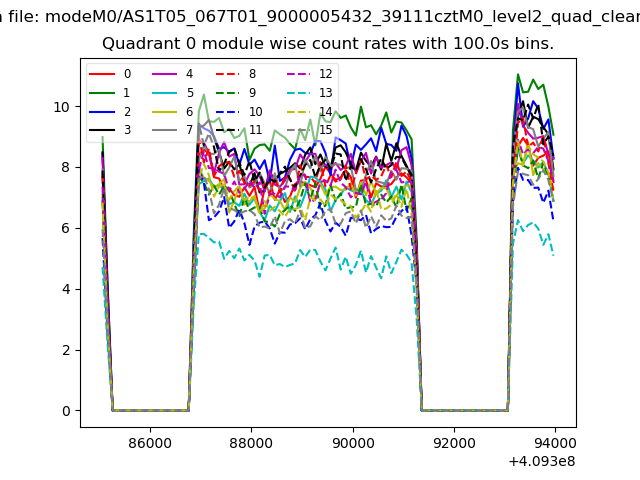 |
 |
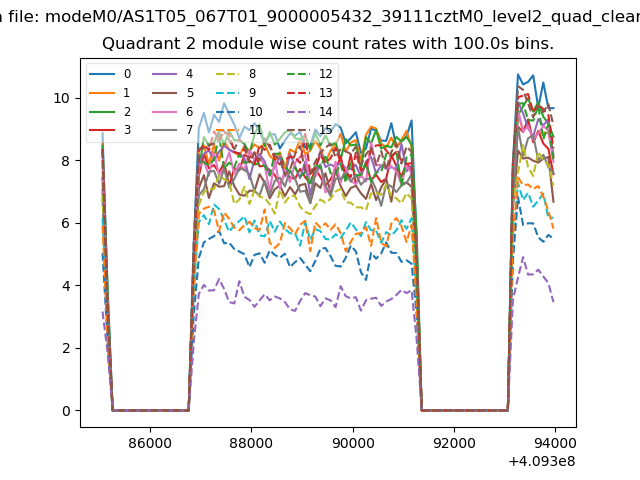
| Module-wise count rates for Quadrant B Data is divided into 100 sec bins |
 |
 |
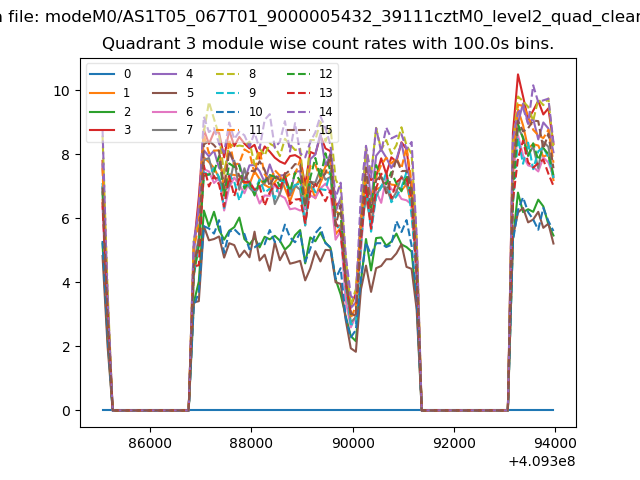
| Module-wise count rates for Quadrant C Data is divided into 100 sec bins |
 |
 |
| Module-wise count rates for Quadrant D Data is divided into 100 sec bins |
 |
 |
| Parameter | Plot |
|---|---|
| CZT HV Monitor | 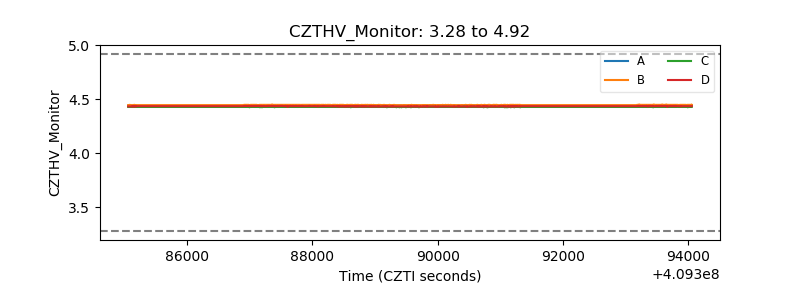 |
| D_VDD | 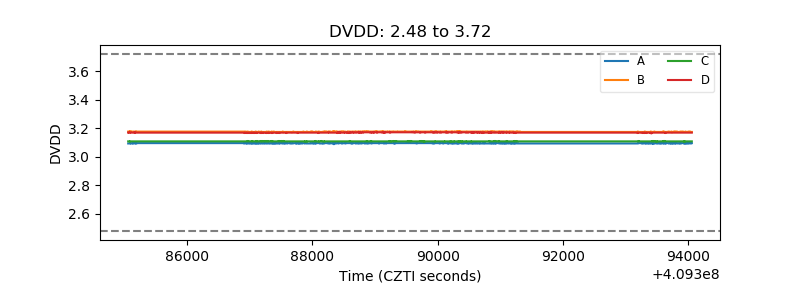 |
| Temperature 1 | 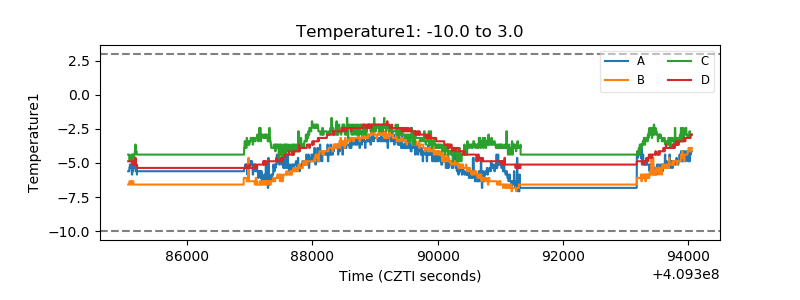 |
| Veto HV Monitor | 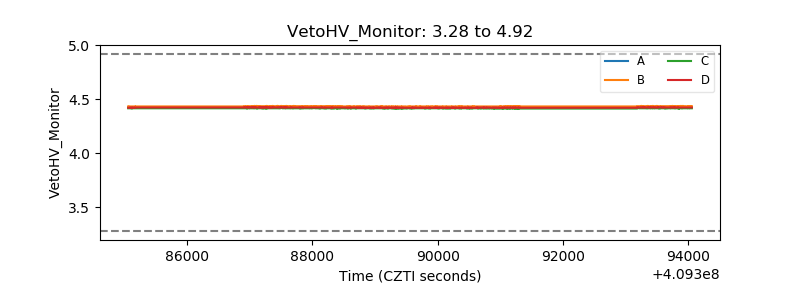 |
| Veto LLD | 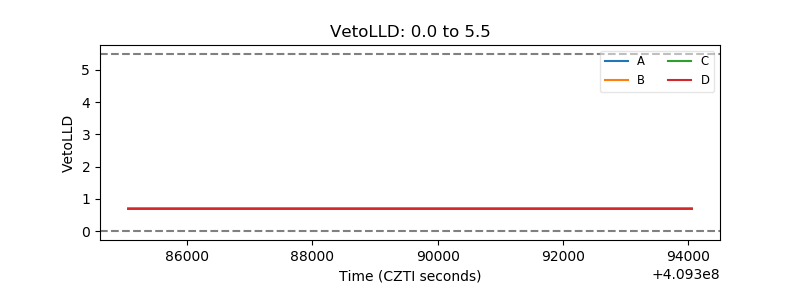 |
| Alpha Counter | 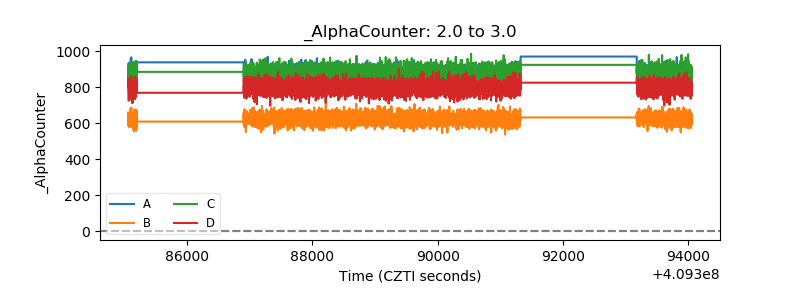 |
| _CPM_Rate | 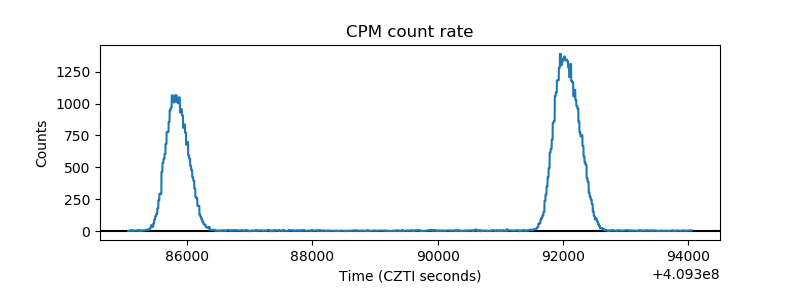 |
| CZT Counter | 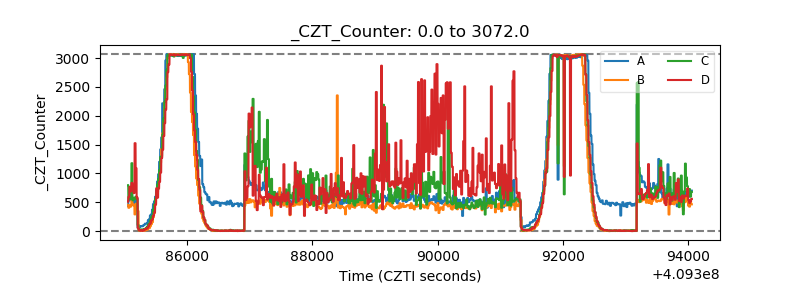 |
| +2.5 Volts monitor | 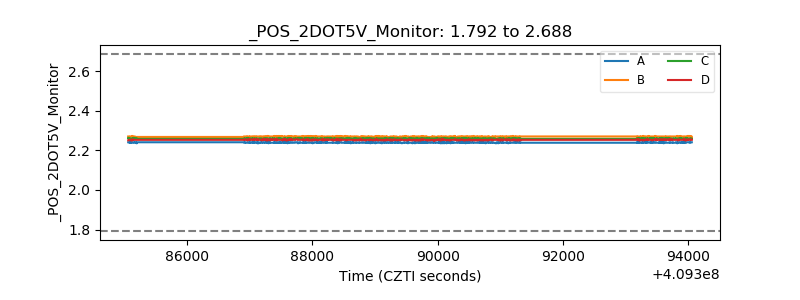 |
| +5 Volts monitor | 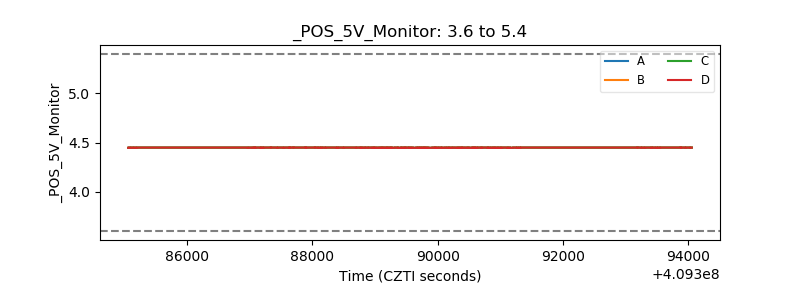 |
| _ROLL_ROT | 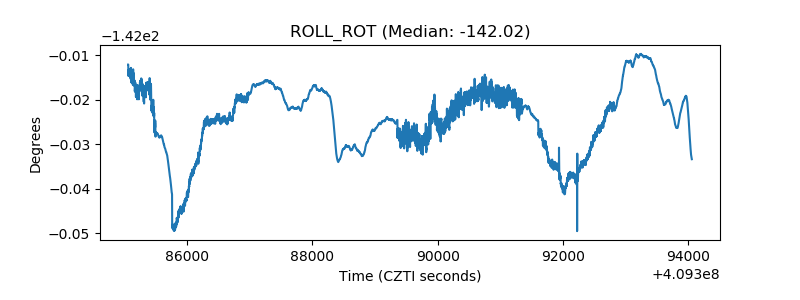 |
| _Roll_DEC | 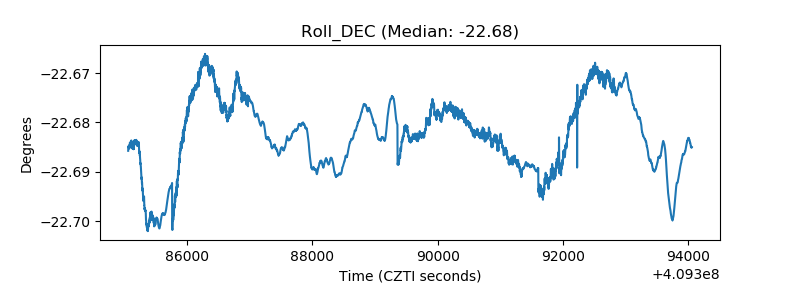 |
| _Roll_RA | 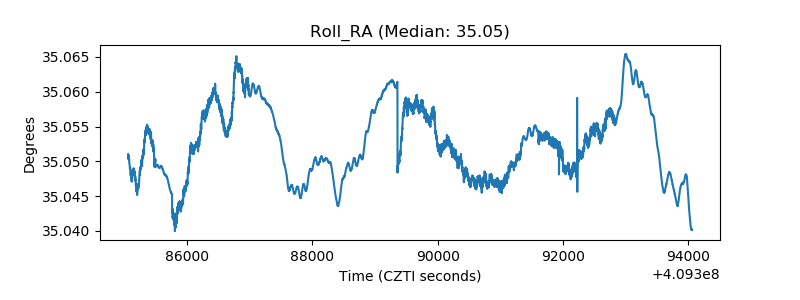 |
| Veto Counter | 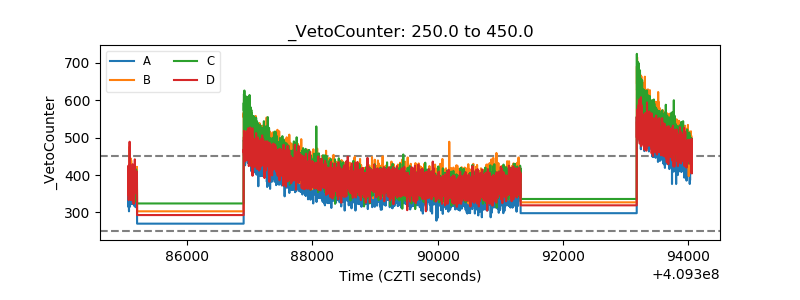 |