| Param | Original file | Final file |
|---|---|---|
| Filename | modeM0/AS1T05_067T01_9000005432_39112cztM0_level2.fits | modeM0/AS1T05_067T01_9000005432_39112cztM0_level2_quad_clean.evt |
| Size (bytes) | 392,880,960 | 101,180,160 |
| Size | 374.7 MB | 96.5 MB |
| Events in quadrant A | 3,588,358 | 697,947 |
| Events in quadrant B | 2,637,087 | 725,548 |
| Events in quadrant C | 3,277,842 | 675,814 |
| Events in quadrant D | 4,620,228 | 586,691 |
| Mode M0 | |||
|---|---|---|---|
| Quadrant | BADHDUFLAG | Total packets | Discarded packets |
| A | 0 | 14458 | 2 |
| B | 0 | 11103 | 1 |
| C | 0 | 13293 | 1 |
| D | 0 | 17460 | 1 |
| Mode SS | |||
|---|---|---|---|
| Quadrant | BADHDUFLAG | Total packets | Discarded packets |
| A | 0 | 112 | 0 |
| B | 0 | 112 | 0 |
| C | 0 | 112 | 0 |
| D | 0 | 112 | 0 |
| Mode M9 | |||
|---|---|---|---|
| Quadrant | BADHDUFLAG | Total packets | Discarded packets |
| A | 0 | 38 | 0 |
| B | 0 | 38 | 0 |
| C | 0 | 38 | 0 |
| D | 0 | 38 | 0 |
| Quadrant | Total seconds | Saturated seconds | Saturation percentage |
|---|---|---|---|
| A | 5400 | 42 | 0.777778% |
| B | 5400 | 7 | 0.129630% |
| C | 5400 | 44 | 0.814815% |
| D | 5400 | 418 | 7.740741% |
Noise dominated data is calculated using 1-second bins in cleaned event files. If a bin has >2000 counts, and if more than 50% of those come from <1% of pixels, then it is considered to be noise-dominated and hence unusable.
| Quadrant | # 1 sec bins | Bins with >0 counts | Bins with >2000 counts | High rate bins dominated by noise | Noise dominated (total time) | Noise dominated (detector-on time) | Marked lightcurve |
|---|---|---|---|---|---|---|---|
| A | 9196 | 5402 | 18 | 18 | 0.20% | 0.33% | 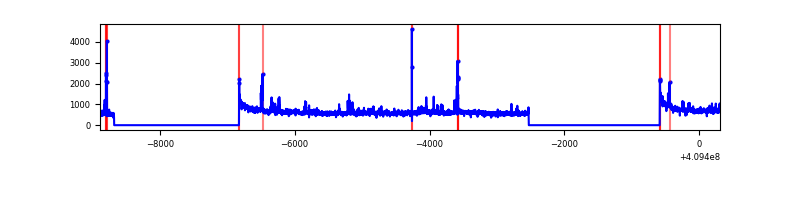 |
| B | 9196 | 5402 | 2 | 2 | 0.02% | 0.04% | 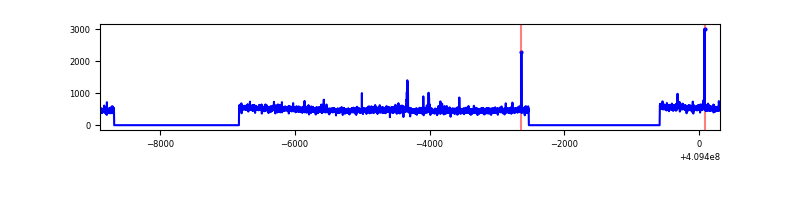 |
| C | 9196 | 5402 | 31 | 31 | 0.34% | 0.57% | 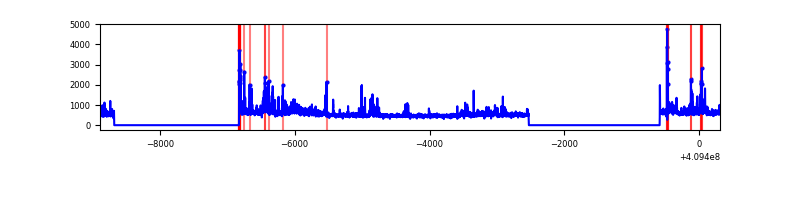 |
| D | 9196 | 5402 | 380 | 380 | 4.13% | 7.03% | 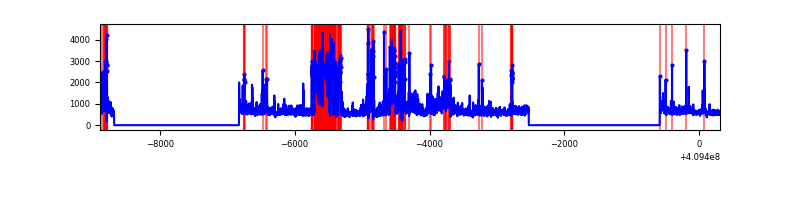 |
Top three noisy pixels from each quadrant. If the there are fewer than three noisy pixels in the level2.evt file, extra rows are filled as -1
| Pixel properties | Quadrant properties | ||||||
|---|---|---|---|---|---|---|---|
| Quadrant | DetID | PixID | Counts | Sigma | Mean | Median | Sigma |
| A | 10 | 83 | 415687 | 3122.44 | 661 | 649 | 132.9 |
| A | 15 | 223 | 369428 | 2774.42 | 661 | 649 | 132.9 |
| A | 12 | 16 | 128711 | 963.44 | 661 | 649 | 132.9 |
| B | 0 | 199 | 20842 | 161.13 | 657 | 642 | 125.4 |
| B | 5 | 172 | 19101 | 147.25 | 657 | 642 | 125.4 |
| B | 12 | 111 | 15282 | 116.78 | 657 | 642 | 125.4 |
| C | 15 | 208 | 441434 | 3020.22 | 634 | 641 | 145.9 |
| C | 15 | 214 | 229648 | 1569.11 | 634 | 641 | 145.9 |
| C | 9 | 187 | 125251 | 853.8 | 634 | 641 | 145.9 |
| D | 2 | 153 | 1152632 | 7646.77 | 619 | 603 | 150.7 |
| D | 12 | 235 | 746216 | 4949.12 | 619 | 603 | 150.7 |
| D | 5 | 222 | 145176 | 959.62 | 619 | 603 | 150.7 |
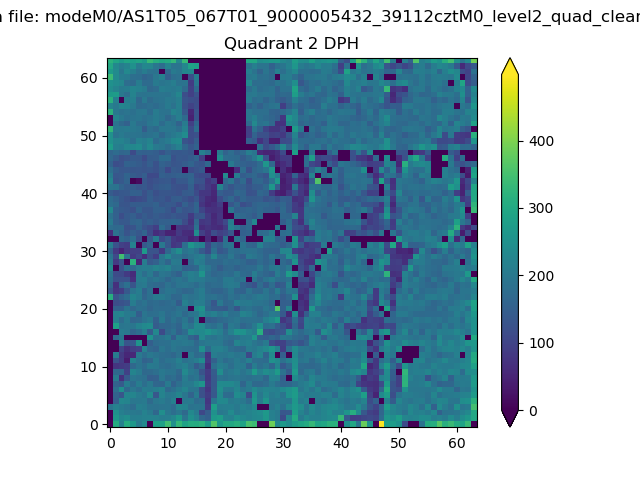
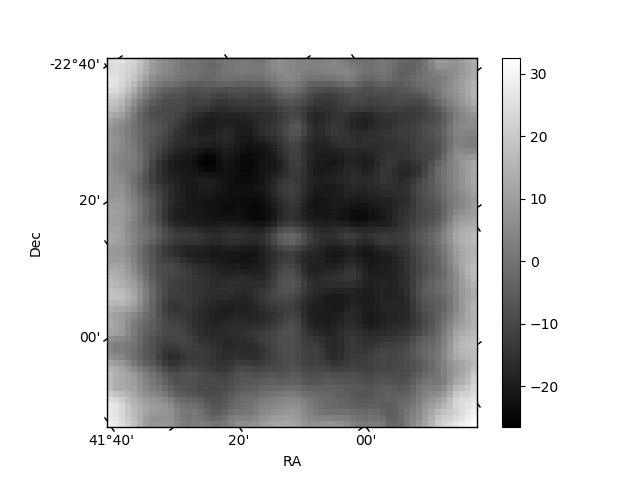
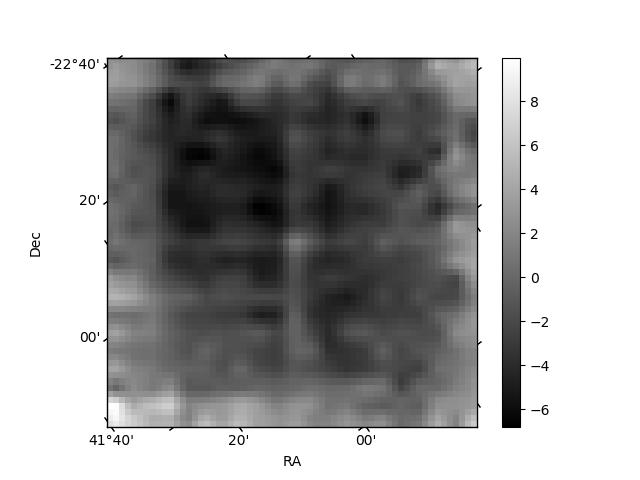
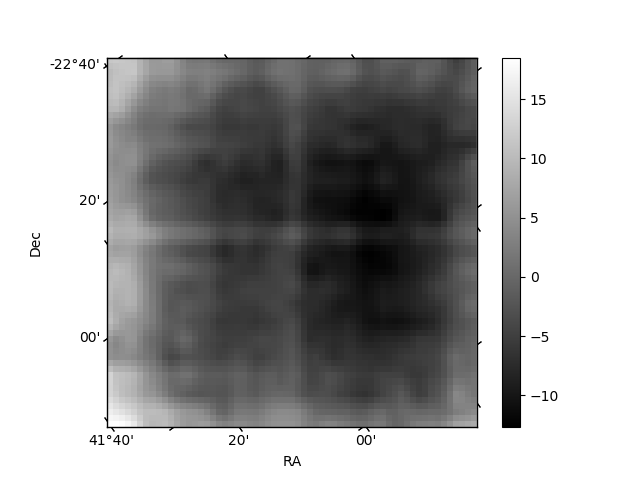
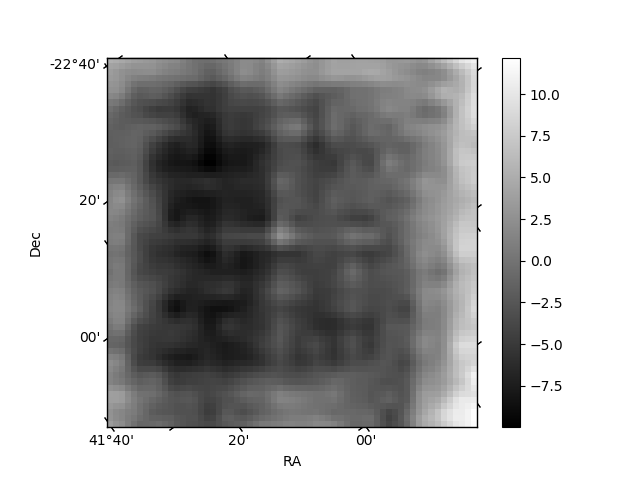
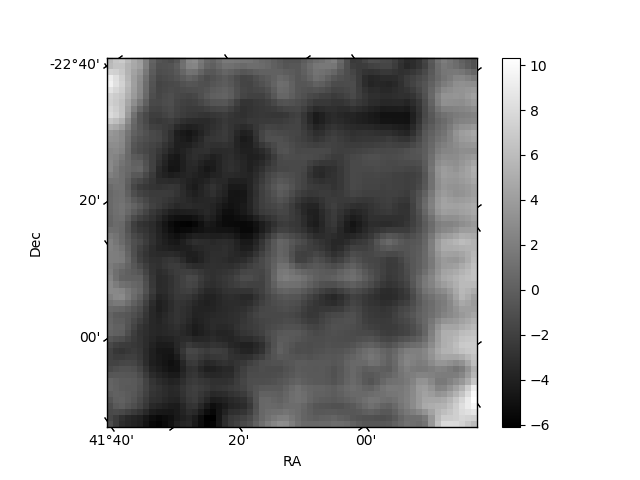
Histogram calculated using DETX and DETY for each event in the final _common_clean file
| Quadrant A | 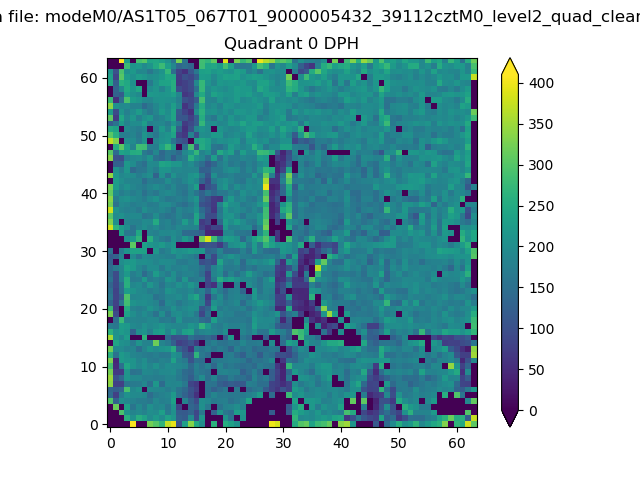 |
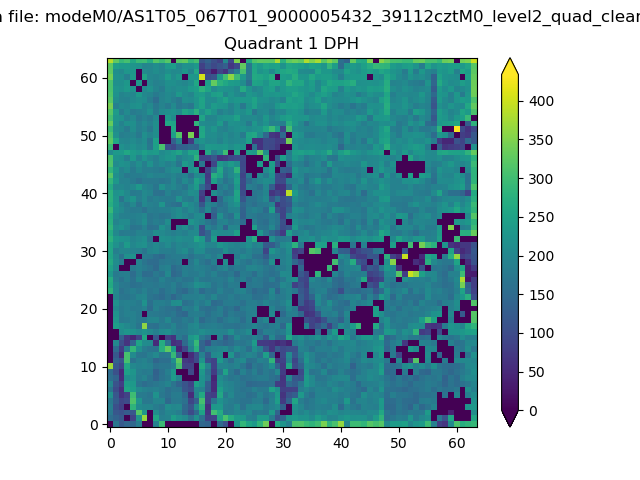 |
Quadrant B |
|---|---|---|---|
| Quadrant D | 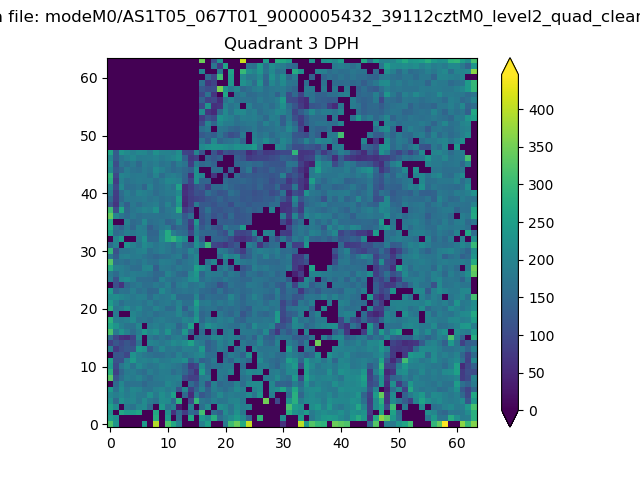 |
 |
Quadrant C |
| Plot type | Count rate plots | Images |
|---|---|---|
| Comparison with Poisson distribution Blue bars denote a histogram of data divided into 1 sec bins. Red curve is a Poisson curve with rate = median count rate of data. |
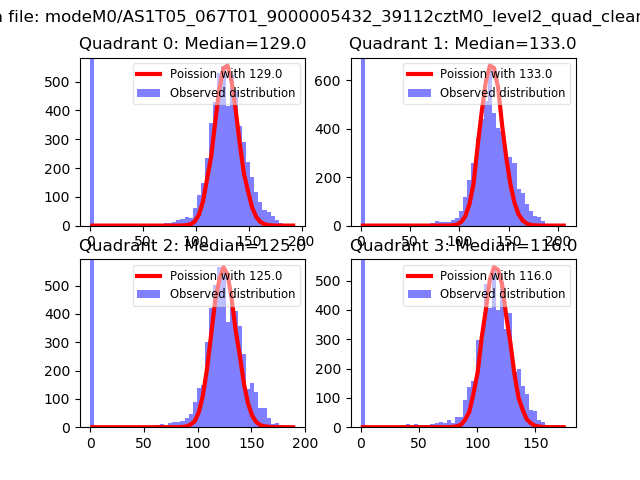 |
 |
| Quadrant-wise count rates Data is divided into 100 sec bins |
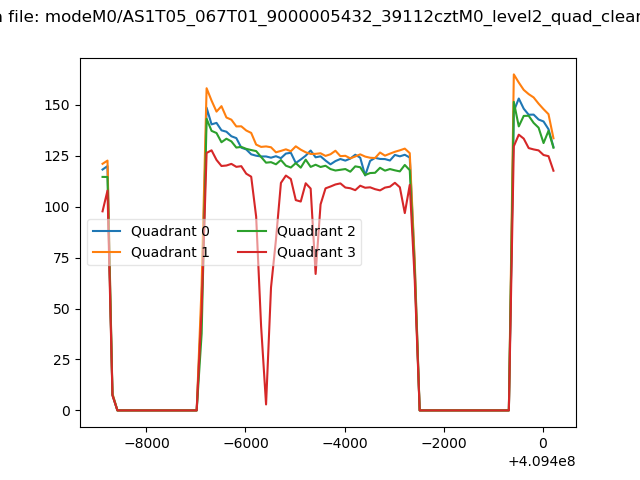 |
|
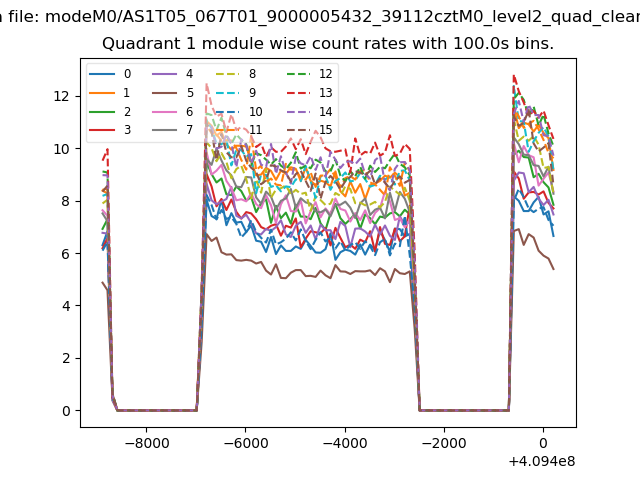
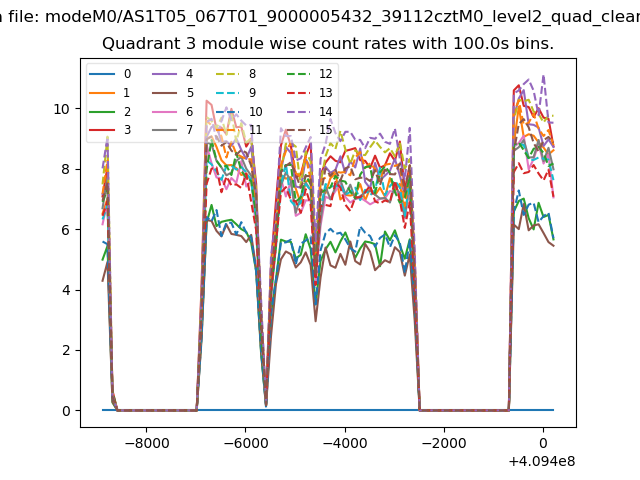
| Module-wise count rates for Quadrant A Data is divided into 100 sec bins |
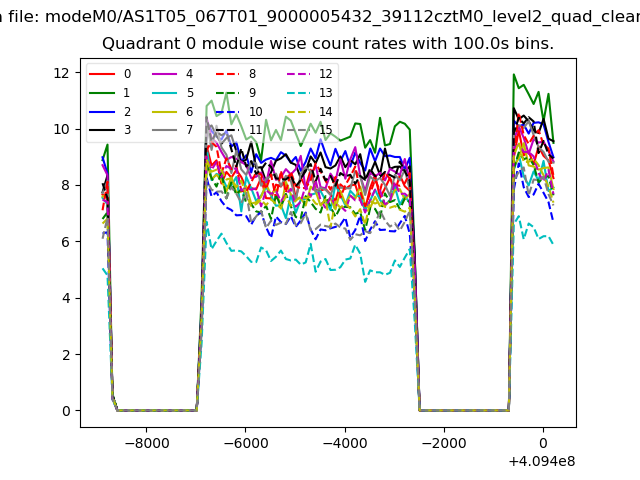 |
 |
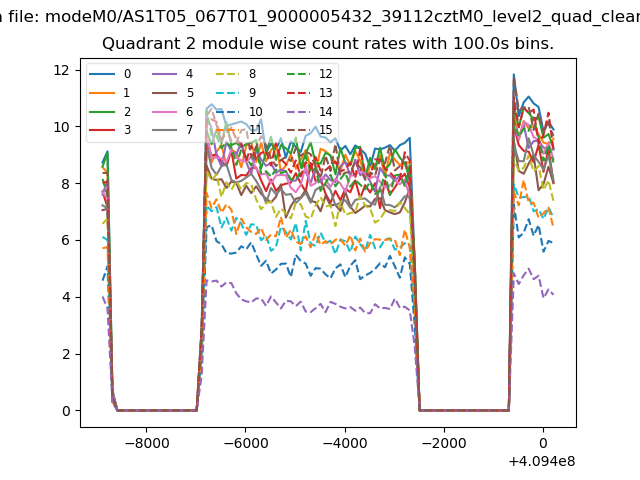
| Module-wise count rates for Quadrant B Data is divided into 100 sec bins |
 |
 |
| Module-wise count rates for Quadrant C Data is divided into 100 sec bins |
 |
 |
| Module-wise count rates for Quadrant D Data is divided into 100 sec bins |
 |
 |
| Parameter | Plot |
|---|---|
| CZT HV Monitor | 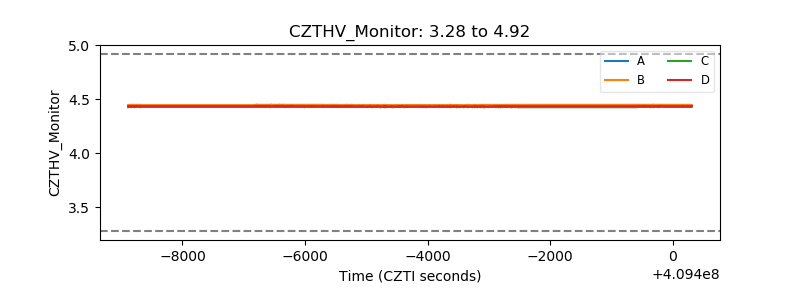 |
| D_VDD | 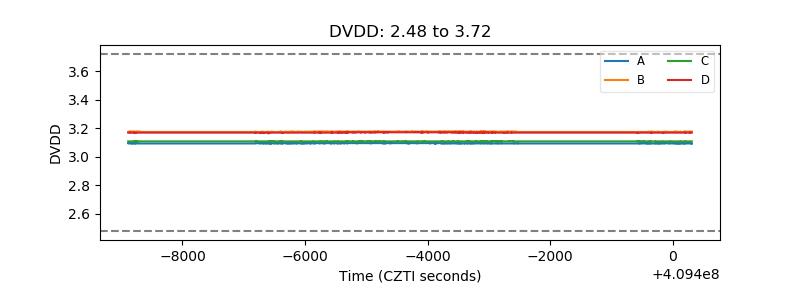 |
| Temperature 1 | 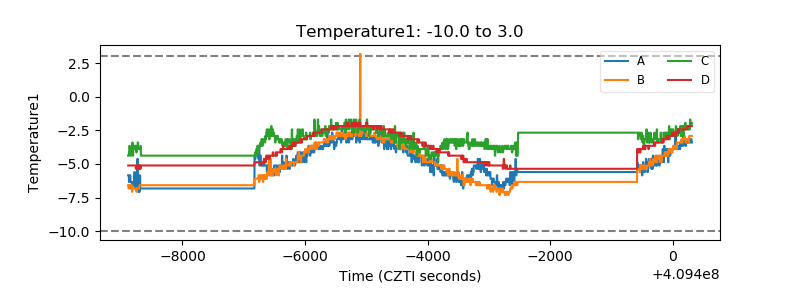 |
| Veto HV Monitor | 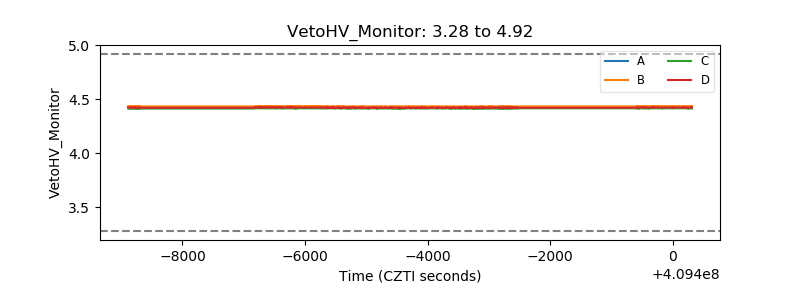 |
| Veto LLD | 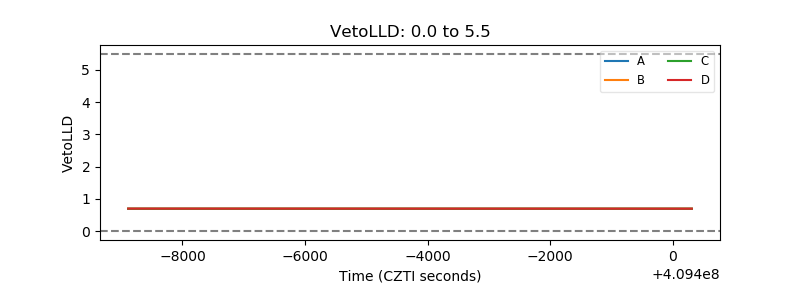 |
| Alpha Counter | 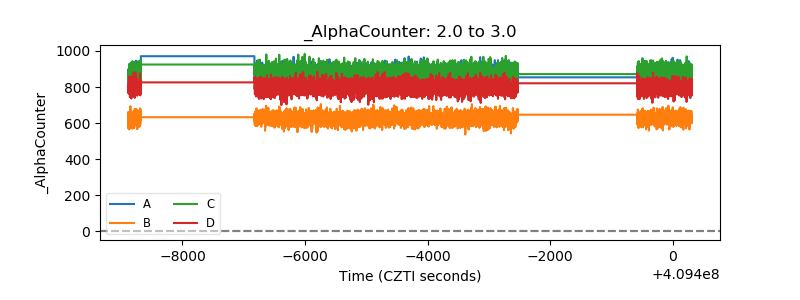 |
| _CPM_Rate | 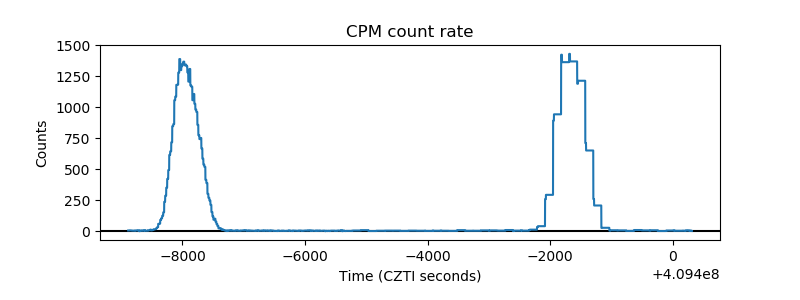 |
| CZT Counter | 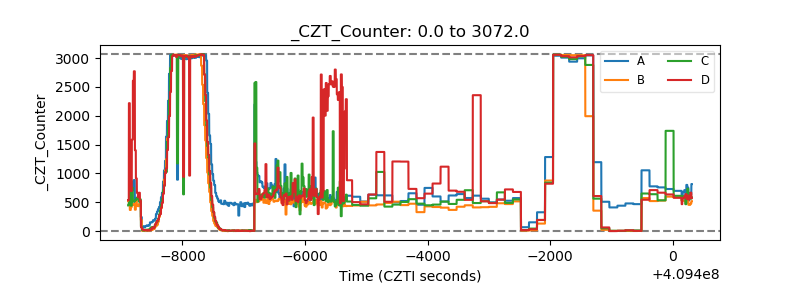 |
| +2.5 Volts monitor | 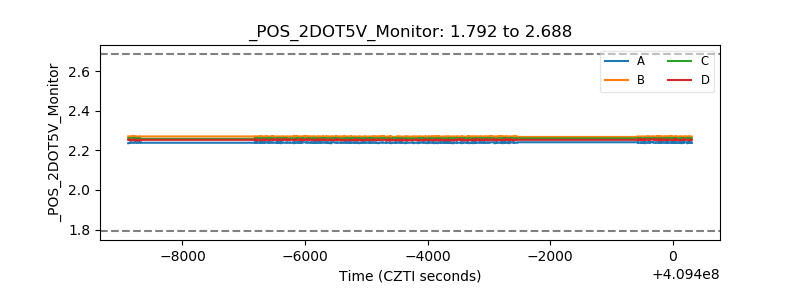 |
| +5 Volts monitor | 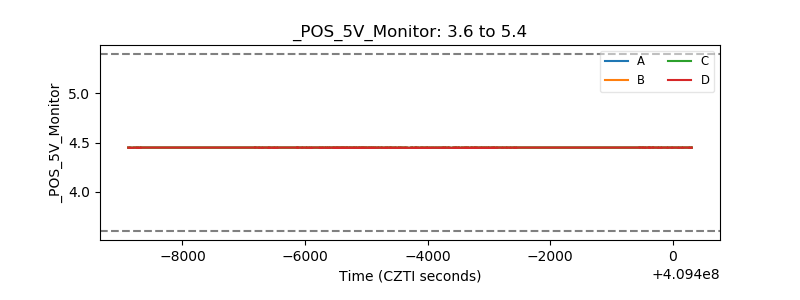 |
| _ROLL_ROT | 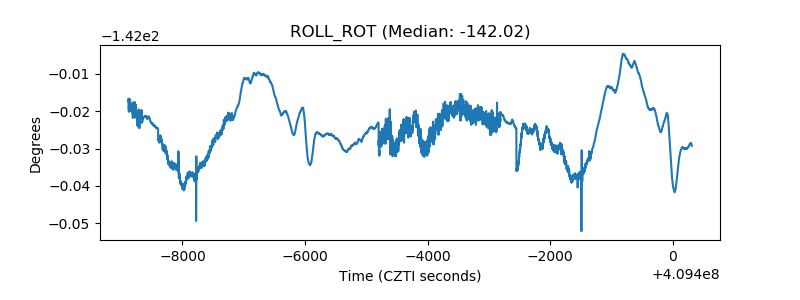 |
| _Roll_DEC | 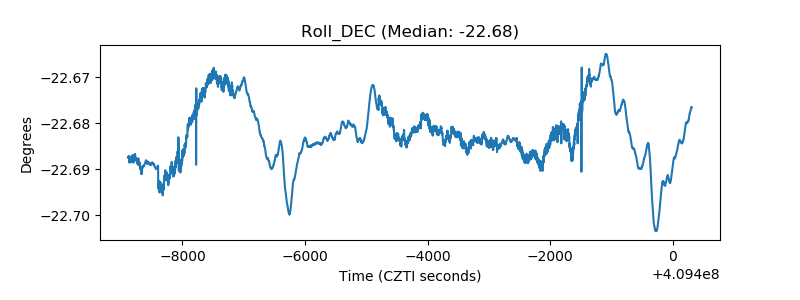 |
| _Roll_RA | 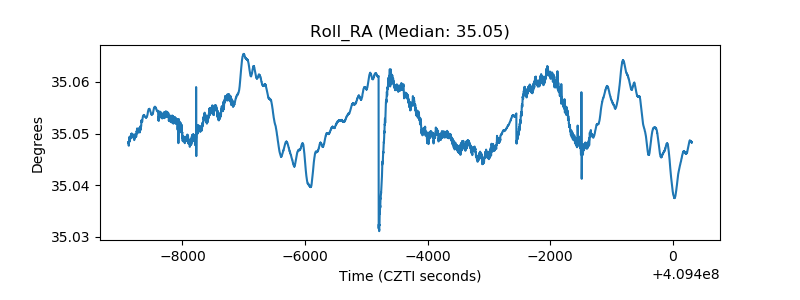 |
| Veto Counter | 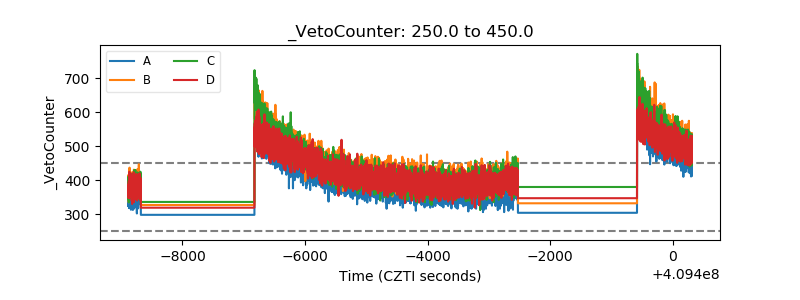 |