| Param | Original file | Final file |
|---|---|---|
| Filename | modeM0/AS1T05_067T01_9000005432_39113cztM0_level2.fits | modeM0/AS1T05_067T01_9000005432_39113cztM0_level2_quad_clean.evt |
| Size (bytes) | 372,228,480 | 100,261,440 |
| Size | 355.0 MB | 95.6 MB |
| Events in quadrant A | 3,786,670 | 691,174 |
| Events in quadrant B | 2,588,747 | 712,592 |
| Events in quadrant C | 3,287,271 | 658,651 |
| Events in quadrant D | 3,715,199 | 612,375 |
| Mode M0 | |||
|---|---|---|---|
| Quadrant | BADHDUFLAG | Total packets | Discarded packets |
| A | 0 | 15038 | 2 |
| B | 0 | 10752 | 1 |
| C | 0 | 13107 | 1 |
| D | 0 | 14795 | 1 |
| Mode SS | |||
|---|---|---|---|
| Quadrant | BADHDUFLAG | Total packets | Discarded packets |
| A | 0 | 108 | 0 |
| B | 0 | 108 | 0 |
| C | 0 | 108 | 0 |
| D | 0 | 108 | 0 |
| Mode M9 | |||
|---|---|---|---|
| Quadrant | BADHDUFLAG | Total packets | Discarded packets |
| A | 0 | 40 | 0 |
| B | 0 | 40 | 0 |
| C | 0 | 40 | 0 |
| D | 0 | 40 | 0 |
| Quadrant | Total seconds | Saturated seconds | Saturation percentage |
|---|---|---|---|
| A | 5158 | 42 | 0.814269% |
| B | 5158 | 24 | 0.465297% |
| C | 5158 | 73 | 1.415277% |
| D | 5158 | 56 | 1.085692% |
Noise dominated data is calculated using 1-second bins in cleaned event files. If a bin has >2000 counts, and if more than 50% of those come from <1% of pixels, then it is considered to be noise-dominated and hence unusable.
| Quadrant | # 1 sec bins | Bins with >0 counts | Bins with >2000 counts | High rate bins dominated by noise | Noise dominated (total time) | Noise dominated (detector-on time) | Marked lightcurve |
|---|---|---|---|---|---|---|---|
| A | 9133 | 5160 | 8 | 8 | 0.09% | 0.16% | 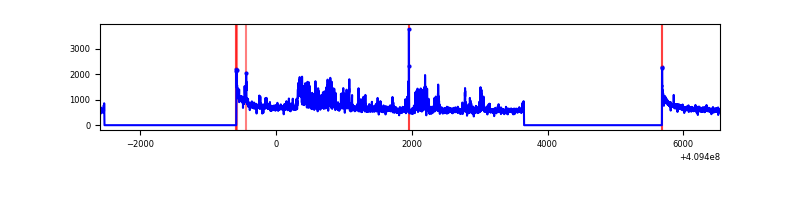 |
| B | 9133 | 5160 | 9 | 9 | 0.10% | 0.17% | 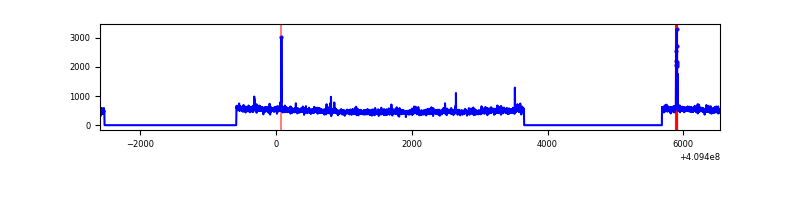 |
| C | 9133 | 5160 | 61 | 61 | 0.67% | 1.18% | 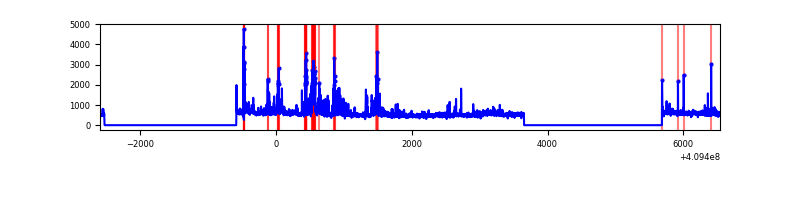 |
| D | 9133 | 5160 | 48 | 48 | 0.53% | 0.93% | 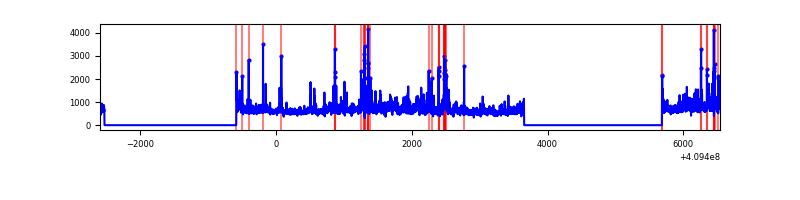 |
Top three noisy pixels from each quadrant. If the there are fewer than three noisy pixels in the level2.evt file, extra rows are filled as -1
| Pixel properties | Quadrant properties | ||||||
|---|---|---|---|---|---|---|---|
| Quadrant | DetID | PixID | Counts | Sigma | Mean | Median | Sigma |
| A | 12 | 16 | 461598 | 3575.52 | 644 | 634 | 128.9 |
| A | 10 | 83 | 407918 | 3159.15 | 644 | 634 | 128.9 |
| A | 15 | 223 | 340468 | 2635.96 | 644 | 634 | 128.9 |
| B | 5 | 172 | 50718 | 415.05 | 638 | 622 | 120.7 |
| B | 0 | 230 | 21110 | 169.74 | 638 | 622 | 120.7 |
| B | 12 | 111 | 14831 | 117.72 | 638 | 622 | 120.7 |
| C | 9 | 187 | 428549 | 3040.09 | 610 | 616 | 140.8 |
| C | 15 | 208 | 232188 | 1645.12 | 610 | 616 | 140.8 |
| C | 15 | 214 | 218894 | 1550.67 | 610 | 616 | 140.8 |
| D | 12 | 235 | 954969 | 6455.71 | 617 | 601 | 147.8 |
| D | 13 | 171 | 91228 | 613.04 | 617 | 601 | 147.8 |
| D | 12 | 233 | 70651 | 473.84 | 617 | 601 | 147.8 |
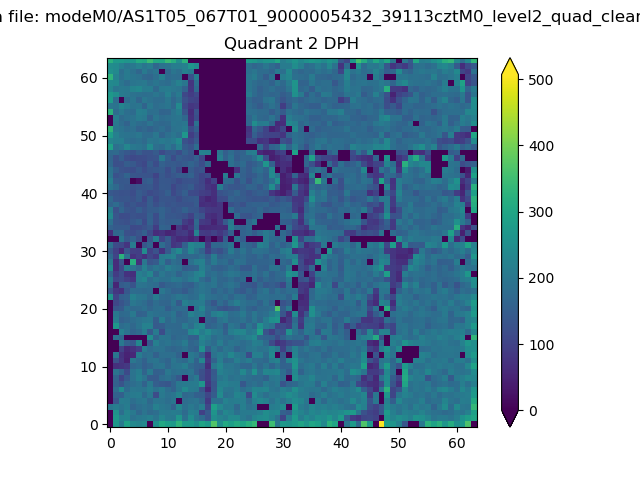
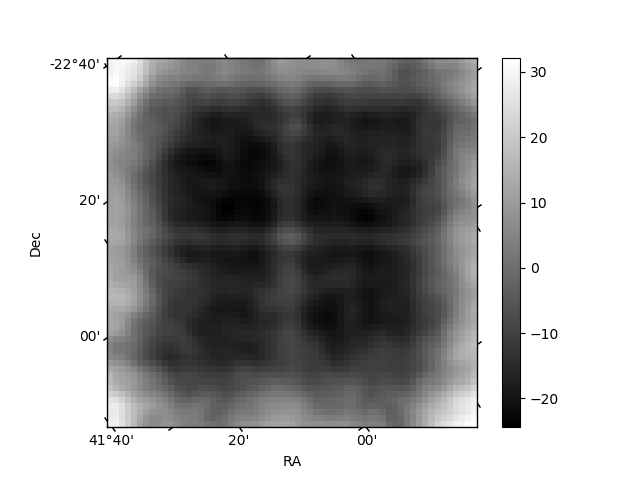
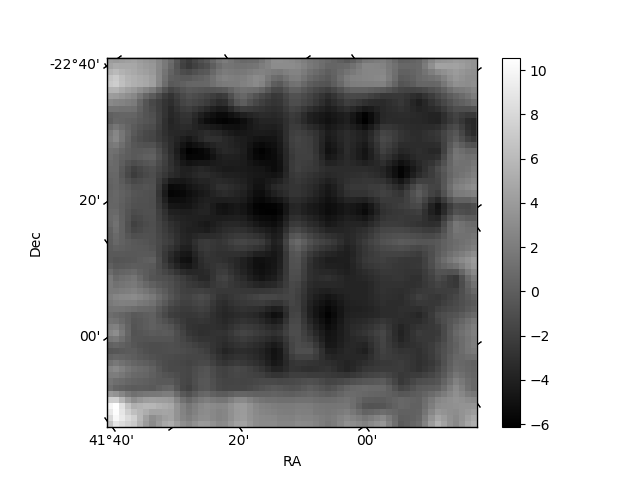
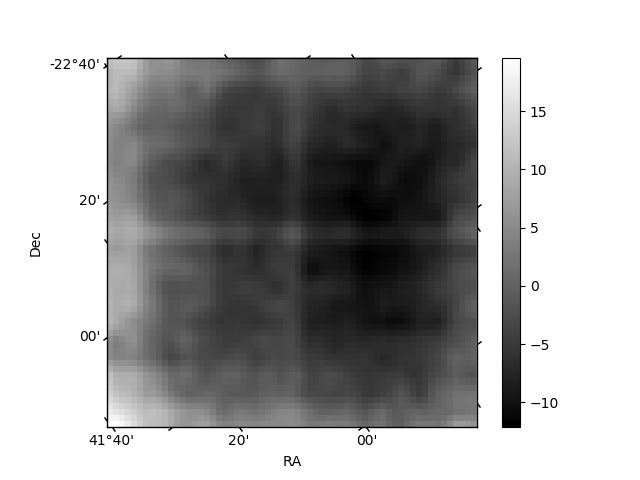
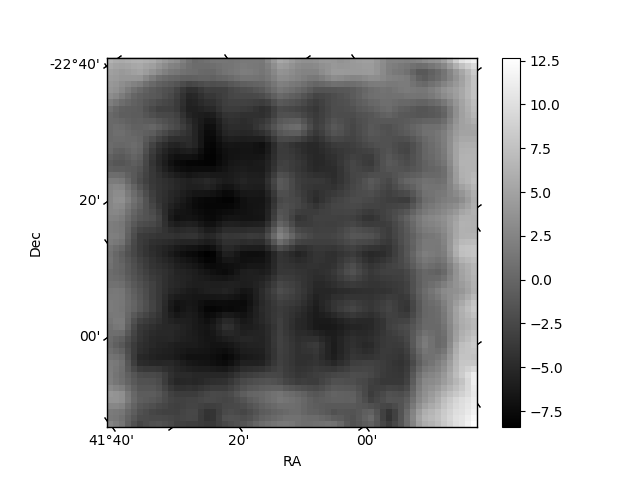
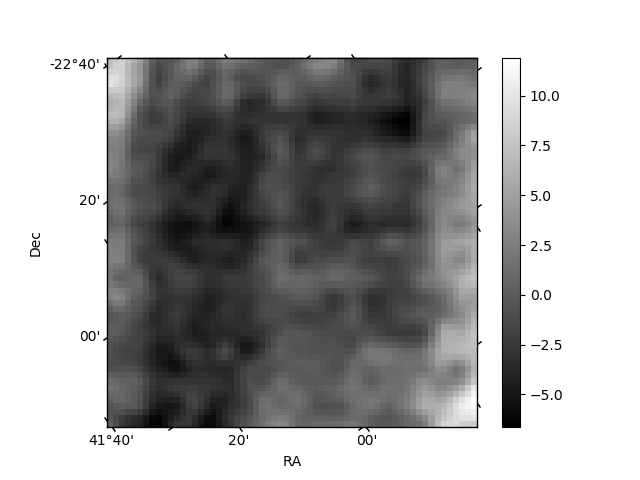
Histogram calculated using DETX and DETY for each event in the final _common_clean file
| Quadrant A | 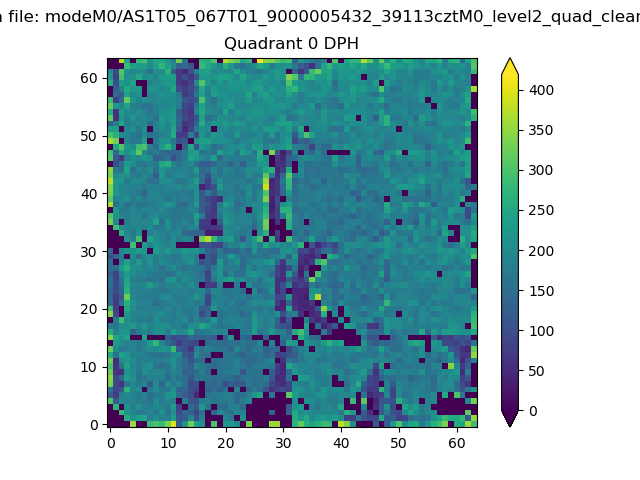 |
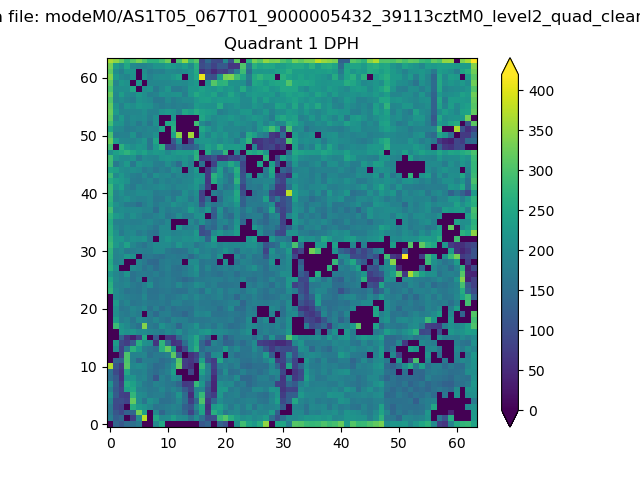 |
Quadrant B |
|---|---|---|---|
| Quadrant D | 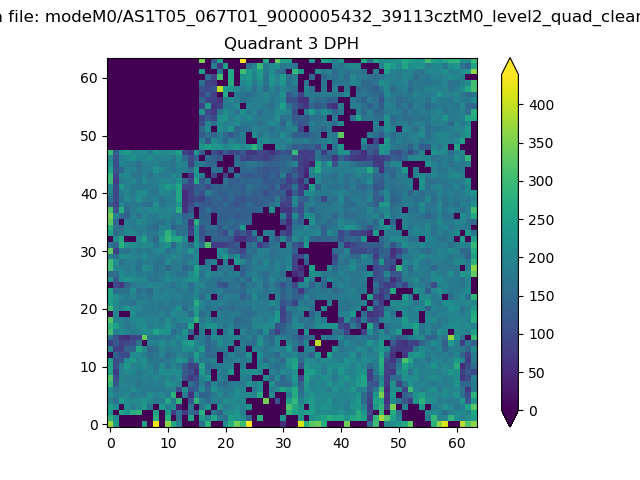 |
 |
Quadrant C |
| Plot type | Count rate plots | Images |
|---|---|---|
| Comparison with Poisson distribution Blue bars denote a histogram of data divided into 1 sec bins. Red curve is a Poisson curve with rate = median count rate of data. |
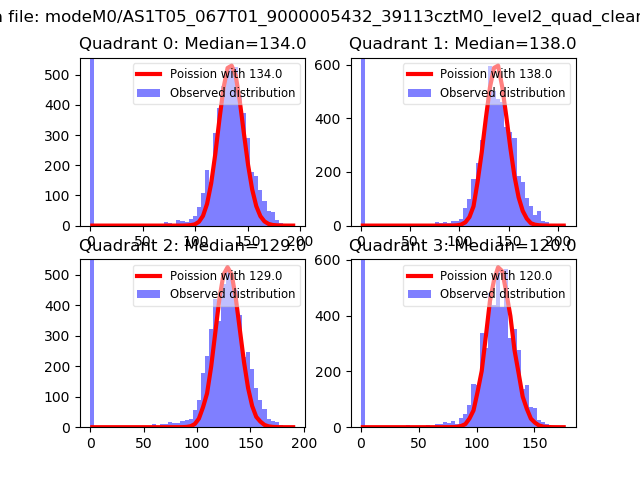 |
 |
| Quadrant-wise count rates Data is divided into 100 sec bins |
 |
|
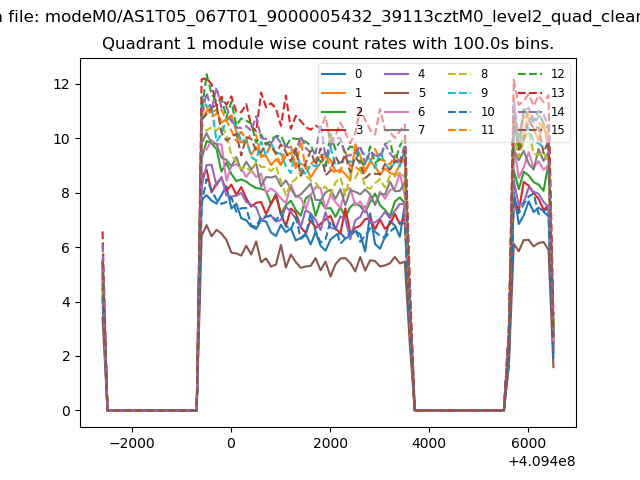
| Module-wise count rates for Quadrant A Data is divided into 100 sec bins |
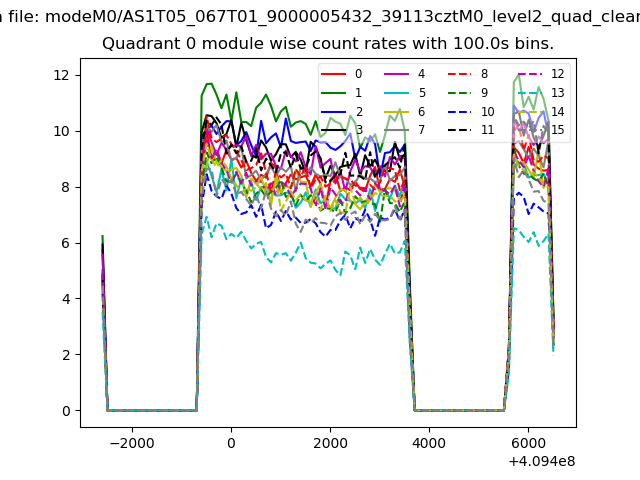 |
 |
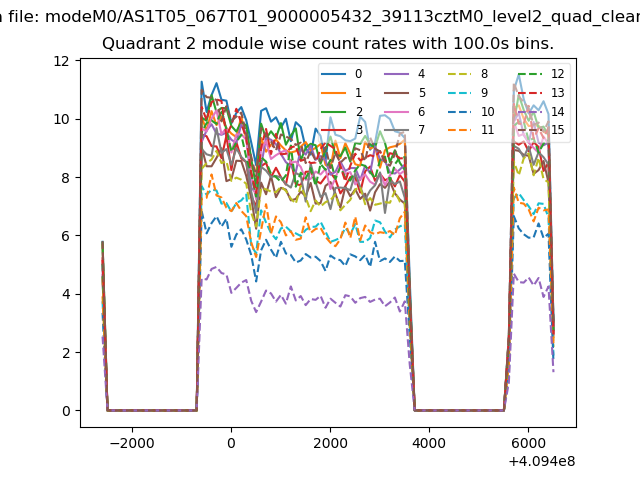
| Module-wise count rates for Quadrant B Data is divided into 100 sec bins |
 |
 |
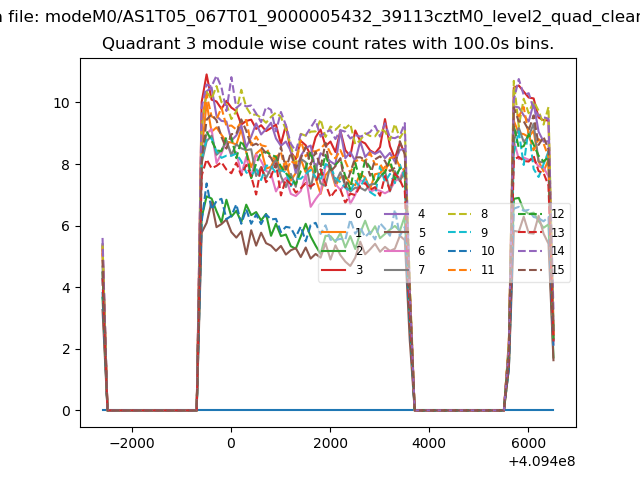
| Module-wise count rates for Quadrant C Data is divided into 100 sec bins |
 |
 |
| Module-wise count rates for Quadrant D Data is divided into 100 sec bins |
 |
 |
| Parameter | Plot |
|---|---|
| CZT HV Monitor | 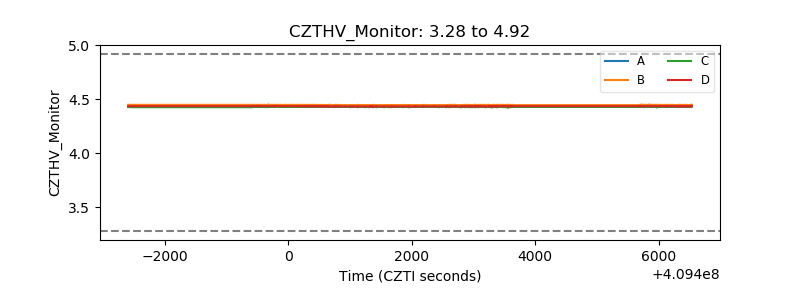 |
| D_VDD |  |
| Temperature 1 | 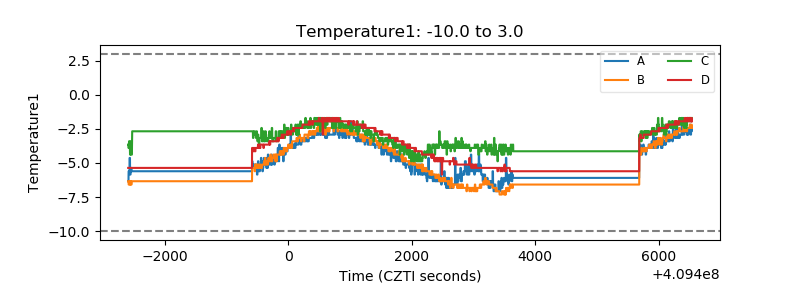 |
| Veto HV Monitor | 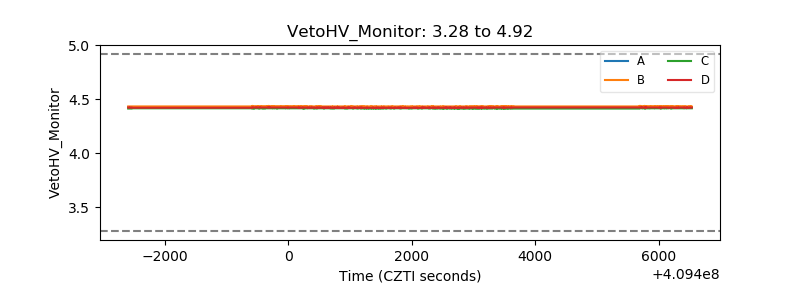 |
| Veto LLD | 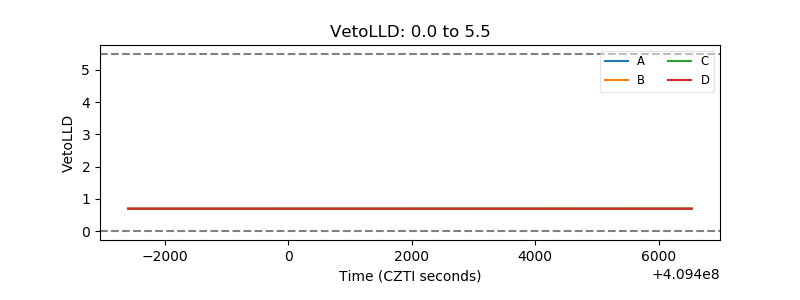 |
| Alpha Counter | 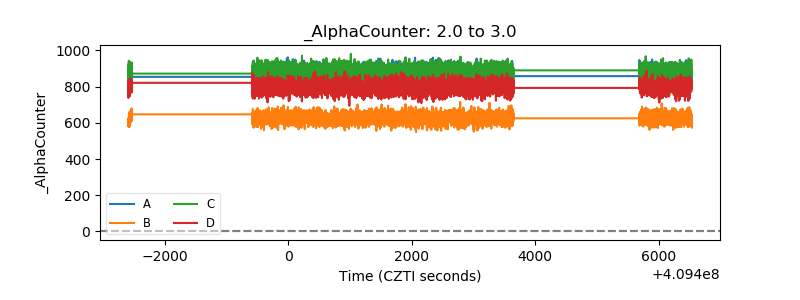 |
| _CPM_Rate | 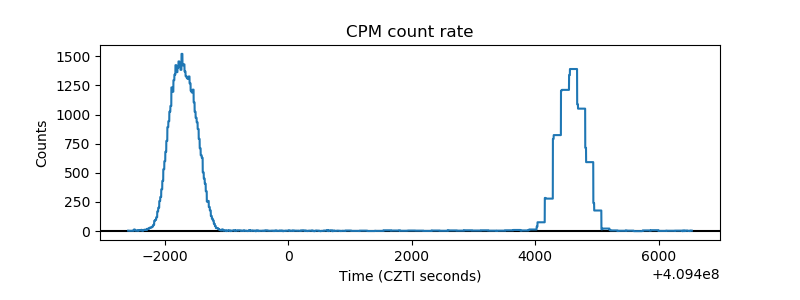 |
| CZT Counter | 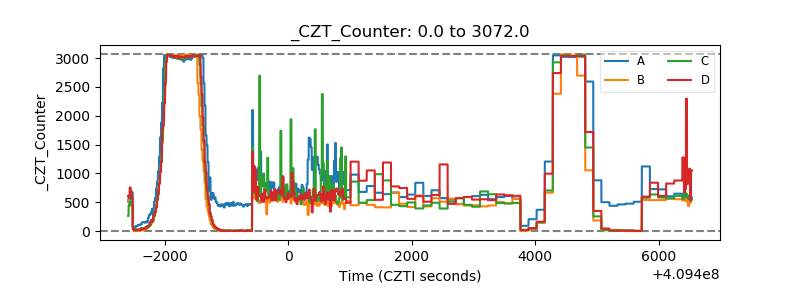 |
| +2.5 Volts monitor | 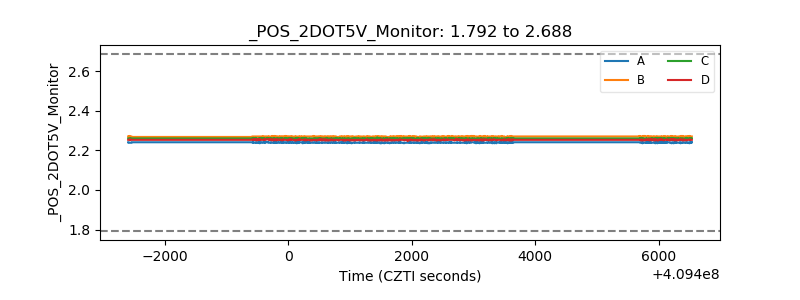 |
| +5 Volts monitor |  |
| _ROLL_ROT | 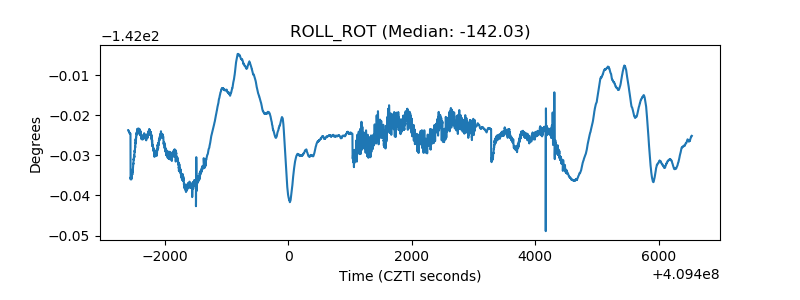 |
| _Roll_DEC | 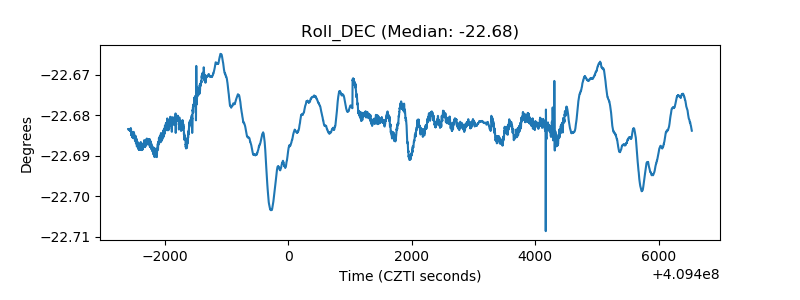 |
| _Roll_RA | 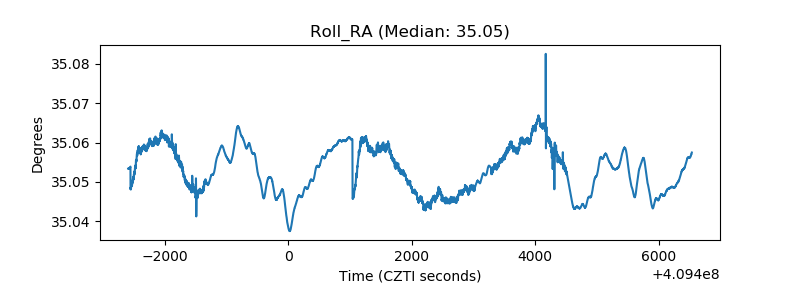 |
| Veto Counter | 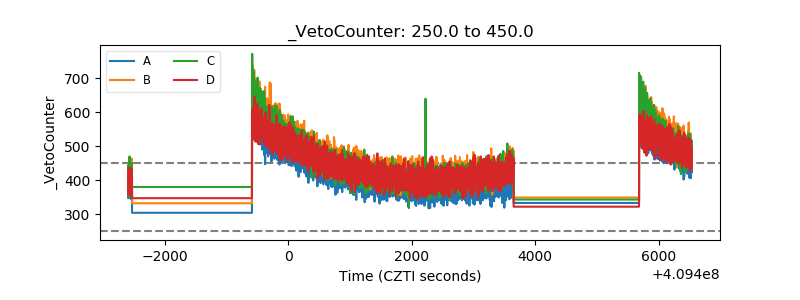 |