| Param | Original file | Final file |
|---|---|---|
| Filename | modeM0/AS1T05_067T01_9000005432_39114cztM0_level2.fits | modeM0/AS1T05_067T01_9000005432_39114cztM0_level2_quad_clean.evt |
| Size (bytes) | 357,269,760 | 93,461,760 |
| Size | 340.7 MB | 89.1 MB |
| Events in quadrant A | 2,995,382 | 650,826 |
| Events in quadrant B | 2,544,830 | 656,815 |
| Events in quadrant C | 2,746,314 | 614,347 |
| Events in quadrant D | 4,557,112 | 564,165 |
| Mode M0 | |||
|---|---|---|---|
| Quadrant | BADHDUFLAG | Total packets | Discarded packets |
| A | 0 | 12090 | 3 |
| B | 0 | 10512 | 2 |
| C | 0 | 11228 | 2 |
| D | 0 | 17123 | 2 |
| Mode SS | |||
|---|---|---|---|
| Quadrant | BADHDUFLAG | Total packets | Discarded packets |
| A | 0 | 100 | 0 |
| B | 0 | 100 | 0 |
| C | 0 | 100 | 0 |
| D | 0 | 100 | 0 |
| Mode M9 | |||
|---|---|---|---|
| Quadrant | BADHDUFLAG | Total packets | Discarded packets |
| A | 0 | 34 | 0 |
| B | 0 | 34 | 0 |
| C | 0 | 34 | 0 |
| D | 0 | 35 | 0 |
| Quadrant | Total seconds | Saturated seconds | Saturation percentage |
|---|---|---|---|
| A | 4906 | 18 | 0.366898% |
| B | 4906 | 68 | 1.386058% |
| C | 4906 | 9 | 0.183449% |
| D | 4906 | 134 | 2.731349% |
Noise dominated data is calculated using 1-second bins in cleaned event files. If a bin has >2000 counts, and if more than 50% of those come from <1% of pixels, then it is considered to be noise-dominated and hence unusable.
| Quadrant | # 1 sec bins | Bins with >0 counts | Bins with >2000 counts | High rate bins dominated by noise | Noise dominated (total time) | Noise dominated (detector-on time) | Marked lightcurve |
|---|---|---|---|---|---|---|---|
| A | 7029 | 4907 | 5 | 5 | 0.07% | 0.10% | 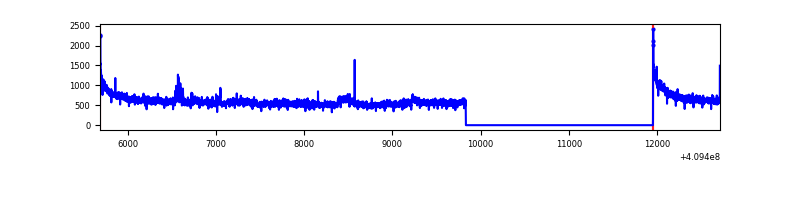 |
| B | 7029 | 4907 | 46 | 46 | 0.65% | 0.94% | 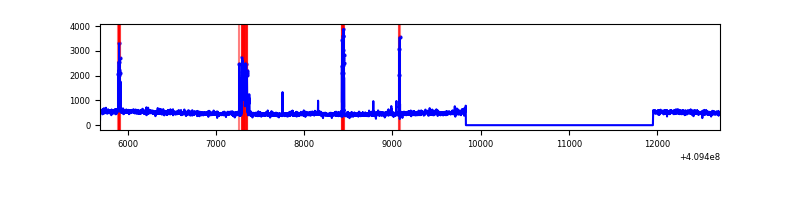 |
| C | 7029 | 4907 | 8 | 8 | 0.11% | 0.16% | 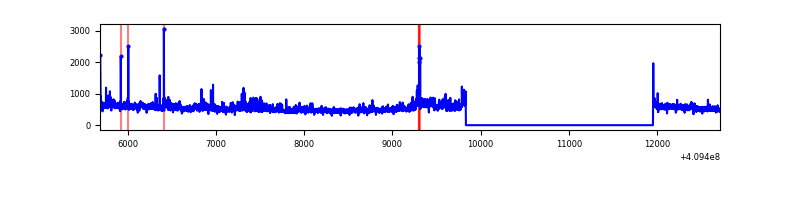 |
| D | 7029 | 4907 | 140 | 140 | 1.99% | 2.85% | 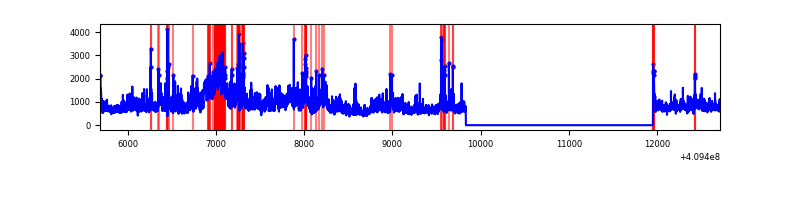 |
Top three noisy pixels from each quadrant. If the there are fewer than three noisy pixels in the level2.evt file, extra rows are filled as -1
| Pixel properties | Quadrant properties | ||||||
|---|---|---|---|---|---|---|---|
| Quadrant | DetID | PixID | Counts | Sigma | Mean | Median | Sigma |
| A | 10 | 83 | 404701 | 3342.35 | 600 | 588 | 120.9 |
| A | 15 | 223 | 236700 | 1952.84 | 600 | 588 | 120.9 |
| A | 12 | 16 | 22464 | 180.93 | 600 | 588 | 120.9 |
| B | 15 | 85 | 97975 | 868.48 | 590 | 576 | 112.1 |
| B | 0 | 199 | 55812 | 492.52 | 590 | 576 | 112.1 |
| B | 5 | 172 | 48968 | 431.5 | 590 | 576 | 112.1 |
| C | 15 | 208 | 233378 | 1769.54 | 567 | 572 | 131.6 |
| C | 15 | 214 | 208029 | 1576.87 | 567 | 572 | 131.6 |
| C | 9 | 187 | 79314 | 598.51 | 567 | 572 | 131.6 |
| D | 12 | 235 | 1675839 | 12018.11 | 569 | 554 | 139.4 |
| D | 2 | 153 | 273502 | 1958.07 | 569 | 554 | 139.4 |
| D | 12 | 233 | 161576 | 1155.13 | 569 | 554 | 139.4 |
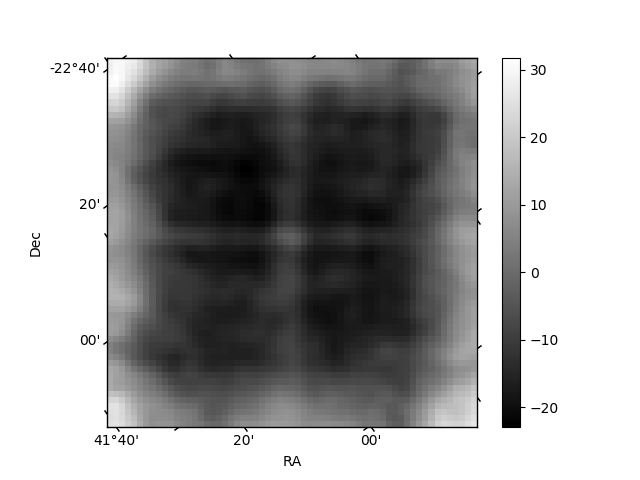
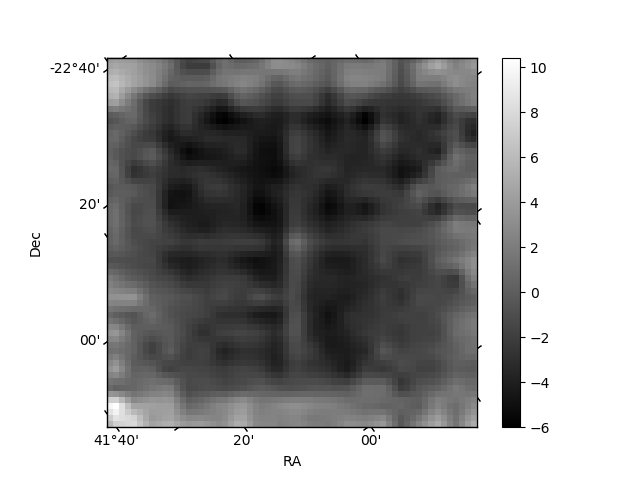
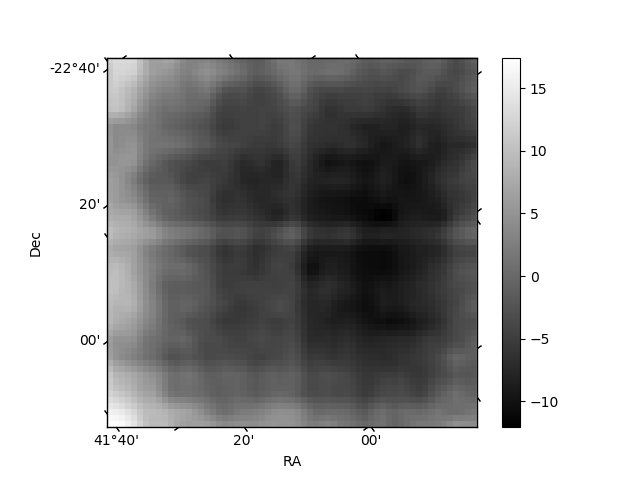
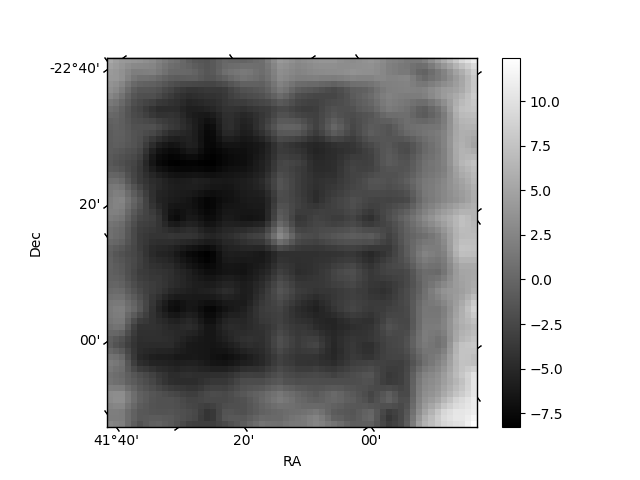
Histogram calculated using DETX and DETY for each event in the final _common_clean file
| Quadrant A | 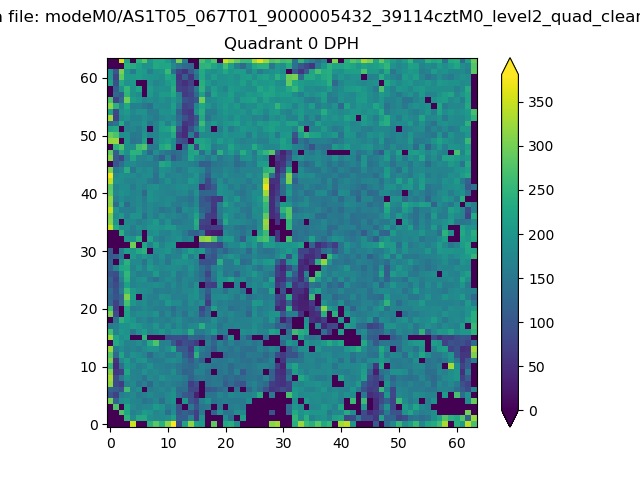 |
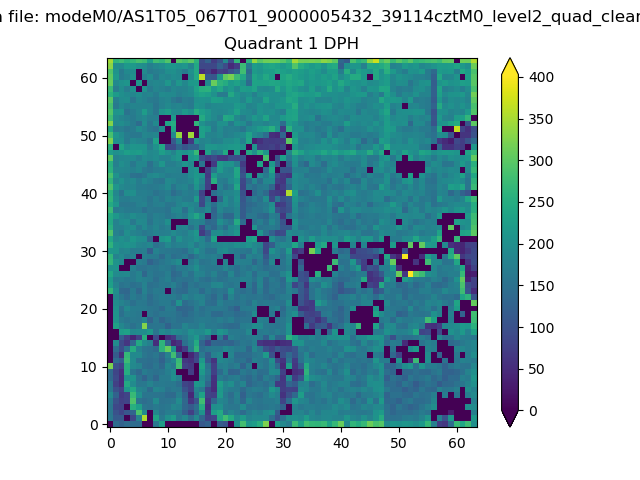 |
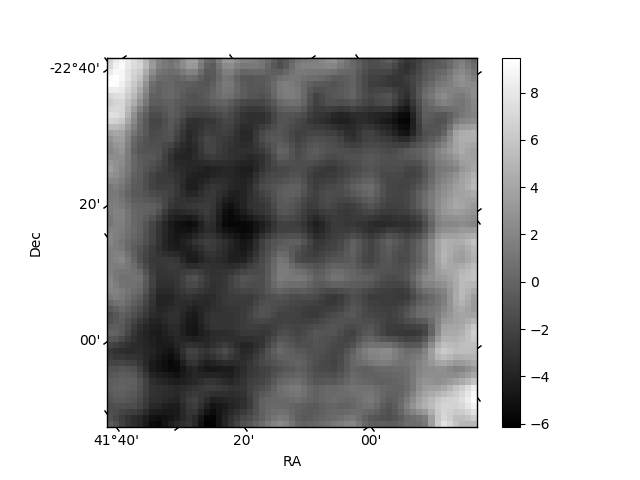
Quadrant B |
|---|---|---|---|
| Quadrant D | 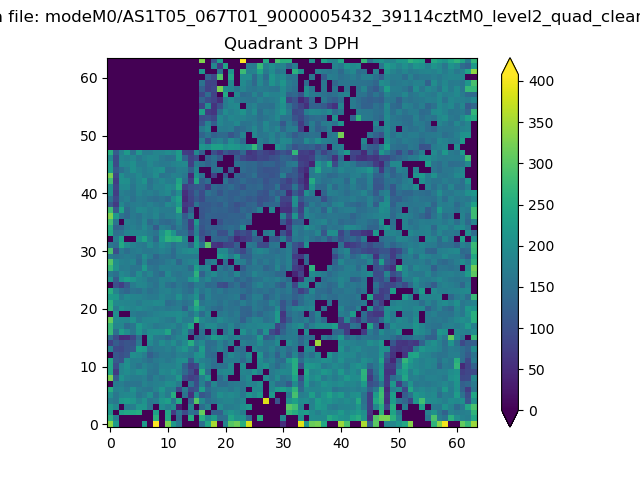 |
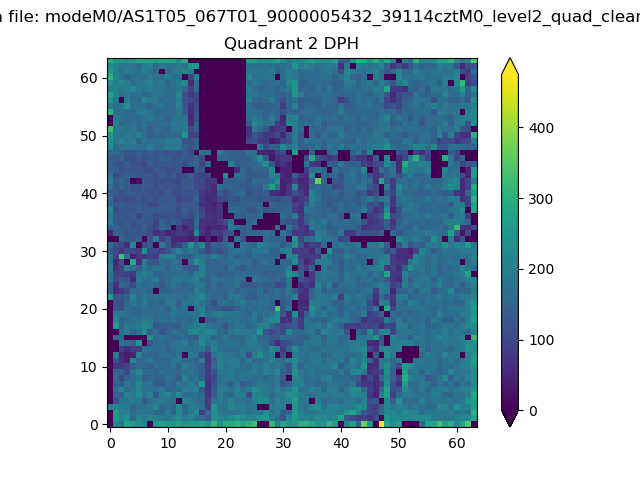 |
Quadrant C |
| Plot type | Count rate plots | Images |
|---|---|---|
| Comparison with Poisson distribution Blue bars denote a histogram of data divided into 1 sec bins. Red curve is a Poisson curve with rate = median count rate of data. |
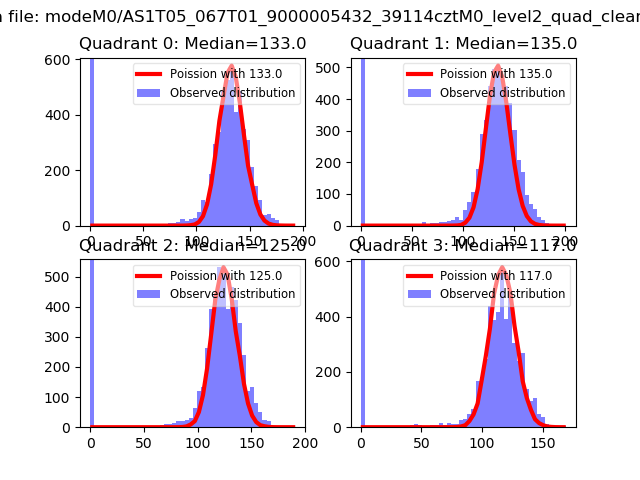 |
 |
| Quadrant-wise count rates Data is divided into 100 sec bins |
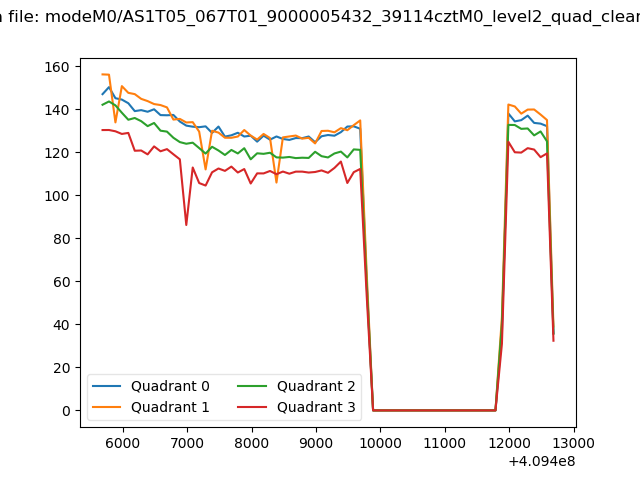 |
|
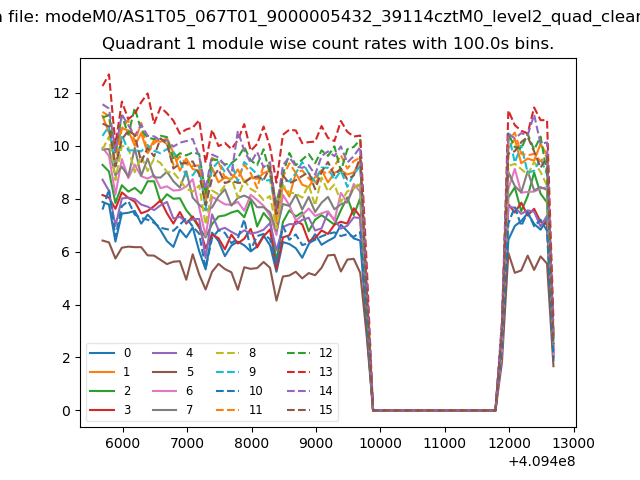
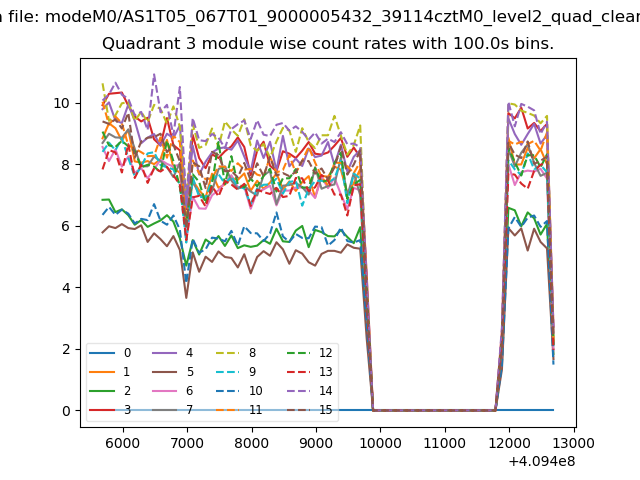
| Module-wise count rates for Quadrant A Data is divided into 100 sec bins |
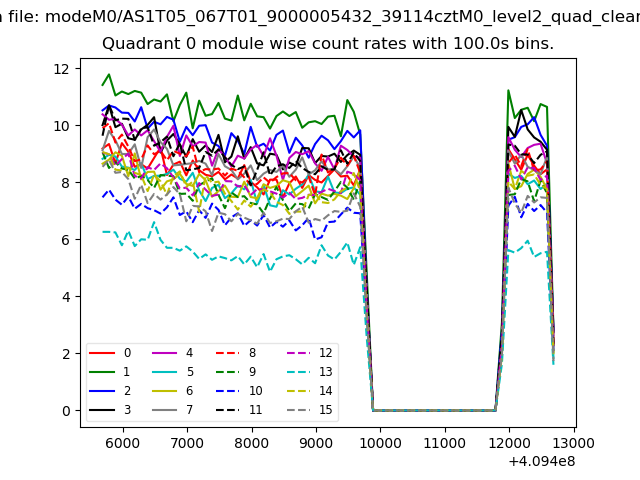 |
 |
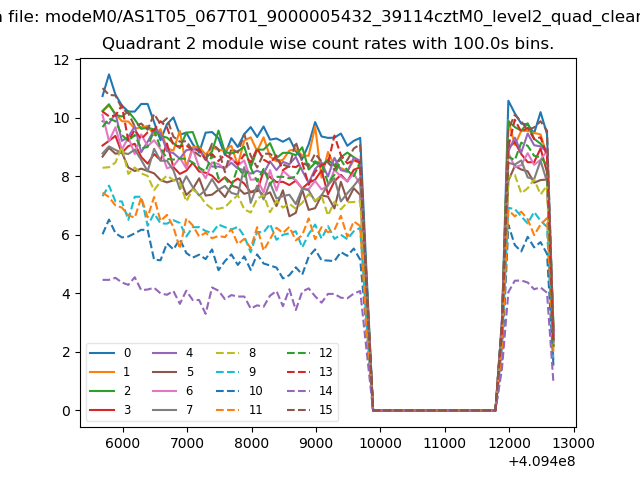
| Module-wise count rates for Quadrant B Data is divided into 100 sec bins |
 |
 |
| Module-wise count rates for Quadrant C Data is divided into 100 sec bins |
 |
 |
| Module-wise count rates for Quadrant D Data is divided into 100 sec bins |
 |
 |
| Parameter | Plot |
|---|---|
| CZT HV Monitor | 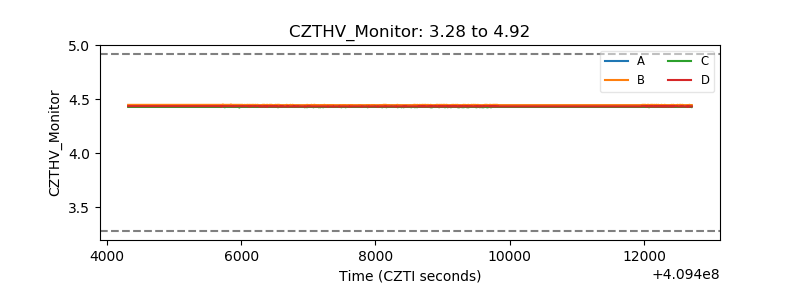 |
| D_VDD | 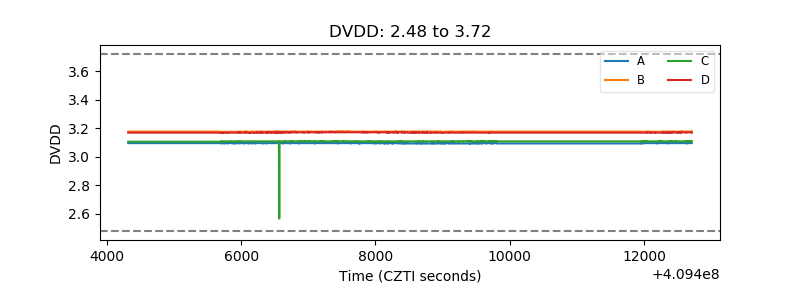 |
| Temperature 1 | 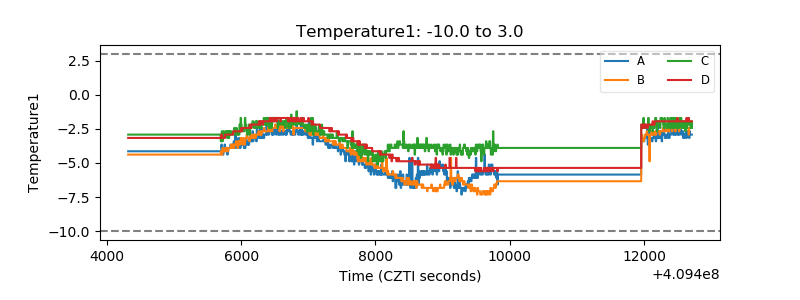 |
| Veto HV Monitor | 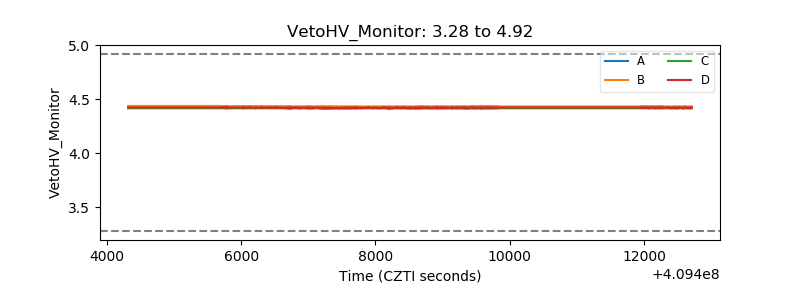 |
| Veto LLD | 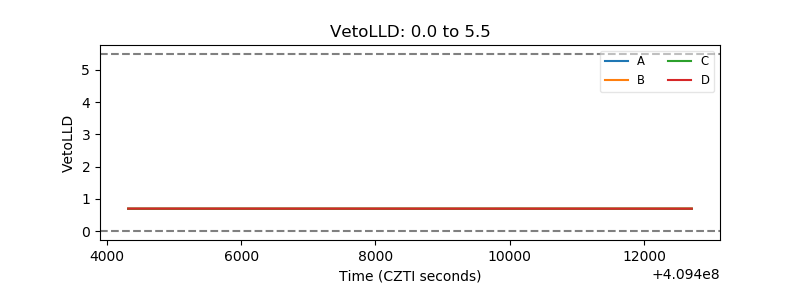 |
| Alpha Counter | 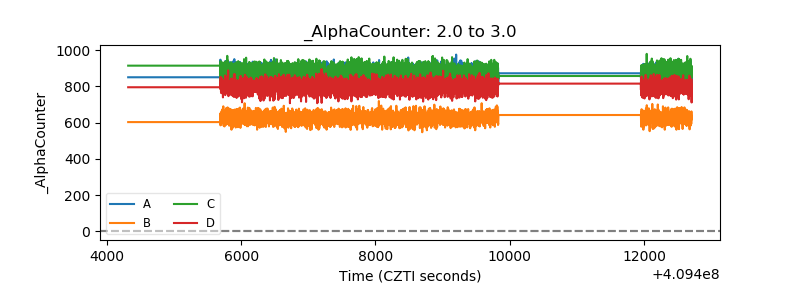 |
| _CPM_Rate | 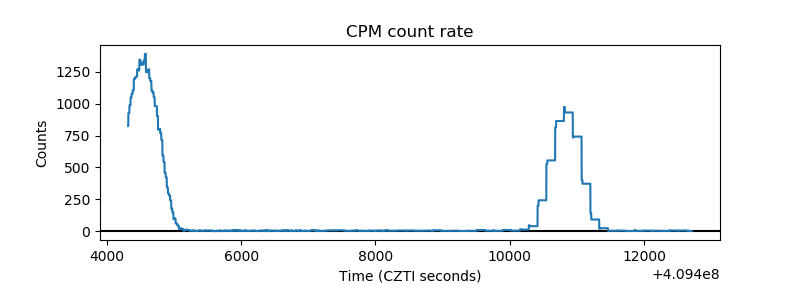 |
| CZT Counter | 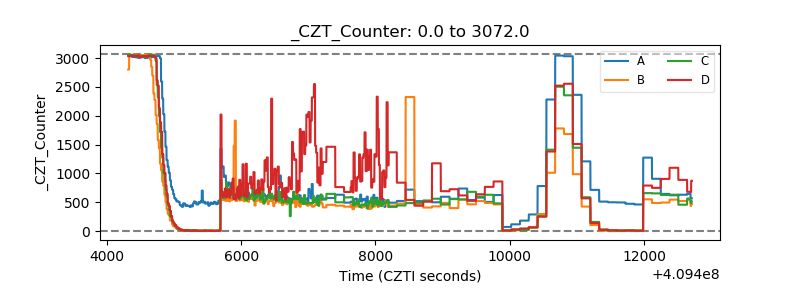 |
| +2.5 Volts monitor | 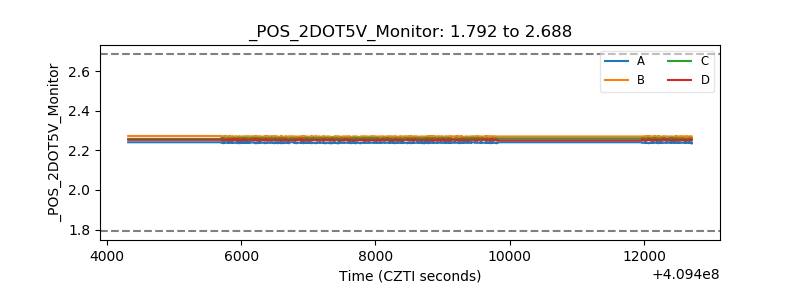 |
| +5 Volts monitor | 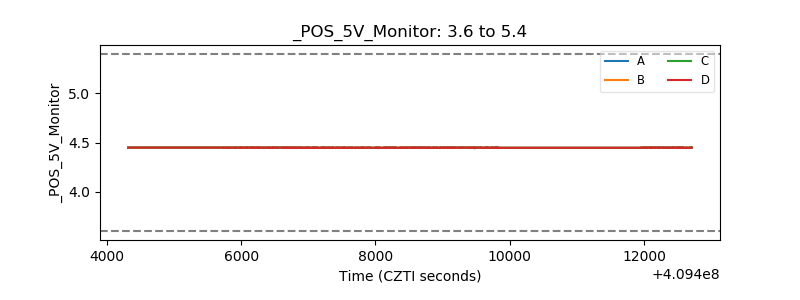 |
| _ROLL_ROT | 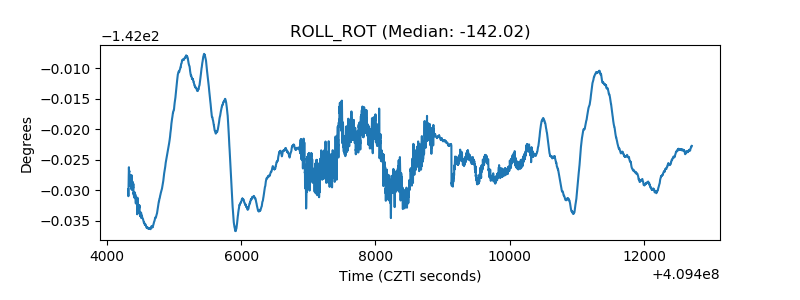 |
| _Roll_DEC | 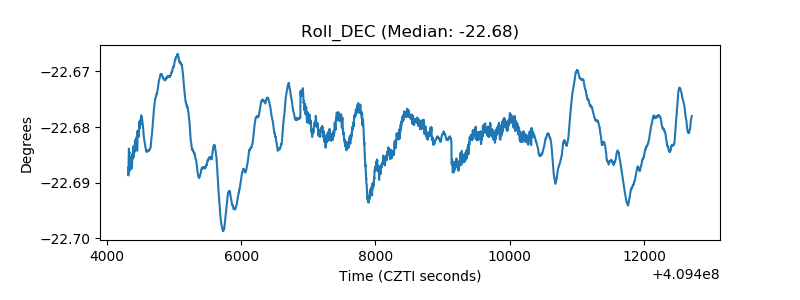 |
| _Roll_RA | 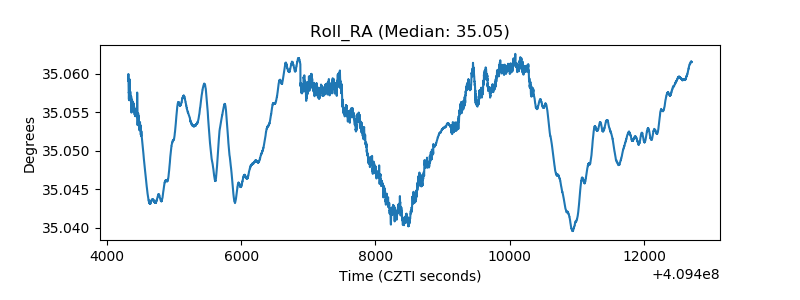 |
| Veto Counter | 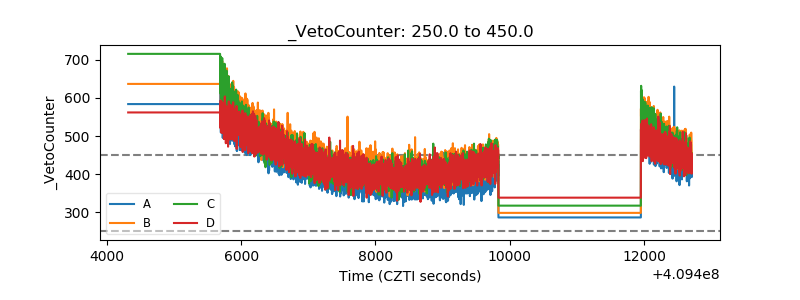 |